Editor’s note: This was first published on Mike Petrilli’s Substack, SCHOOLED.
Based on my inbox and social media feeds, the big education news over the past few weeks was Zohran Mamdani’s proposal to scrap New York City’s gifted education program in grades K–2—and the fierce backlash it sparked. I suspect that might surprise some of my left-leaning friends, for whom this discussion is likely largely invisible. I think that’s telling. And why I’m writing this.
It’s not that Mamdani’s proposal is actually all that terrible. The Big Apple is a real outlier in starting its gifted program so early, and in making tiny tikes leave their neighborhood schools and trek across town to other campuses. As former New York Daily News editor Josh Greenman (the father of a gifted-program participant himself) wrote the other day, all of us should have mixed feelings about New York’s program design.
A much better approach—one endorsed by the (ideologically diverse) National Working Group on Advanced Education that I chaired back in 2023—is to provide advanced education at every elementary school for their top students. Under Mayor Eric Adams, New York has been moving in that direction, and with it, has been diversifying its gifted education population. But it still starts in kindergarten and now relies on teacher recommendations, which can introduce all kinds of bias.
Still, I suspect that most of the folks on the right and center who responded angrily to Mandani’s proposal didn’t get past the headlines. “Socialist wants to kill gifted education” surely triggered some PTSD among these folks, as it harkens back to the darkest days of the Great Awokening when any effort to promote “merit” or “excellence” was branded as racist. As AEI’s James Pethokoukis put it, “true equality shouldn’t mean slowing the swift. How is this not obvious?” Or cue the Wall Street Journal editorial page: “Socialism in a nutshell: A persistent fear that somebody, somewhere, might be getting ahead and ought to be yanked back.”
As a booster of advanced education, though, it bothers me that this issue is so polarized. A recurring theme of my writing—and this newsletter—is that reform advocates should always want our preferred policies to gain bipartisan support. That’s not always possible (see: private school choice) but when it is, it makes for a stronger and more durable coalition.
But eliminating gifted education isn’t something that should only rile up conservatives or “neoliberals.” The left should worry about academically talented kids, too, especially those from marginalized backgrounds. Once such students get older, progressive groups have been strong in their support of efforts to challenge them. Organizations such as Education Trust have long promoted initiatives to expand access to advanced courses in high school. And increasingly, these groups are getting behind acceleration at the middle school level, too, with widening support for “automatic enrollment into advanced courses” policies, as we’re seeing in North Carolina, Texas, and Washington. An initiative to promote such policies even won a big award last week at the PIE Network’s Eddies ceremony—a sign that ed reformers across the ideological spectrum think this is a good idea.
But gifted education in elementary school? That’s a much harder sell. Fordham did some fact finding last year to determine the level of support for such initiatives among reform groups and education philanthropists, and the results were disheartening. Almost nobody wanted to touch it.
Maybe it’s the term “gifted,” which is burdened with a suspect, progressive-era history. It smacks of determinism, of early sorting. But I also think it’s something about the identifying, and separating, kids when they are so young that rubs many folks on the left the wrong way.
So here’s my suggestion for depolarizing “gifted education,” including in elementary school (much of which is in line with what the Working Group recommended two years ago):
Drop the “gifted” label and talk about “advanced education” instead.
Take equity concerns seriously by embracing “universal screening” to identify kids with academic talent, such as through tests that everybody takes, rather than relying on parental nominations or teacher recommendations, which can introduce racial and class bias.
Build advanced education initiatives into every elementary school in the country, serving at least the top 10 percent of students in each campus. In some schools—typically high-poverty ones—some of those students won’t be all that high performing compared to district, state, or national “norms.” But with support and challenge, lots more will turn out to show great potential and can catch up to their high-achieving peers. Such students will be disproportionately Black, Hispanic, and from low-income families. This is how to close the “excellence gap” and build a diverse pipeline into higher education (including selective colleges) and beyond.
That’s my recipe. Will it work? What else might help to gain support for such efforts at the elementary level, in order to make “advanced education” a bipartisan issue? Please weigh in!
The national conversation about education, to the extent that one is actually happening, tends to come in two dialects today. The first involves a lot of appropriate hand-wringing about the declinein student achievement that started about 10 or 12 years ago, before the pandemic sent it over a cliff. This has been particularly acute for our lowest-performing students, who are disproportionately poor, Black, and Hispanic.
The more hopeful discussion is about Mississippi and some of its southern peers, which have bucked these trends, or at least made more progress against the headwinds than the rest of the country. That has, in turn, spurred some excellent journalism about why California, New England, and other states and regions have allowed themselves to fall so far behind.
But what’s hardly ever said in either of these conversations is that the declines we’ve seen since 2013 or so came on the heels of two decades of remarkable progress. Perhaps my fellow ed-policy wonks understand that, but I doubt the general public does. And we can’t say it often enough.
That’s for two key reasons. First, as Kant said, the actual proves the possible. It’s important to give people hope that we can turn around today’s challenging circumstances because we did it before, not so long ago. And second, some of the same policies and approaches that worked last time around might work again today. The conventional wisdom might be that education reform failed, but that is factually and historically incorrect.
Which is what made David Brooks’s New York Times column last week all the more praiseworthy. He noted that Republicans “are now kicking Democrats in the butt” on education policy—but more importantly—he reminded readers about the huge progress we made during the reform era:
Student achievement test scores in reading, math, and most other academic subjects shot upward between the mid-1990s and about 2013. In 1990, 48 percent of America’s eighth graders scored below basic competency in math. But by 2013 that was down to just 26 percent. The best part of this progress was that the scores of the most disadvantaged students shot up the most. Among Black students, the share of those scoring below basic in math fell from 78 percent to 48 percent. Among Hispanic students, it fell from 66 percent to 38 percent.
Student outcomes are rarely just about what happens in the schools. The policies of that so-called neoliberal era helped, too. Economic growth was strong; income inequality decreased. Between 1983 and 2010, the child poverty rate fell from 30 percent to about 17 percent.
Those are enormous gains, amounting to two to three grade levels of progress over the course of a generation or two of students. We would love to see that kind of progress today!
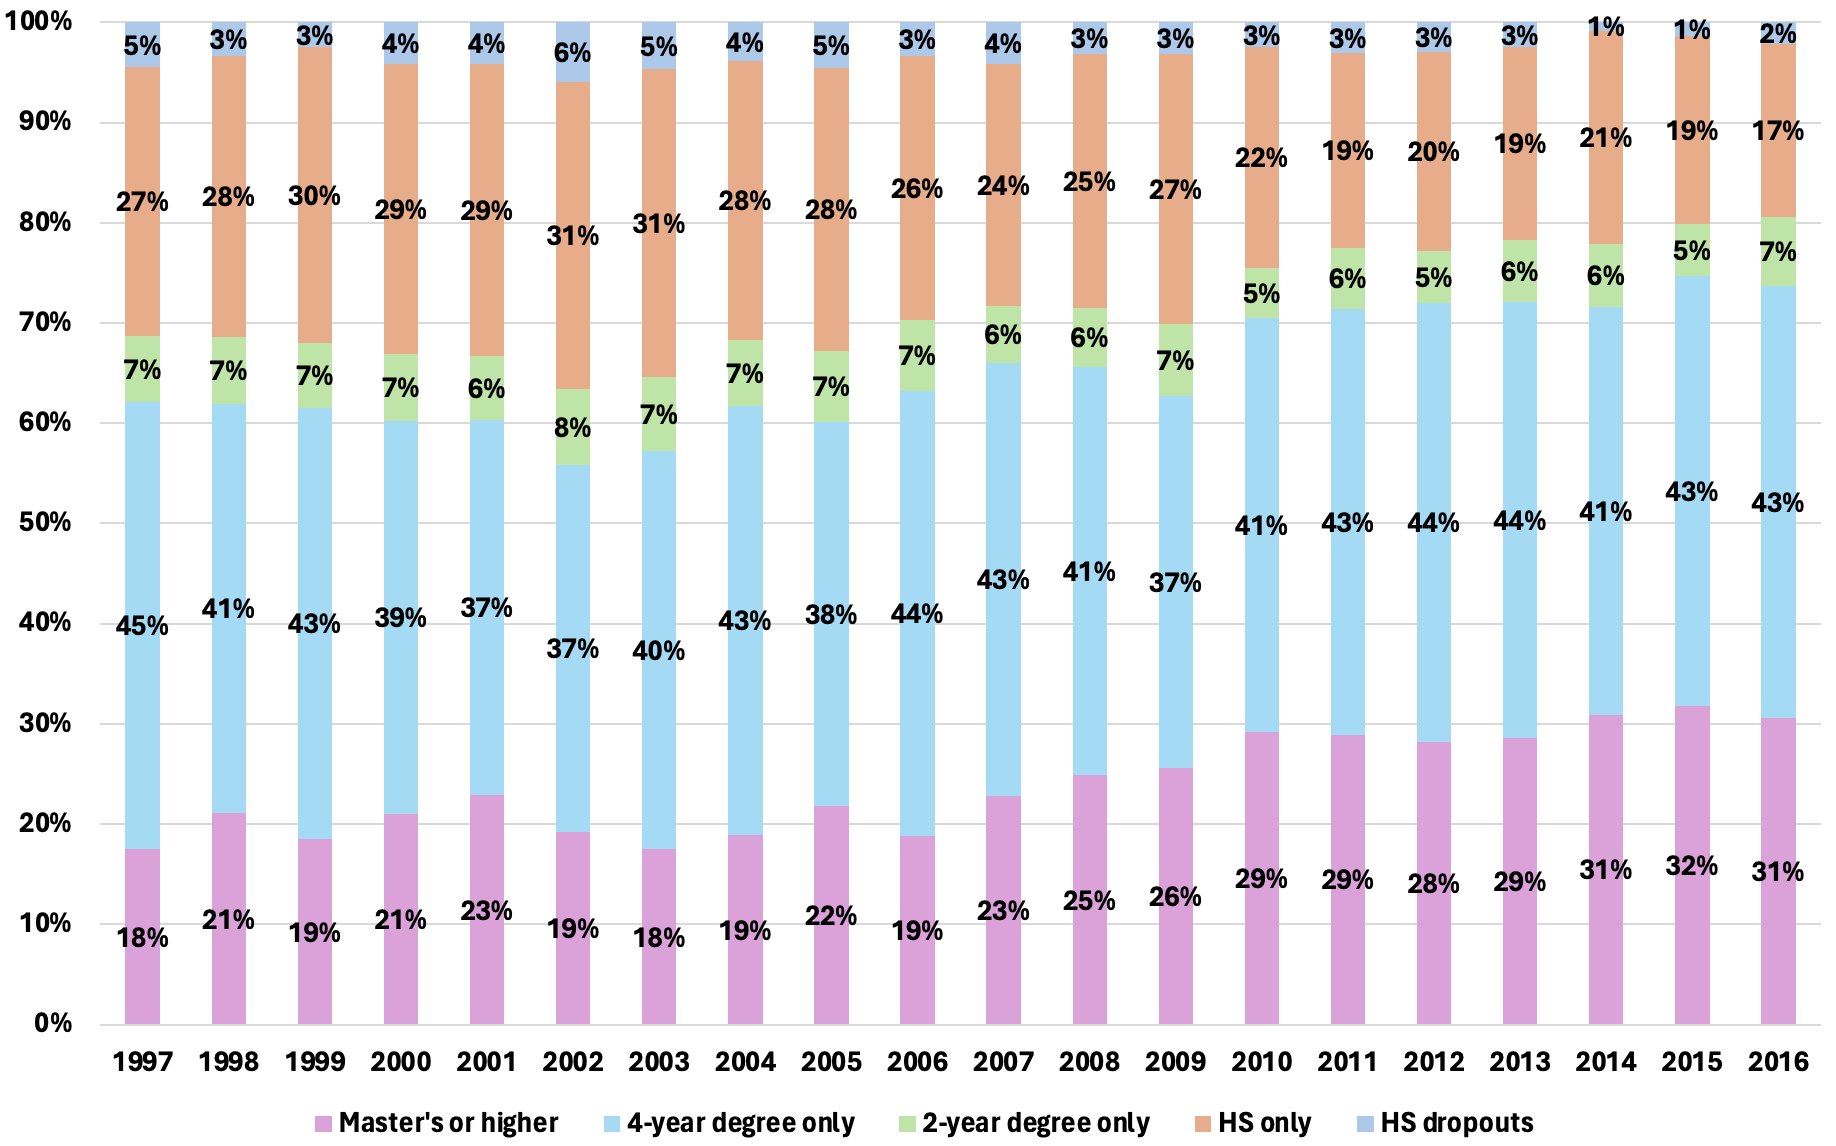
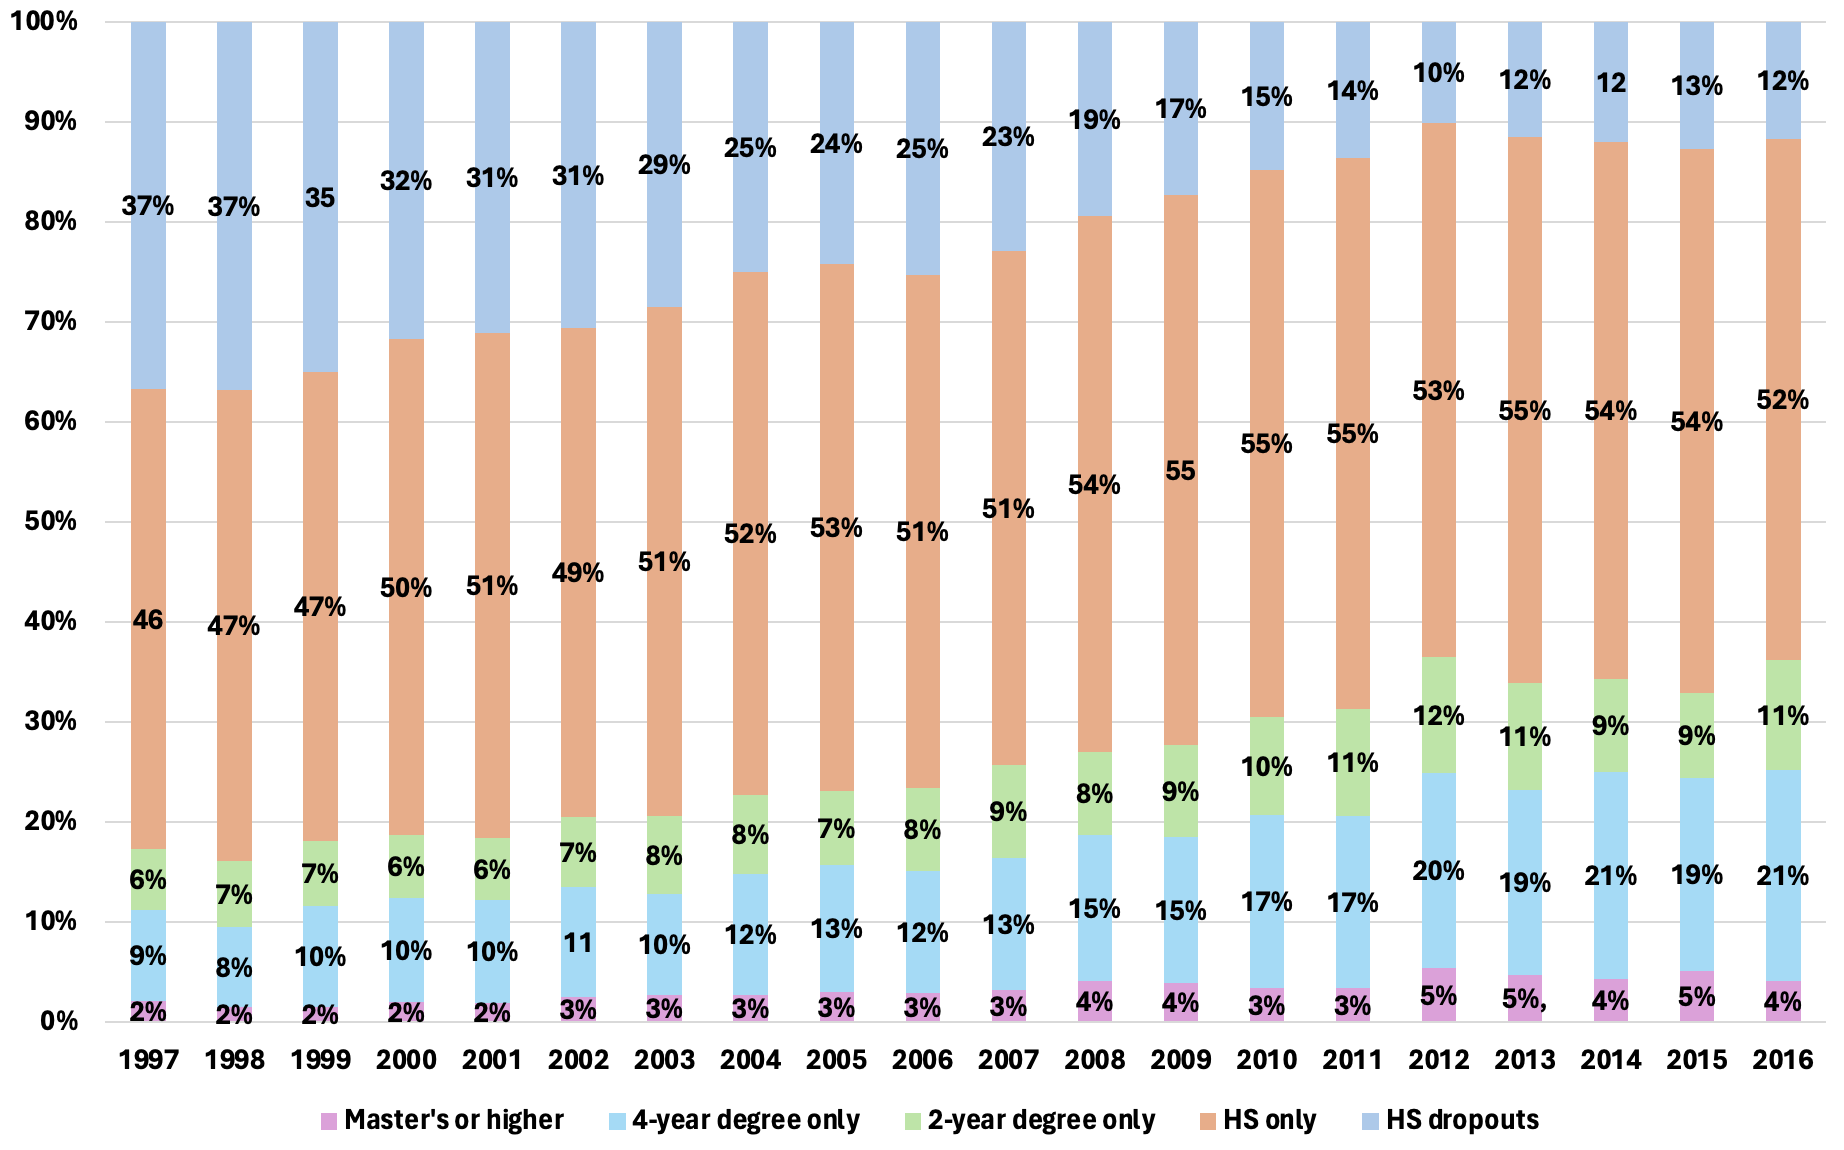
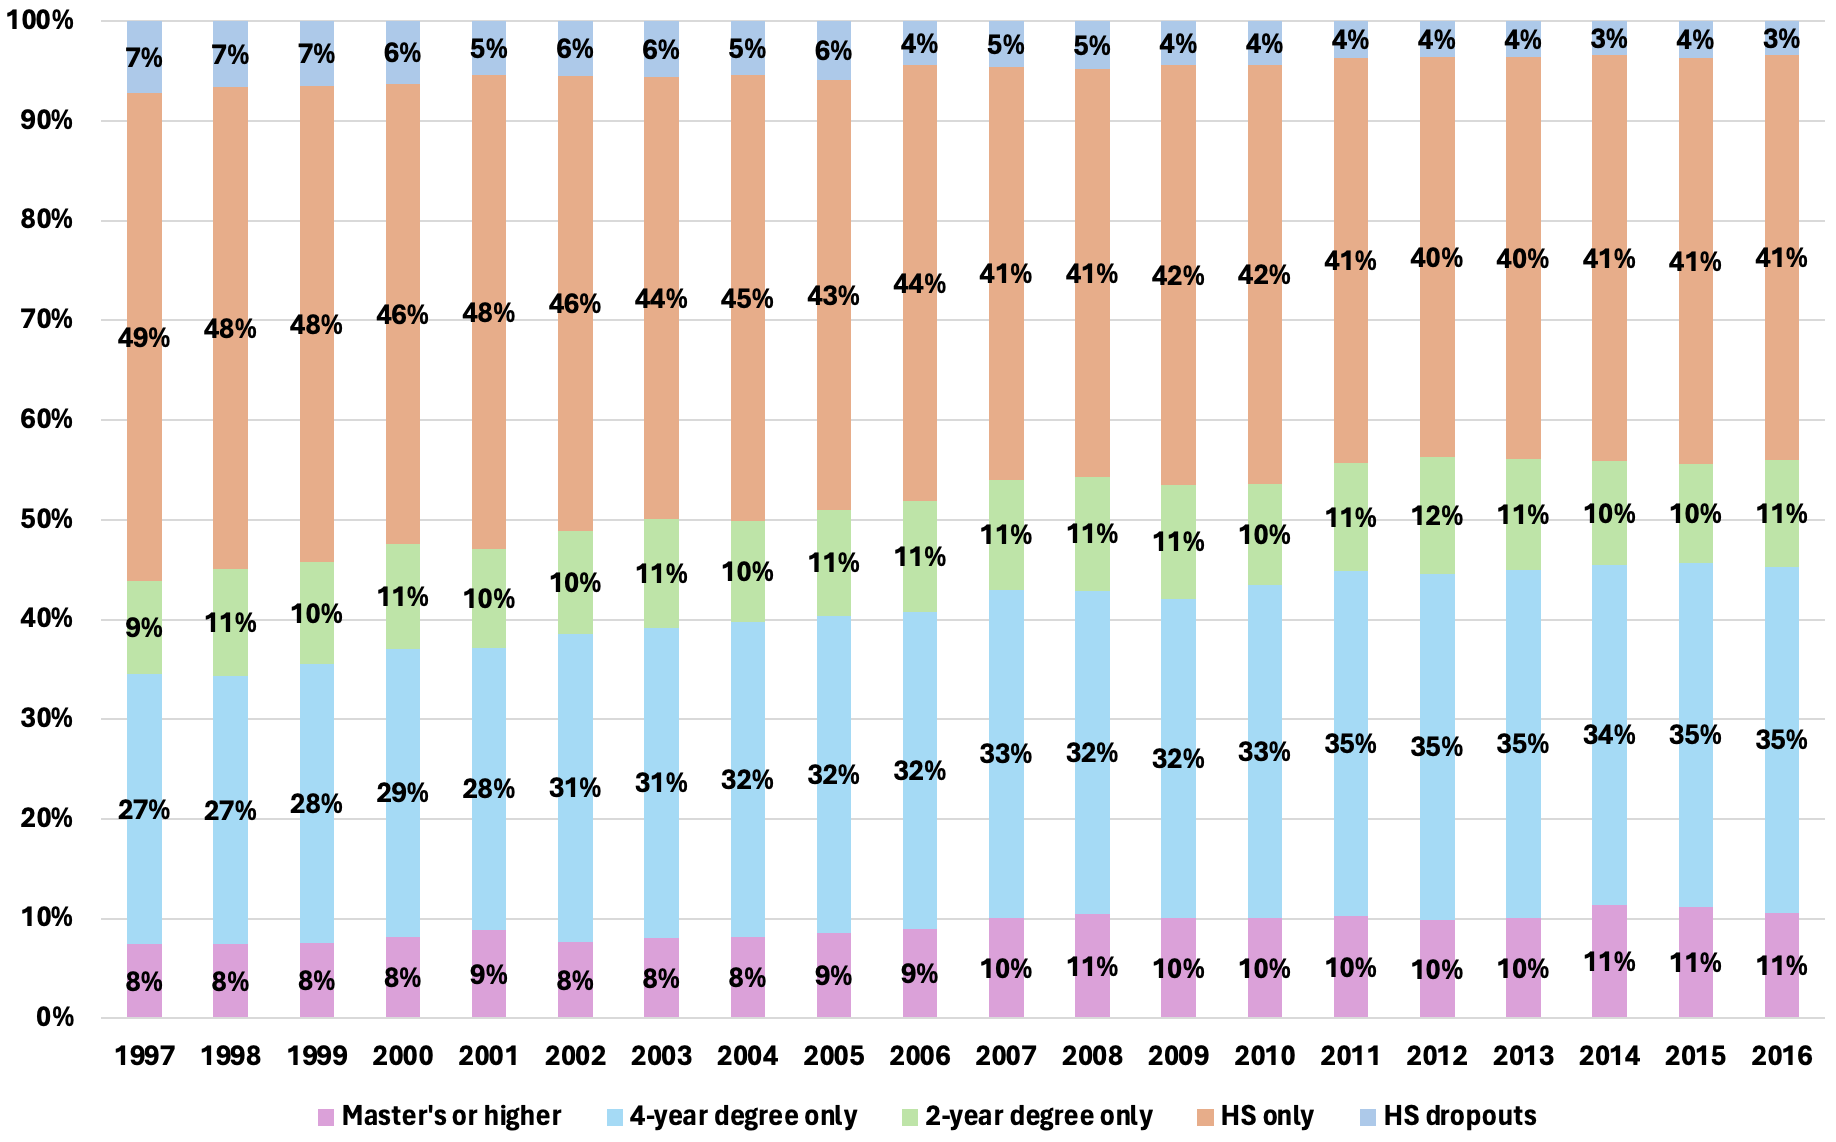
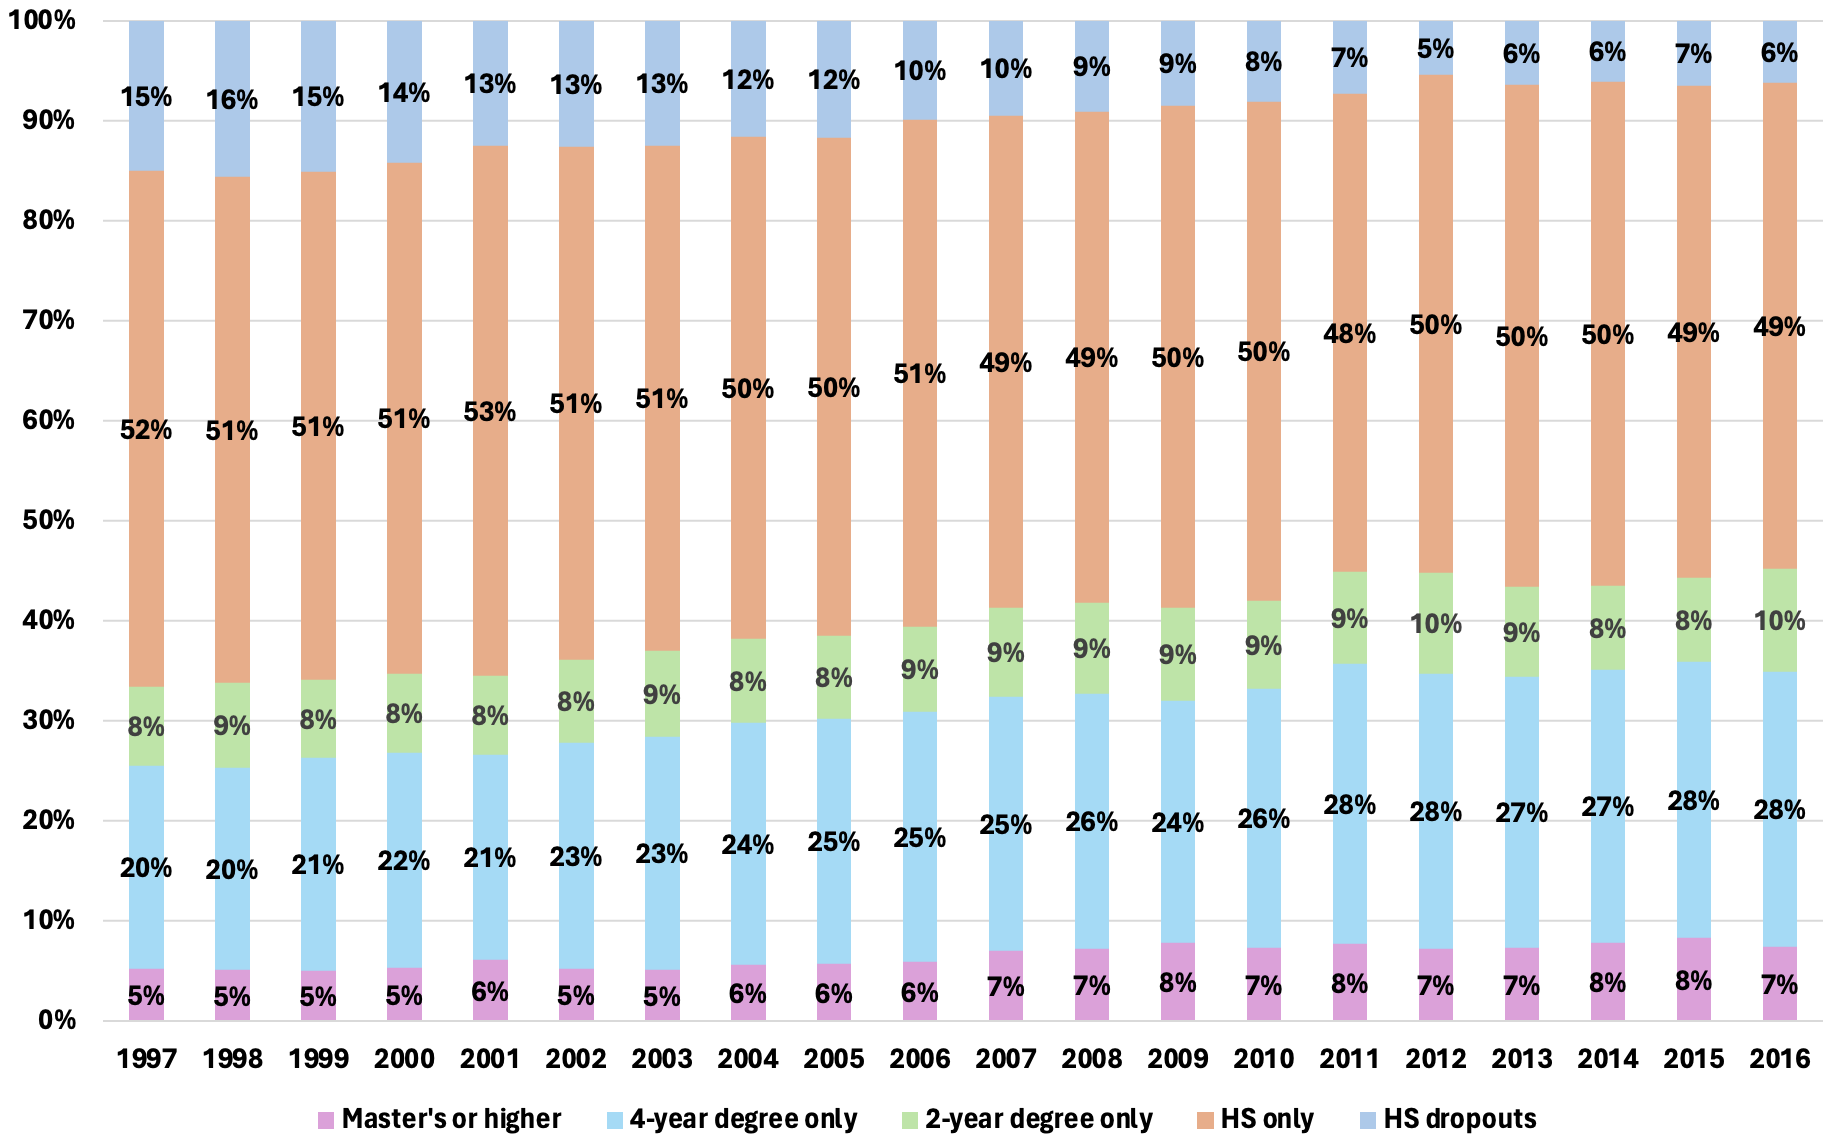
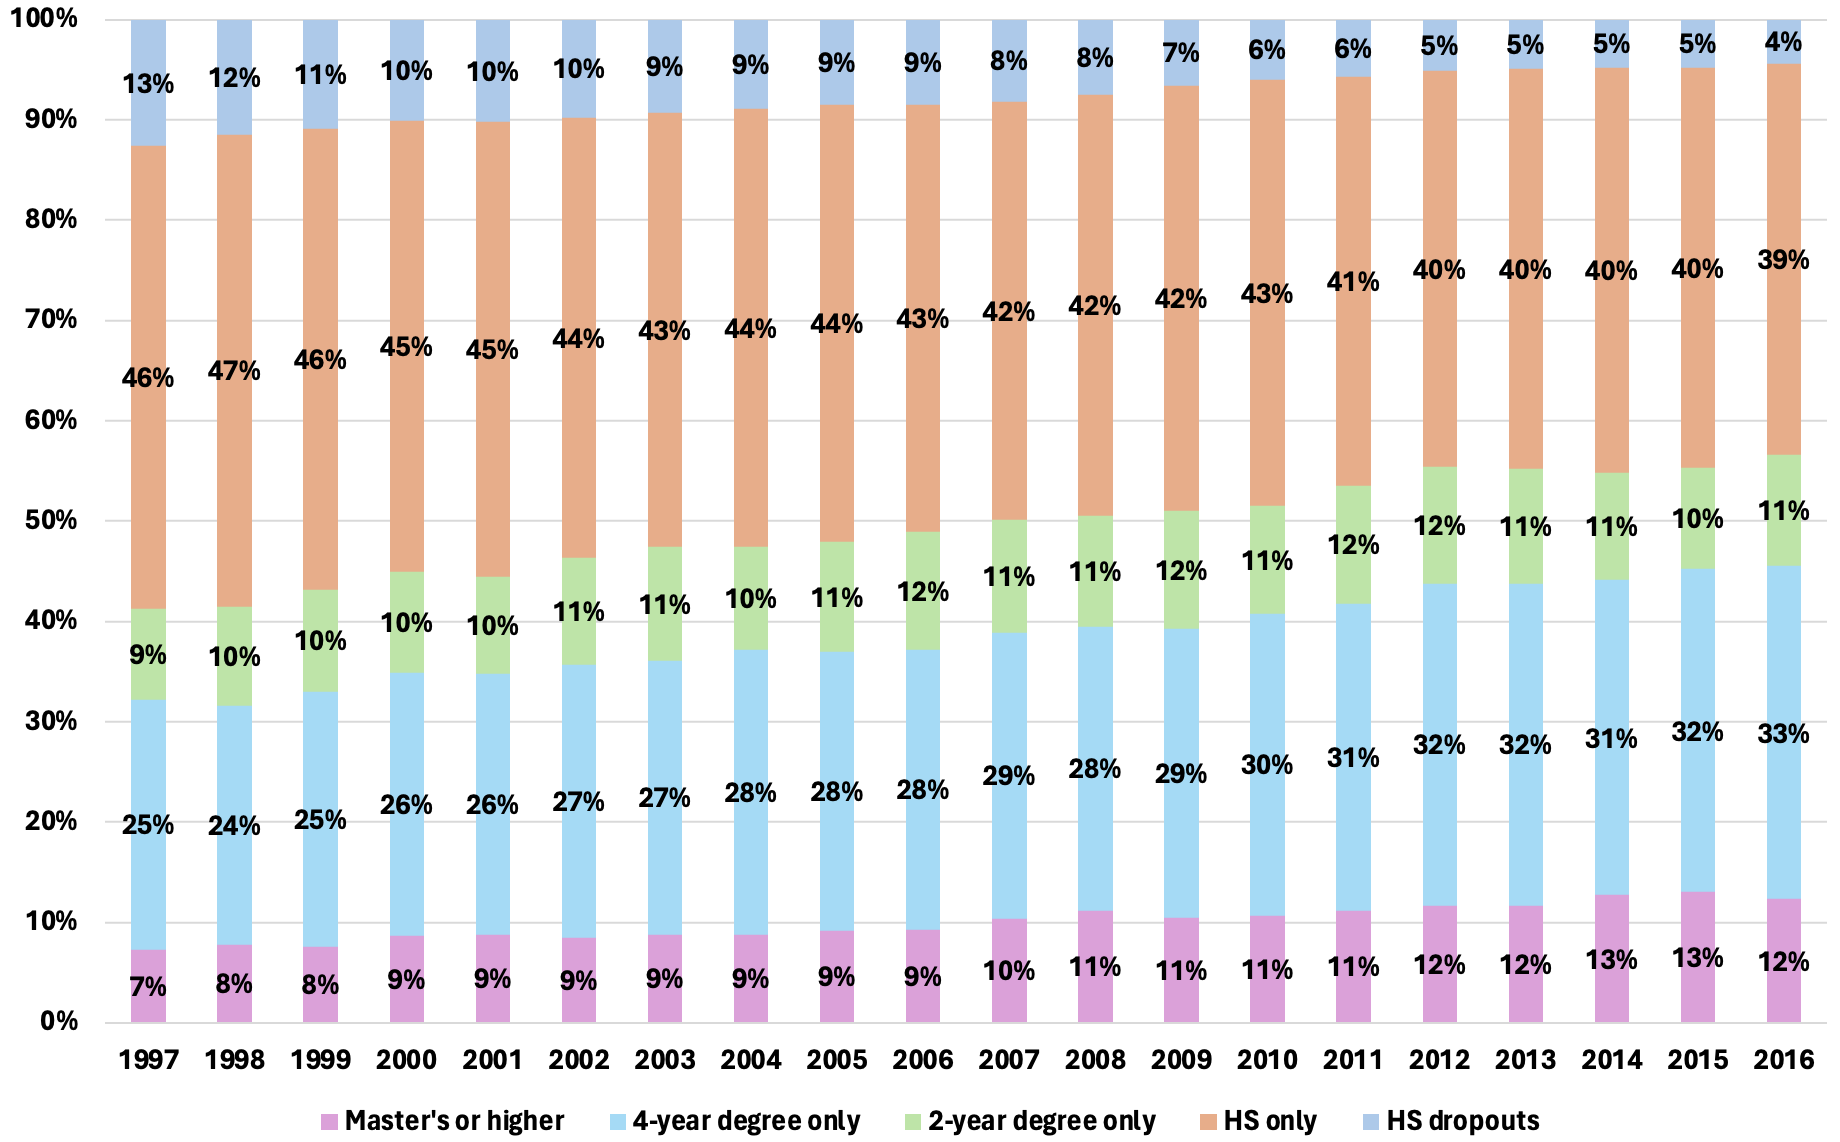
But to David I would say: It wasn’t just test scores. It was also educational attainment. The proportion of young people graduating from high school and completing two- and four-year college degrees also increased dramatically during this period. That’s true on average, but particularly for Black and Hispanic students. Let’s see what this looked like.
(Note: These data are from the Census Bureau, via NCES, and come from a survey of Americans ages 25–29 reporting their highest level of education. We display the data by high school graduating class so we incorporated an eight-year lag. [Twenty-six years old when taking the survey, more or less, minus 18 years old when graduating high school equals eight years.] The latest data are from 2024, meaning the high school graduating class of 2016.)
Figure 1. Education attainment by graduating class, all students, 1997–2016
Figure 2. Education attainment by graduating class, Asian students, 1997–2016
Figure 3. Education attainment by graduating class, Black students, 1997–2016
Figure 4. Education attainment by graduating class, Hispanic students, 1997–2016
Figure 5. Education attainment by graduating class, White students, 1997–2016
Figure 6. Education attainment by graduating class, male students, 1997–2016
Figure 7. Education attainment by graduating class, female students, 1997–2016
That’s a lot of information to absorb, so let me highlight some of the best news depicted in these figures:
The percentage of young Americans with no high school diploma dropped by more than half from the class of 1997 to the class of 2016—from 14 percent to 5 percent.
For Hispanic students, it dropped by a factor of three, from 37 percent to 12 percent.
For young men, it dropped from 15 percent to 6 percent.
The percentage of young Americans with a two-year degree or higher shot up from 37 percent (Class of 1997) to 51 percent (Class of 2016). A majority of young Americans now have a college degree of some sort.
The percentage of young Black Americans with at least a two-year degree shot up from 27 to 42 percent; for young Hispanic Americans it more than doubled, from 17 percent to 36 percent.
The percentage of young women with at least a two-year degree rose from 41 percent to a remarkable 57 percent.
There’s a debate in academe about how much these attainment gains amount to real progress versus “degree inflation.” I’ve certainly been skeptical of some increases in the high school graduation rate, given all the games we’ve seen at the state and local levels, such as the adoption of dubious credit recovery programs, widespread grade inflation, and the elimination of end-of-course and exit exams like MCAS. It’s arguably never been easier to graduate from high school in America than it is today.
But that doesn’t mean all of these improvements in the graduation rate are fake. Doug Harris at Tulane University dug into this a few years ago and concluded that most of the progress was real. It helps that student achievement and attainment were moving in the same direction.
Education reform shouldn’t get all the credit for this remarkable progress in achievement and attainment. As I wrote back in 2019—and Brooks wrote last week—schools enjoyed strong tailwinds back then thanks to a booming economy, sharply declining child poverty rates, and big increases in spending. All of that mattered, too.
It’s also worth noting that college-going has declined significantly in the last few years—partly because of the pandemic and partly because of rising doubts about the value of college. We will surely see that translate into flatlining or even decreasing college attainment rates soon.
But here’s the bottom line: Our young people made huge gains from the mid-1990s to the mid-2010s, when education reform was at its zenith. We need to celebrate that success more often. Most importantly, we need to get back to making that kind of progress again.
Author’s note: Special thanks to Fordham Institute research intern Jill Hoppe for her help with the data collection and analysis for this post.
The new federal tax-credit scholarship is being hailed as a breakthrough for school choice: more options, more opportunity, more innovation. But history offers a warning. Even though these tax-credit funds never technically enter federal coffers, once Washington confers a benefit, its influence tends to follow. Over time, reporting requirements and red tape accumulate, reshaping how private schools operate and subtly nudging them to look and act more like the public institutions they were meant to stand apart from. Look no further than higher education, where decades of federal diktats—particularly around Title IX and gender identity—have tied colleges in bureaucraticknots, creating a system the Trump administration felt it had no choice but to try and blow up. Could a small Catholic or classical school face the same constraints in the coming decades, compromising the independence that makes these schools unique?
Charter schools offer a clear, closer-to-home example. I’ve visited hundreds of classrooms across the country and would be hard pressed to guess which were in charter schools and which were in district-operated schools without knowing beforehand. Curricula, professional development, pedagogy, and even classroom routines often converge, not because educators want to copy each other, but because incentives and ideology nudge them toward the same practices. This is why, for instance, charters and magnets are often confused and explainers are written to spell out distinctions that have become increasingly academic rather than real.
This phenomenon has a wonky name in organizational theory: institutional isomorphism. It describes how institutions—even those founded to be distinct—gradually start to resemble one another under common external pressures. Political pundit Jonah Goldberg recently illustrated the concept using familiar examples:
Fast food chains that once had a very specific niche now routinely expand their offerings to capture market share out of their lane. These days you can get espresso with your breakfast wrap from Dunkin’ and get doughnuts from Starbucks. The History Channel, A&E, and MTV once had very specific programming, now they all peddle reality shows and generic entertainment.
The system steers them toward the same offerings, regardless of their original brand identity. Whether that sameness stems from regulatory pressure, professional groupthink, or the public’s appetite for predictable experiences, the effect is the same: distinctiveness gives way to conformity.
The same could happen with Uncle Sam’s tax-credit scholarship. Gallons of digital ink have already been spilled on what the feds need to do vis-à-vis the forthcoming regulations from the Department of the Treasury, along with sanguine predictions about blue and red governors alike not being able to resist the allure of “free” federal money. But it’s worth remembering that the calculus is never fixed: Future administrations could alter the tax credit in ways with potentially profound effects.
Indeed, if Trump’s federal school choice regulations are good for the goose, AOC’s will be even better for the gander. The next time Democrats are at the switch, they could try and add requirements to scholarship granting organizations (SGOs) or, what’s more likely, they could allow states to add their own requirements. From non-discrimination rules and teacher certification mandates to detailed curricular standards and compliance audits, each additional layer of regulation exerts subtle pressure for schools to adopt the same administrative and instructional practices. Even measures reformers often prescribe, like standardized testing or financial transparency, could gradually guide schools toward uniformity, diluting the very distinctiveness that private choice was meant to protect.
These aren’t abstract concerns. Consider the downstream effects of technocratic strictures requiring all participating schools to accept special education students—and for issue-oriented watchdogs to follow with reports cataloguing their failings. Individualized Education Programs are often complex and bureaucratic, specifying services and accommodations that may not always align with student outcomes. Or imagine guidance—such as those derived from restorative justice—that could limit a school’s ability to enforce discipline according to its own standards. Over time, the stakes for receiving federal benefits could push school leaders to adjust their practices less out of pedagogical preference and more out of necessity, rewiring the incentives that define how these schools operate.
Even before the regulations are finalized, the effects could be far-reaching. Federal involvement, even when well-intentioned, has a way of standardizing institutions—making them more alike than different. Nor is it likely to go away. As Milton Friedman famously quipped, “Nothing is so permanent as a temporary government program.”
Proponents may be touting the new federal windfall as a fast lane for private school choice, especially in blue states, but early indications suggest Democratic governors are already hitting the brakes. In an era of negative polarization, there’s little to incentivize either party to move an inch toward the other. And knowing that Trump will eventually exit stage right, the real question is whether participating schools can navigate the inevitable swings of federal policy that come with our fractious politics—and how much of their distinctive character will be pulled, piece by piece, toward the same routines, rules, and structures that define the broader system.
Mark Twain famously said that there are three kinds of falsehoods: “lies, damned lies, and statistics.” We need to add a fourth to that list: state-issued report cards on schools. Drafted with good intentions, these accountability measures have been redrafted into glorified district propaganda and are in need of not just reformation, but a complete restructuring.
In my hometown of Milwaukee, for instance, Jackson Elementary received three out of five stars from the state for the 2023–2024 school year, earning the designation “Meets Expectations”—all well and good. But at this three-star school, only 5.7 percent of their students can read and only 4.3 percent can perform math at grade level. In fact, 22 Milwaukee elementary schools have a “Meets Expectations” rating, even though fewer than a quarter of their students are proficient in reading and math.
Similar discrepancies exist in so-called “high-achieving” schools, too. Craig Montessori School received a rating of “Exceeds Expectations,” but its reading and math proficiency rates are 20 and 12.9 percent, respectively. Only seven out of the 19 schools that “exceed expectations” in Milwaukee have a proficiency rate over 40 percent. That means a high-achieving school, according to the state, is a school where the majority of students are behind grade-level.
Let’s be blunt: Such report cards are tantamount to lies. Most parents don’t parse through the state analytics and value-added growth models to discern the quality of their child’s school. They hear the principal tout their school’s four-star rating or see a banner over the classroom door reading “Exceeds Expectations” and trust they’re getting an honest account of what’s happening inside. It’s not just a technical issue of scoring rubrics but a breach of public trust that stymies our ability to address real issues in our schools.
While school report cards were a hot topic in 2015, when the Every Student Succeeds Act required states to craft them, they have since become an ancillary issue—overshadowed by Covid closures, culture debates over critical race theory and gender theory, and the popularity of education savings accounts. That is until Mike Petrilli resurfaced the debate in his newsletter, which spilled into a spirited debate on X.
Mike is right to raise the issue. While No Child Left Behind is every one’s favorite piñata to thwack, there’s a small but not insignificant body of evidence suggesting that, over the decade and a half after NCLB, states with stronger accountability measures saw greater achievement growth. Standards, accountability, and testing do indeed work. Moreover, even as school choice becomes the modus operandi for school funding in many states, any market requires sufficient information to function. School choosers (parents) need to know something about what it is that they are choosing.
The crux of the debate centers on whether states should prioritize growth or achievement. Achievement alone is a poor measure of school quality, since a student’s background so heavily impacts their academic achievement. But regardless of a student’s background or the cause of their lagging scores, it’s duplicitous to label the schools from Milwaukee as “exceeding expectations” when they do no such thing.
Many states have opted to mix the two into a single score, which muddles the information. Craft a convoluted sliding scale and throw in other factors—such as graduation and attendance rates, which are easy to game—as Wisconsin does, and you get a school with a near-zero achievement rate that can boast a “Meets Expectations” moniker.
What if instead of toggling around the edges of the scoring systems, we restructured it all together?
There are now numerous private organizations such as Great Schools and Niche that provide assessments of schools akin to the report card system. When I was looking for teaching jobs, I relied on these websites to provide me a sense of the school, knowing that report cards in my state had become a “trophy for everyone” kind of affair. Niche and Great Schools provide a far harsher and more realistic assessment than the state ever could or would. The incentives for painting a rosy picture, for policymakers and administrators alike, will always pull towards leniency, whereas private organizations need to provide an accurate picture for users to return and trust them.
The state still plays a role. They have access to scores of data which would be helpful for the public to have. State agencies could forgo the overall ranking—leave that to the private companies, which will do it more honestly—to instead make state report cards a simple dashboard of data about achievement, growth, absenteeism, and graduation rates. Growth scores are harder to manage in this system, as it requires student-level data that cannot be posted, but schools could make public the percentage of students that showed less than, at least, or well over grade-level growth per year.
This change would also help the carrot and stick accountability aspects of standards-based reform. Instead of mandating state intervention if a school drops to an “F” or “Fails to Meet Expectations”—a ranking which few schools ever receive, however deserving—policymakers should base the trigger for these interventions solely on data, which are harder to fudge.
It is certainly still possible to jigger growth and achievement cutoff scores, making it easier for a student to reach “proficient,” but that exists in the current system anyways. Posting raw data, instead of working them into a final grade, reduces the opportunities for massaging the final information into an overly optimistic picture.
If state legislators don’t improve the report cards, an increased reliance on alternative raters may be the natural result either way.
To improve schools, policymakers, researchers, parents, and the community more broadly need honest information. What’s working? Who’s succeeding? What’s failing? To answer these questions, we need clear communication and honest data. State report cards themselves fail these tests, and it’s time for intervention.
SOR legislation spans a range of topics that vary from state to state. For this study, the researchers focused on three policy areas: curriculum and instructional materials, preservice training, and professional learning. Drawing on a nationally representative K–5 teacher survey from spring 2024 (N=1,880), Shapiro and Bellows explored questions about the number of K–2 teachers who use curricula aligned to SOR’s foundational reading standards, strategies teachers use to help students read unfamiliar words, and the pre- and in-service training that teachers receive on foundational reading skills.
Researchers used EdReports’ English language arts (ELA) reviews to create a list of SOR-aligned materials. The survey asked teachers to indicate which of these they used and how often they used them. In response, a majority of K–2 teachers reported using at least one ELA material (such as a textbook, online material, or curriculum) that meets expectations for each of the five SOR-backed foundational reading skills (phonemic awareness, phonics, fluency, vocabulary, and comprehension). However, teachers also reported regularly using materials that do not meet standards, and fewer than one-third relied exclusively on high-quality options. Perhaps most notably, teachers’ use of aligned items did not differ based on whether their state had a SOR law with an approved list of resources.
Although reading laws did not have a significant impact on curriculum and materials, teachers in states with policies related to SOR professional learning were more likely to report using methods aligned with foundational reading skills. For example, of K–2 teachers who received training, 69 percent indicated that helping a student decode a word would be their primary strategy, while only 4 percent said they would suggest using context clues first. Overall, teachers whose training emphasized phonics were more likely to feel prepared to teach SOR-aligned foundational reading skills. In fact, three-quarters of teachers reported that their professional learning helped prepare them to teach these skills.
Another encouraging finding was that many teachers are indeed participating in SOR-related professional learning. The study found that nearly three-quarters of K–2 teachers and two-thirds of teachers in grades 3–5 received professional learning on aligned practices. Among all elementary teachers, more than 90 percent took preservice courses on teaching the five foundational reading skills. Interestingly, however, only 47 percent identified preservice training as their primary knowledge source. Instead, they reported relying primarily on in-service professional learning and classroom experience for knowledge on teaching SOR skills.
These findings offer important insight into what is happening at the classroom level, as well as the components of SOR legislation that are most likely to drive changes in teacher behavior. Perhaps most interestingly, the findings reveal that teacher training is likely a stronger mechanism for influencing teaching methods than curriculum. While professional development is often a costly investment for states and districts, the dollars spent there may very well be worth it—at least when it comes to effective reading instruction.
Still, the findings leave readers with unanswered questions. For instance, the study concluded that teachers in states with SOR legislation are not consistently more likely to use SOR-aligned practices. This could be because of the sequences of laws and policies (e.g., several specific SOR policies implemented simultaneously might be more impactful), the resources allocated to implementation, or the overall political messaging and push behind the reforms. More research is therefore needed on how to help these laws live up to their potential.
Ohio’s high school graduation requirements have long been subject to intense policy debate. Some argue that standards should align to the expectations of colleges and employers, while others argue for more relaxed standards that make diplomas easier to attain.
This report examines Ohio’s current requirements as well as recent trends in high school graduation and student achievement. It uncovers large discrepancies in graduation and proficiency rates, indicating that many students leave high school without a strong academic preparation. The report concludes by calling on state leaders to ensure that all students graduate well-prepared for their next steps.
Read the report below, or click here to download the full report.
Acronyms and definitions
Ohio Department of Education and Workforce (DEW) is the state agency responsible for overseeing the implementation of K–12 education policies.
An industry-recognized credential (IRC) is a credential or certificate signifying that an individual has acquired certain technical skills. As of August 2025, DEW had approved 693 IRCs that can be used to meet career-tech-based graduation options. Each credential is assigned a point value, ranging from one to twelve, and students must accumulate credentials worth at least twelve points to meet certain graduation requirements.[1]
End-of-course exams (EOCs) are state assessments administered when students complete specific courses. Ohio currently administers five high school EOCs in Algebra I, Geometry, English II, Biology, U.S. History, and U.S. Government. Students must pass the Algebra I and English II exams to graduate, though alternatives are provided for students who fall short of the state’s passing score.
This report focuses on the four-year graduation rate—i.e., the percentage of students in a cohort who graduate “on-time,” or within four years of entering ninth grade for the first time.
The Ohio Graduation Tests (OGTs) were the state’s previous set of high school exams, given prior to introduction of the EOCs in 2014–15. Students in the classes of 2007 to 2017 were required to pass the OGTs to graduate.
Executive summary
High school diplomas—and the graduation rates based on their receipt—have long been held as markers of educational attainment and success. In 2024, Columbus superintendent Angela Chapman touted the district’s 83 percent graduation rate as being “stronger than ever before.” Cleveland school leaders have routinelytrumpeted the district’s soaring graduation rate. In Akron, a city councilman recently defended the district superintendent, writing “What you cannot deny is the district’s 88.1 percent graduation rate.”
There is no denying these record-breaking numbers. But do they actually signify that a vast majority of students exit high school ready for success? Or do they simply reflect a low bar—getting ever lower—that underlies today’s diplomas?
This report argues that mediocre standards, not widespread academic success, are behind swelling graduation rates in the Buckeye State. The first section discusses Ohio’s current graduation requirements, and the recent policy debates and shifts that helped shape them. The next section documents just how out-of-sync graduation rates have become with student proficiency on state exams given to high schoolers. Finally, the report examines two factors that explain the large discrepancy between graduation and proficiency rates: (1) the low score needed to “pass” the state’s Algebra I and English II exams, the two key tests that factor into graduation requirement, and which are usually taken in eighth to tenth grade; and (2) the presence of a lower-level career-tech alternative route for students who struggle on these exams.
Here are the key findings.
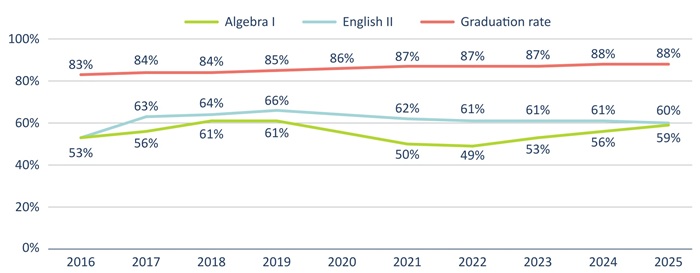
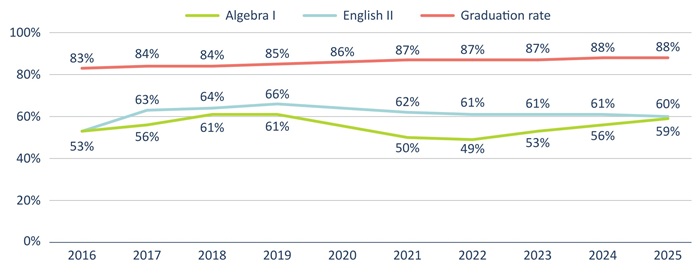
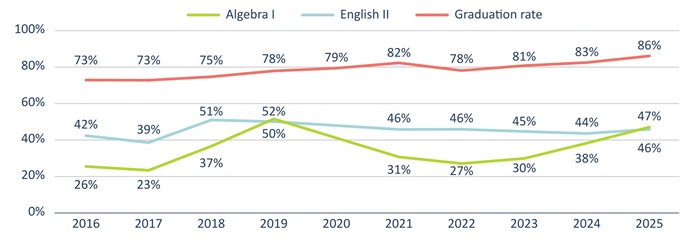
1. Statewide graduation rates continue to increase, and currently exceed state proficiency rates on Algebra I and English II exams by more than 25 percentage points. The figure below demonstrates the steady rise in Ohio’s four-year graduation rate from 83 percent in 2015–16 to 88 percent in 2024–25. That rise has occurred even as high school proficiency rates fell sharply during the pandemic, and remain below the pre-pandemic marks posted in 2018–19. The diverging trends—increasing graduation rates versus slumping proficiency rates—result in a noticeable disparity between the two measures. In 2024–25, Ohio’s graduation rate stood 29 and 28 percentage points above the Algebra I and English II proficiency rates, respectively. This large discrepancy suggests that thousands of Ohio students receive diplomas despite lacking the solid math and reading skills that are essential to college and career success.
Figure ES-1. Statewide graduation versus high-school proficiency rates
Notes: Graduation rates are reported on a one-year lag; e.g., 2024–25 (2025) report cards reflect the class of 2024 graduation rate. Proficiency rates reflect students taking the tests for the first time that year—generally, eighth to tenth graders—not the cohort represented in the year’s graduation rate. No exam data are displayed for 2020, as tests were cancelled due to Covid; 2016 was the first year the state administered the Algebra I and English II exams.
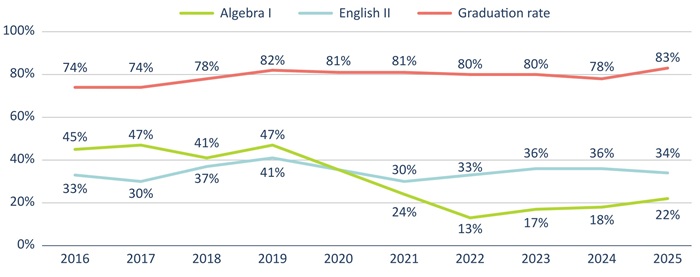
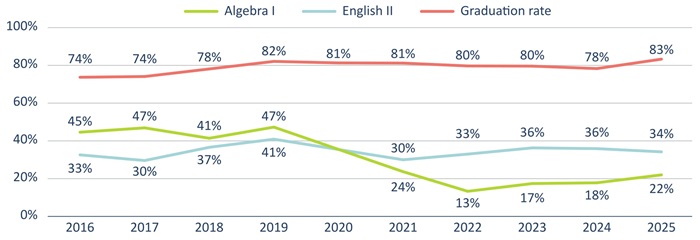
2. The graduation-proficiency gap reaches 40 to 60 percentage points in large urban districts. All but one of the Ohio Eight districts[2] report graduation rates above 70 percent, despite just a quarter to half of their students scoring proficient on high school exams. Columbus City Schools, for example, posts an 83 percent graduation rate, even though just 34 percent of students score proficient in English II and 22 percent achieve that mark in Algebra I. Tables 2and 3 in the report show similarly large disparities in graduation and proficiency rates in the other Ohio Eight districts, as well as other districts across the state.
Figure ES-2. Graduation versus high school proficiency rates, Columbus City Schools
3. The graduation-proficiency gap can be explained by a low “competency” score needed to meet exam-based requirements, along with the introduction of a weaker career-technical alternative. To graduate, Ohio requires students to achieve a state-defined “competency” score on the Algebra I and English II exam, or to meet an alternative requirement. The competency benchmark is set significantly below the “proficient” standard, and is well beneath a true “college-ready” target (see below for details). A low passing score allows many students to meet graduation requirements even though they have not demonstrated proficiency in high school level English and math.
For students failing to reach the competency bar after a mandatory test retake, the state offers a “career experience and technical skill” pathway. This requires students to acquire industry credentials, pass career-technical course assessments, or meet one of several other measures. Data from school districts with low achievement data suggest that substantial numbers of students now graduate with the help of this less-demanding option (see Table 6 below). In Youngstown, for example, 85 percent of students graduate on-time, despite an Algebra I proficiency rate of just 27 percent. Yet we also discover that 59 percent of the district’s most recent graduating class earned industry credentials during high school—more than twice the state average—and 45 percent passed career-tech assessments, almost double the state average. These numbers suggest that a sizeable number of Youngstown students graduated by virtue of the career-tech alternative.
Permitting students to graduate via career-tech pathways might make sense if those pathways effectively prepare them for careers. But a closer look at the credentials earned reveals troubling patterns. In Akron, students have collected large numbers of retail certificates, while in Columbus and Youngstown, students have racked up credentials in national emergency management. These certificates might have value to students with strong academic skills or to professionals already working in the field, but they are unlikely to open rewarding opportunities for students who have not even demonstrated basic competency in math and English. Unfortunately, what is more likely happening is that schools have discovered ways to work around the academic requirements by funneling students into lower-level career-tech programs just to get them a diploma.[3]
***
Ohio policymakers have consistently talked a good talk about readying students for college and career. But they haven’t always walked the walk. Graduation standards have slid, and diplomas are quickly becoming participation trophies rather than well-earned prizes that signify students’ readiness for post-high-school success.
To state leaders, we ask this: Please strengthen graduation requirements to require “competency”—if not “proficiency”—in Algebra I and English II (at least) as an unwavering condition of earning a diploma. No matter their aspirations, every student must exit high school with solid reading, writing, and math skills. We also know that, with hard work, determination, and the right support, every Ohio student has what it takes to achieve that baseline standard. Rather than giving away counterfeit diplomas that lead nowhere, let’s hold the line on academics and see where a next generation of well-prepared young people take our state.
Ohio’s graduation requirements: Past and present
The value of a high school diploma has long been debated. More than forty years ago, UCLA professor James Popham argued that “U.S. citizens believe that a high school diploma means little today,” and went on to propose minimum competency tests that would “restore meaning to the high school diploma.”[4] About the same time, A Nation at Risk noted that, in many high schools, learning to cook or drive had as much bearing on graduation as math and English. That landmark report proposed minimum course requirements in the academic subjects, and also recommended use of standardized exams that would “certify the student’s credentials.”[5]
To address concerns about graduation standards, states began to implement both course requirements and exit exams during the 1980s and 1990s.[6] Here in Ohio, lawmakers instituted a ninth-grade competency test that required students starting in the class of 1994 to pass its reading, writing, math, and citizenship sections.[7] Yet the earliest competency exams—in Ohio and elsewhere—were criticized as low-level and not aligned to the expectations of colleges and employers.[8] In an effort to raise the bar, Ohio transitioned to the Ohio Graduation Test. Under that system, students, starting with the class of 2007, were required to achieve proficiency on five statewide tests (reading, writing, math, science, and social studies). But with passage rates ranging between 80 and 90 percent by 2011,[9] and with many considering the tests to be roughly eighth-grade level, policymakers sought to increase the rigor yet again.[10]
In a package of reforms passed in 2014, Ohio introduced a next generation of high school graduation standards and assessments.[11] Students in the class of 2018 and beyond were required to achieve a state benchmark on seven end-of-course exams (EOCs) in Algebra I, Geometry, English I and II, U.S. History, U.S. Government, and Biology. The exam-based pathway was envisioned as the route that most students would take to graduation, although lawmakers added two alternate routes to the diploma: (1) Earn a remediation-free ACT/SAT score, or (2) attain industry credentials and pass WorkKeys, a workforce development exam.
The new diploma requirements set off a raucous debate, with education groups complaining that this time lawmakers had set the bar too high—the EOCs were tougher than the softball OGTs—and warning of a “graduation apocalypse.”[12] Amid prolonged debate, the legislature approved stop-gap measures for the classes of 2018 through 2020 that allowed students, in lieu of passing EOCs, to graduate based on extremely weak options such as satisfactory attendance, an acceptable grade point average, or completing an ill-defined “capstone” project.[13][14] Some advocates pushed to make these weak alternatives permanent, but lawmakers declined and settled on “long-term” requirements that were supported by Fordham and others.
Starting with the class of 2023, these requirements aim to preserve an objective, exam-based component but also make significant modifications that softened requirements relative to the original system enacted in 2014. These include a reduced number of exams that factor into graduation: The state’s Geometry, Biology, U.S. History, and U.S. Government EOCs no longer play a serious role in meeting graduation requirements, and the English I exam was simply scrapped. Moreover, the state also relaxed the career-tech alternative by removing the WorkKeys testing requirement and adding several other options.[15] Under current requirements, students must do all of the following to graduate:
Complete course requirements: Following long-standing policy, earn at least twenty credits, with a certain number of credits in specific subjects (e.g., four each in math and English).[16]
Earn two diploma “seals”: Earn at least two seals out of twelve possible options. Due to the relative ease of attaining several of the seals, this requirement is not very challenging. Appendix A lists the seals and includes a brief description of each.
Demonstrate competency: Meet either the exam-based academic pathway or complete one of four alternatives.
Ohio’s achievement levels and what they signify
Ohio categorizes state exam scores into five achievement levels. Students’ knowledge and skills at each level is described in the following way:
Advanced: Distinguished command of Ohio’s standards…sophisticated ability to demonstrate reasoning with numbers…
To meet the main academic pathway, the one based on exams, students must achieve a “competency” score of 684 or above on the state’s Algebra I and English II EOCs, which are usually taken in eighth to tenth grade. It’s important to understand that this score is beneath the “proficient” cut score of 700, and it falls substantially below the “college- and career-ready” benchmark of 725. While the decision to set the graduation mark below a bona fide college-and-career ready score is sensible—that is a truly ambitious target for most students—the move below proficient represents another form of softening. Today, all students need to do is score in the “basic” range, which indicates only “partial command” of state standards and, as studies indicate, diminishes their likelihood of attending and succeeding in college.[17]
Figure 1. Algebra I scaled scores and corresponding achievement benchmarks
Source:Ohio Department of Education and Workforce. Note:The state considers scoring at or above “accomplished” as being on-track for college and career. The cut points for the English II are similar (though not exactly the same) as Algebra I; Appendix B displays the score ranges for English II.
The state provides four alternative pathways for students who fall short of the competency standard on their first try and again on a mandatory retake. Three are reasonable options, as they are more closely tied to an objective measure of achievement. They include: (1) achieving a remediation-free ACT/SAT score,[18] (2) completing a dual enrollment course in the failed subject area,[19] or (3) enlisting in the military.[20]
A fourth alternative—a career-tech-oriented route—requires students to meet two of seven requirements, at least one of which must be a “foundational” option:
Foundational options: (1) earn a cumulative score of proficient on at least three technical assessments (known as WebXams); (2) earn at least twelve points in the state’s industry credentialing system;[21] (3) complete a pre-apprenticeship or apprenticeship program; or (4) obtain a state-issued professional license.
Supporting options: (1) complete at least 250 hours of a work-based learning experience; (2) pass the WorkKeys exam; or (3) attain the OhioMeansJobs readiness seal.
Creating a career-technical pathway makes sense, provided that fulfilling it actually signifies career readiness and serves as an acceptable substitute for academic proficiency. These questions hinge on the rigor of the underlying measures. Unlike state assessments and well-known college admissions and military enlistment exams, little information is available about the content and rigor of the WebXam technical assessments.[22] Moreover, as discussed below, some of the industry credentials that students can earn are of dubious rigor and value. By allowing for expansive yet questionable career-tech alternatives, state lawmakers may have also inadvertently lowered the bar for graduation.
Through the years, Ohio has struggled to maintain strict standards for graduation. Current requirements are no different. The “competency” standard is a relatively soft benchmark for academic performance, and the career-technical workaround leaves open the possibility that students graduate with neither the academic nor technical skills needed for success after high school. But how have these changes impacted graduation rates? How do these rates compare with trends in student proficiency? The next section dives into the data.
Soaring graduation rates, stagnant proficiency
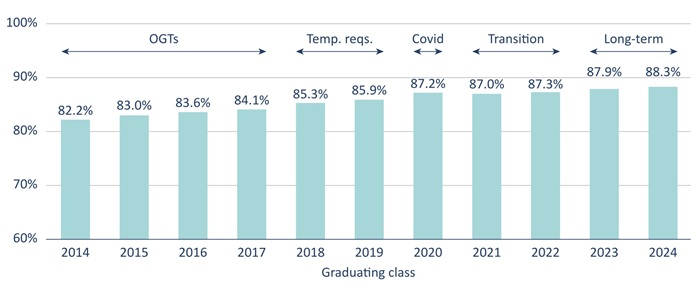
Historically, most Ohio students have graduated “on-time,” i.e. within four years of entering ninth grade. In recent years, however, graduation rates have climbed to unprecedented levels. As the chart below indicates, 82 to 84 percent of students graduated on-time during the last years of the OGT-driven standard. In the post-OGT era, rates rose higher still, topping 85 percent for the first time for the classes of 2018 and 2019, which were the cohorts that graduated under eased temporary requirements. Just over 87 percent of students in the Covid-impacted class of 2020 graduated on-time, and rates continued to climb to a remarkable 88 percent for the classes of 2023 and 2024, the first cohorts subject to the state’s current requirements.
Figure 2. Statewide four-year graduation rates, classes of 2014 to 2024
Source: Ohio Department of Education and Workforce. Note: For more on the graduation requirements applicable to each cohort, see the section above.
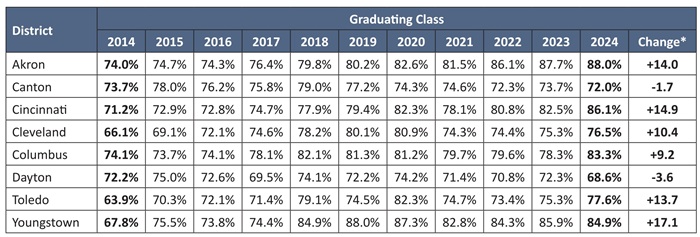
Graduation rates have marched upward not only statewide but also in most of Ohio’s large urban districts. As Table 1 indicates, graduation rates in the Ohio Eight ranged from 64 to 74 percent for the class of 2014. Since then, they’ve risen substantially in six of the eight districts, ranging from 69 percent in Dayton to 88 percent in Akron for the class of 2024.
Table 1. Four-year graduation rates in the Ohio Eight school districts, classes of 2014 to 2024
Note: (*) The “change” column is the percentage-point change in graduation rates from the class of 2014 to 2024.
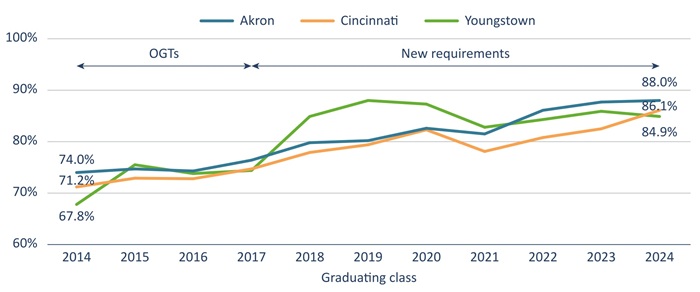
Figure 3 depicts the increases in Akron, Cincinnati, and Youngstown, all of which have posted double-digit gains in graduation rates over the past decade. The increases accelerated starting with the class of 2018—especially apparent in Youngstown—which coincided with the transition from the OGTs to new graduation requirements.
Figure 3. Four-year graduation rates in selected urban districts, classes of 2014 to 2023
Lofty graduation rates would be worthy of praise if they denoted true gains, which we can gauge by comparing those rates with student proficiency—a key measure of preparedness for life after high school, as it predicts performance on college-admissions exams and college-going rates.[23] Employers, too, routinely say that they seek individuals with strong analytical and communication skills, which proficiency in math, reading, and writing underpin.[24]
But here, we see that proficiency on state high school exams continues to lag far behind graduation rates. Figure 4 shows that Algebra I proficiency fell sharply during the pandemic—even as graduation rates continued to rise—though scores have recovered since 2021–22. English II proficiency rates likewise slid during the pandemic and remain virtually unchanged since then. The chart also shows a large disparity in graduation and proficiency rates—a gap of more than 25 percentage points in 2025. Reflecting the diverging trends in graduation and proficiency rates, the gap is wider today than it was in 2018–19.
Figure 4. Statewide graduation versus Algebra I and English II proficiency rates
Note: For information about the students represented in these data, see Figure ES-1 above.
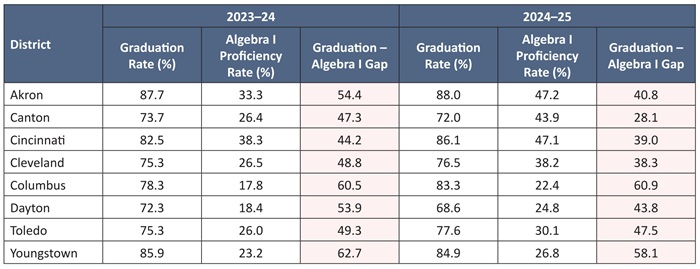
Larger disparities emerge in the large urban districts. As Table 2 indicates, Algebra I proficiency rates in the Ohio Eight range from 22 to 47 percent, yet all but one of these districts register graduation rates above 70 percent. This results in graduation-proficiency gaps ranging from 28 percentage points in Canton to 61 points in Columbus. The table shows that these large differences are not a one-year phenomenon, as they were clearly evident in 2023–24 as well.
Table 2. Graduation versus Algebra I proficiency for the Ohio Eight districts, 2023–24 and 2024–25
Note: The English II proficiency and graduation rate differences for the Ohio Eight appear in Appendix C.
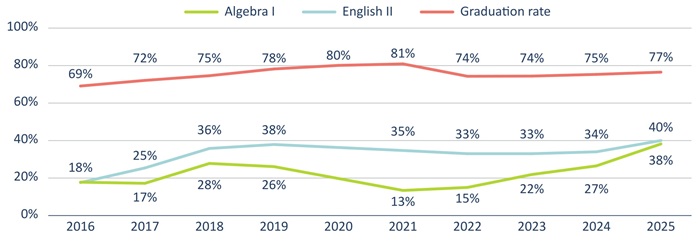
Figure 5 provides a longer-term view of the graduation-proficiency gaps in the three largest Ohio Eight districts. While graduation rates in Cincinnati, Cleveland, and Columbus have consistently topped 70 and 80 percent over the past decade, proficiency rates on the Algebra I and English II exams fall well below those marks.
Figure 5. Graduation versus Algebra I and English II proficiency rates, selected Ohio Eight districts
Cincinnati
Cleveland
Columbus
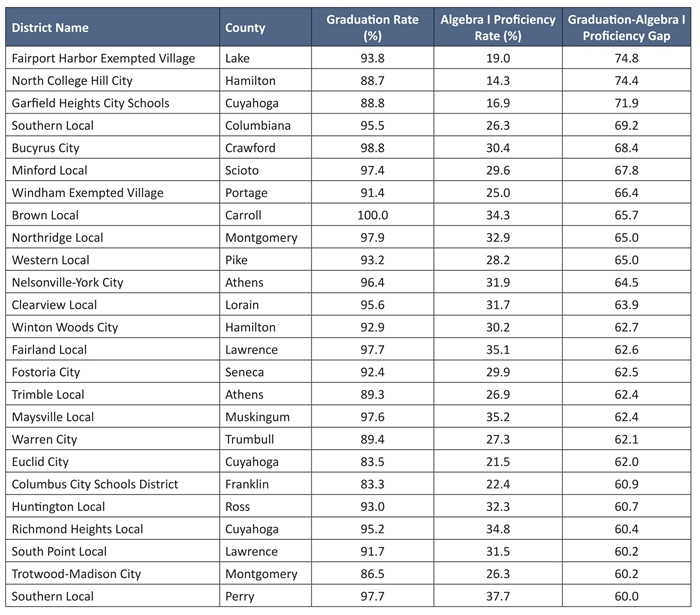
Sizeable differences in graduation and high school proficiency rates are not limited to the big-city districts. Table 3 shows the districts with the largest discrepancies based on Algebra I scores. In some of these districts, 90 to 100 percent of students graduate on-time, despite posting Algebra I proficiency rates below 40 percent, resulting in gaps exceeding 60 percentage points. A list based on the largest differences in English II proficiency and graduation rates appears in Appendix D.
Table 3. Twenty-five districts with the largest differences in graduation versus Algebra I proficiency rates, 2024–25
Overall, this section shows that thousands of Ohio students receive diplomas despite not having demonstrated high-school level proficiency on state English and math exams. The problem is especially acute in (though not limited to) urban districts where graduation rates often exceed 75 and 80 percent, even though roughly half that number achieve proficiency. The large disparity raises questions about how students are graduating—and whether they truly have the knowledge and skills needed for success after high school.
What’s going on?
How can it be that some districts graduate large majorities of students when just a quarter to half score proficient? And that statewide graduation rates have far outstripped proficiency rates? One obvious explanation is that Ohio does not align its academic requirement for graduation to its own “proficient” standard. Rather—as discussed above—it sets the bar considerably lower at “competency,” a mark that is at the very low end of the “basic” achievement level. Despite their shaky academic skills, allowing students scoring in the “basic” category to meet graduation requirements does narrow the graduation-proficiency gap. In Columbus, for instance, 53 percent of students score “basic” or above in Algebra I—more than double its 22 percent proficiency rate—which brings us closer to the district’s graduation rate of 83 percent.[25]
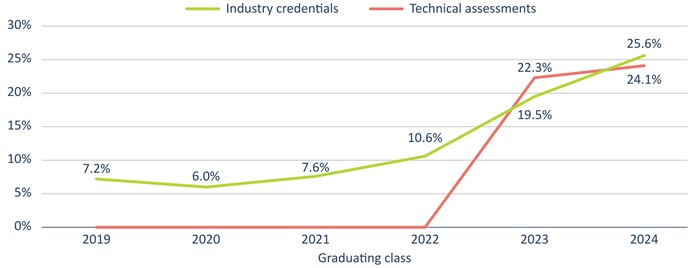
In addition to graduating students thanks to the lower-level competency mark, schools are also taking advantage of the state’s alternative pathways to graduation, most notably the career-technical option.Statewide, we see sharp increases in the number of students attaining industry credentials and passing three or more career-technical assessments, two of the key measures for this pathway. Prior to the class of 2023, roughly one in ten students earned industry credentials (technically, accumulating twelve or more points in the credentialing system). That rate almost doubled with the class of 2023, the first cohort subject to the current graduation requirements, and increased again to 26 percent for the class of 2024. While it does not appear that technical assessment data were being reported prior to 2023, almost a quarter of students in the classes of 2023 and 2024 passed three or more of those exams.
Figure 6. Statewide percentage of students earning industry credentials or passing career-technical assessments
Note: The figure displays the percentage of students in a graduating cohort (both graduates and non-graduates) who earned at least twelve points in the state’s industry credentials system or achieved a cumulative score of proficient on at least three technical assessments. Prior to the class of 2023, it does not appear that DEW reported data on technical-assessment passage rates.
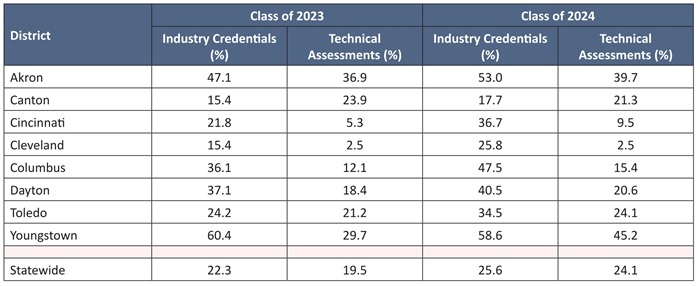
Schools with more students who struggle academically would likely be more apt to encourage use of the career-technical alternative. Indeed, in low-achieving urban districts, we find substantial proportions of students meeting two of the key measures that can be used for this alternative. Table 4 shows that more than two-fifths of the class of 2024 in Akron, Columbus, Dayton, and Youngstown earned industry credentials—rates that are much higher than the statewide average. As for technical assessments, more than one-third of students in Akron and Youngstown met that measure in the class of 2024.
Note: This table displays the percentage of students in a graduating cohort (both graduates and non-graduates) who earned at least twelve points in the state’s industry credentials system or achieved a cumulative score of proficient on at least three technical assessments.
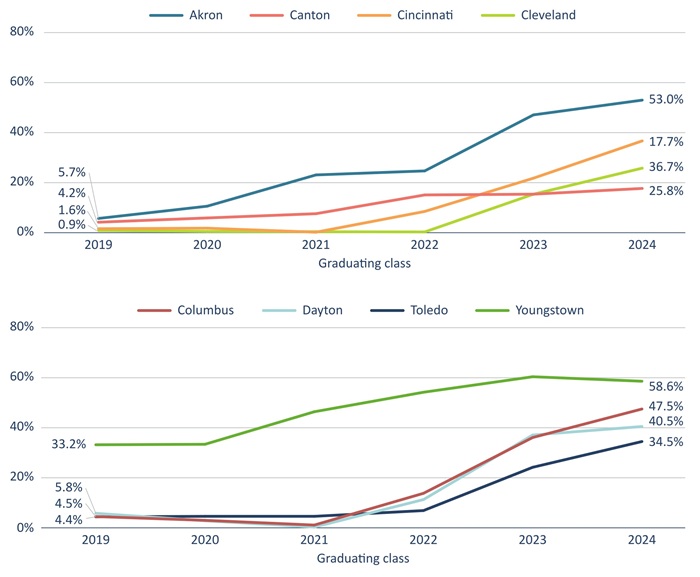
Figure 7 depicts the sharp increase in industry credential attainment across the Ohio Eight, starting with the class of 2023 in most of the districts. This jump in credentialing coincides with the transition to the current graduation requirements that provide students a career-tech pathway when they are unable to demonstrate competency in Algebra or English II.
Figure 7. Percent of graduating classes earning industry credentials, Ohio Eight districts
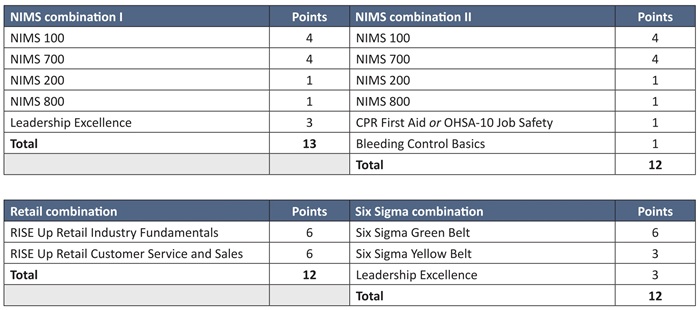
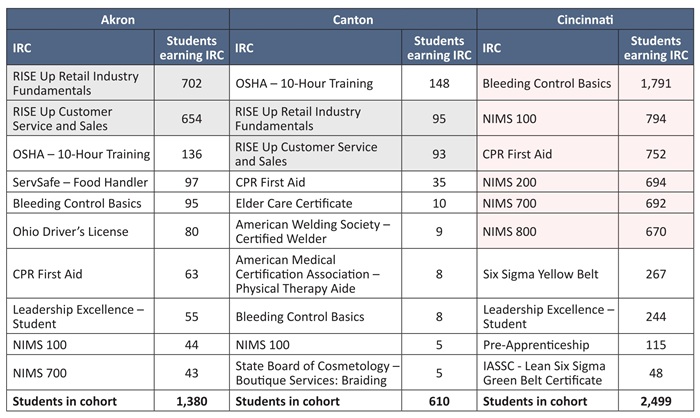
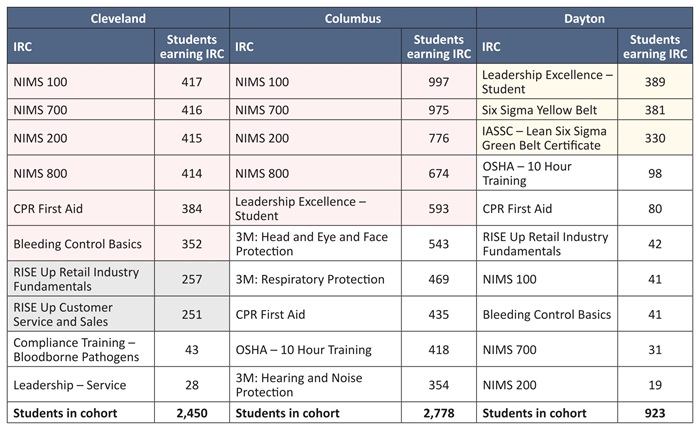
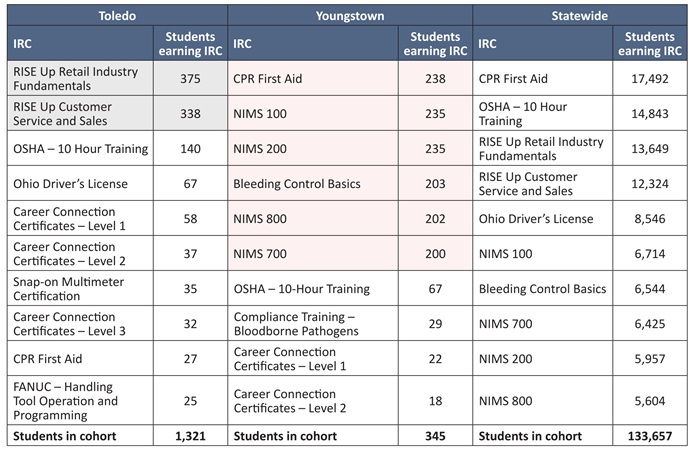
If the career-technical assessments and industry credentials were high-quality, the upward trends on these measures would be heartening. While little is known about the technical assessments—perhaps because they are relative newcomers to the state accountability system—we do know more about the credentials that students earn statewide and in the Ohio Eight. Table 6 displays the ten most frequently earned credentials for the class of 2024.[26] Several credentials rise to the top—retail certificates, national incident management certificates, and general first aid and job-safety certificates. Under Ohio’s graduation policies, students can “bundle” certain credentials to reach the twelve-point mark for graduation. Bundles that appear to be widely used are shown in Table 5 and highlighted in Table 6.
Table 5. IRC combinations that equal twelve or more graduation points
Notes: NIMS = National Incident Management System, which are training programs for people working in emergency management. OSHA = Occupational Safety and Health Administration, which has a job-safety certification program. RISE Up is a program developed by the National Retail Federation; Six Sigma refers to a business management concept; CPR and the bleeding control are basic first-aid certificates; no information is available via DEW about the “leadership excellence” certificate.
Table 6. Most commonly earned industry-recognized credentials, Ohio Eight districts and statewide, class of 2024
Note: More information about the credentials in this table is available at DEW, “Industry-Recognized Credentials by Career Field” webpage. The shadings indicate “bundles” of IRCs that equal at least twelve points (see Table 5).
A serious career-technical pathway to graduation does have merit and is worth consideration. Ohio identifies and provides extra funding for high-priority industry credentials through the Innovative Workforce Incentive Program (IWIP)—credentials that would be more useful to students after graduation. Unfortunately, the overwhelming majority of the most-commonly-earned credentials are not on the IWIP list[27] and are of questionable value, particularly for students who have not demonstrated basic academic skills. The retail certificates, for instance, may not even be necessary to obtain entry-level positions, and are unlikely to help graduates advance beyond that, especially given their inadequate math and reading skills. The national incident management certificates are equally troubling. Do large numbers of Cleveland, Columbus, and Youngstown students intend to enter emergency management? What happens if they don’t? Do these specialized certificates have any value in other occupations?
In sum, while there isn’t anything inherently wrong about collecting credentials, the price low-achieving students pay is an opportunity cost. They would have likely been better off shoring up their academic skills—something that is of more certain value across all professions—rather than spending time pursuing credentials that do little to advance their careers or may quickly become obsolete.[28] Ohio policymakers have two options to clean up this mess. One, they could get serious about making sure all students graduate with solid academic skills by eliminating the career-tech alternative. Alternatively, they could keep a career-tech option. But if so, they must significantly tighten the pathway to ensure that meaningless credentials and low-level tests don’t count toward graduation.
Conclusion
Student effort and accomplishment should underpin the high school diploma, which should reflect young people’s striving to master core academic content, persevering when the going gets tough, and demonstrating knowledge and skill on an objective measure of achievement. When diplomas are truly earned—not just handed out—they empower young people and act as a gateway to a brighter future.
Unfortunately, too many students now receive diplomas that lead nowhere. As this report documents, large proportions of Ohio students are allowed to graduate without having achieved proficiency on state math and English exams. Some will argue that giving such students a diploma is the compassionate thing to do. But what happens when that graduate can’t find employment, gets stuck in a dead-end job, or drops out of college with only debt and regret? How is that kind-hearted?
A firmer but better-for-students approach is to require competency, or better yet proficiency (which is still below a true “college- and career-ready” mark), at least in Algebra I and English II, to graduate high school. No matter the direction students choose—whether it’s higher education or employment—they all need a solid academic foundation to succeed over the long-term.
Is that too much to ask of students? Consider the algebra assessment, which is largely taken in eighth and ninth grade. Students falling short should have multiple opportunities to retake the exam—and the underlying course, if necessary—as tenth graders, or even into their junior or senior years. It shouldn’t matter when students pass the Algebra I exam, or how many times they need to take it. What matters most is that they nail down the content before they exit high school. As for English II—a tenth grade-level assessment—three in five Ohio students already achieve proficiency on their first attempt. Is it an impossibility, especially with the state’s Science of Reading initiative underway, to reach four out of five? Or higher?
How about demographics, and equity considerations? Would a strict academic standard withhold diplomas from too many disadvantaged students? There is no doubt that many Ohio students face barriers to academic success. But the answer is not double standards and a lower bar. What they need instead are education leaders willing to hold them to the same standards as their more advantaged peers, while giving them the supports to meet those standards. Some Ohio schools already demonstrate that this can be done. In Steubenville, a district that serves mainly low- to mid-income households, 94 percent of students score proficient or above in Algebra I and 72 percent do so in English II. And in Cleveland, the district’s John Hay high schools serve predominately Black or Hispanic students, and about three quarters achieve proficiency on state exams.
Ohio should build its education policies upon the unwavering belief that every student can and will excel academically. It’ll take the right set of incentives, accountability systems, and supports to reach this ambitious goal. Will state policymakers have the courage to challenge Ohio’s high school students—and their schools—to achieve more? The state’s future hinges on how they answer that question.
Acknowledgments
I wish to thank my Fordham Institute colleagues Michael J. Petrilli, Chester E. Finn, Jr., Chad L. Aldis, Jessica Poiner, and Jeff Murray for their thoughtful feedback during the drafting process. Special thanks also to Alicia Anderson, who copy edited the manuscript, and Dave Williams who created the design.
— Aaron Churchill
Ohio Research Director, Thomas B. Fordham Institute
Endnotes
[1] More information about Ohio’s industry credentialing system is available here. Per legislation passed in July 2025, DEW will overhaul the IRC points system for future graduating classes.
[2] Akron, Canton, Cincinnati, Cleveland, Columbus, Dayton, Toledo, and Youngstown.
[9] Federal policy pressured states to lowergraduation standards and (if they adopted them) implement soft exit exams, as graduation rates became a component of school accountability systems. For a summary and analysis, see Doug Harris, “Are America’s rising graduation rates real—or just an accountability-fueled mirage,” Brookings Institution (March 2, 2020).
[13] Temporary requirements for the classes of 2018 to 2020 were enacted via House Bill 49 and House Bill 491 of the 132nd General Assembly. With Covid bearing down on schools, lawmakers further softened requirements for the class of 2020 via House Bill 197 of the 133rd General Assembly.
[14] As passed in House Bill 166 of the 133rd General Assembly, the classes of 2021 and 2022 were initially required to meet transitional requirements, either meeting one of the “original” three options or the new “long-term” requirements. However, with Covid still a concern, the legislature softened those requirements by allowing students in those cohorts to substitute course grades for exam results; see, House Bill 67 of the 134th General Assembly.
[15]House Bill 166 of the 133rd General Assembly established the long-term requirements.
[16]One credit is equivalent to a year-long course of at least 120 hours. For more about the course requirements, see here.
[17] For data showing that students with higher high school state test scores tend to perform better on the ACT, see an Ohio Department of Education analysis (2019). A forthcoming Fordham report will demonstrate correlations between eighth grade and EOC test scores and actual college-going rates.
[18] For more on the college remediation-free scores, which are established by the presidents of Ohio’s public universities, see here.
[19] Eligibility for dual enrollment (a.k.a., College Credit Plus) generally requires students to achieve remediation-free scores on the ACT/SAT or have a satisfactory GPA. For more, see here. To meet this requirement, students also have to pass a college-level course.
[20] Military enlistment requires applicants to pass the Armed Services Vocational Aptitude Battery (ASVAB), which includes reading and math sections. For more, see here.
[21] The twelve-point threshold applied for the classes of 2018 to 2025. The “points” system will be restructured per recently passed provisions in House Bill 96 of the 136th General Assembly. For more about Ohio’s industry credentialing system, see here.
[22] Some information is available online at https://news.webxam.org/. However, no data were located about how many students take the assessments (and which courses they align to) or what passage rates are.
[25] Adding students who achieve competency upon a retake the next year—the “basic” and “proficient” numbers reported by the state generally reflect first-time test takers—would also narrow the achievement-graduation gap.
[26] The most commonly earned IRCs for the class of 2023 are available in a prior analysis.
[27] Of the credentials that appear in Table 6, only the welding and physical therapy certificates (Canton); the FANUC handling certificate (Toledo), and Six Sigma Greenbelt (Cincinnati and Dayton) appear on the IWIP credential list, which is available here.
Thank you to all of our participants! Read about the competition, as well as all 48 entries, below.
THIS YEAR'S PROMPT
The reading crisis in America’s schools long predates the pandemic, but in recent years it has drawn new urgency and spurred a wave of reform. In state after state, governors and legislatures have enacted “science of reading” laws intended to overhaul how children are taught to read—mandating changes in curricula, teacher training, intervention, and accountability. They’re meant to boost weak reading scores and close literacy gaps. Yet an important question remains: Will these laws live up to their potential?
Today, just one-third of American fourth graders read at or above the “proficient” level on the National Assessment of Educational Progress—the lowest rate since 2005. Before Covid, too, many classrooms relied on approaches to reading, like “three-cueing” or “balanced literacy,” that run counter to the evidence on how children learn. The pandemic worsened matters, erasing years of progress and leaving millions of students further behind. In response, more than 40 states have passed legislation designed to align instruction with the science of reading.
The laws vary in their particulars, however. Almost all invest in professional development for current educators. Most require the adoption of approved curricula, including materials and assessments, as well as tutoring or intensive interventions for struggling readers. And about half include teacher certification or licenses in science of reading instruction and/or mandate that teacher preparation programs incorporate it into their courses.
Implementation challenges abound. Districts struggle to retrain administrators and teachers who have spent careers embracing discredited methods. Teacher-preparation programs often resist change. States regularly face pushback from educators and unions overwhelmed by shifting mandates. There may or may not be serious accountability for results. And in some places, the “science of reading” has become more slogan than substance, with laws passed but not fully funded, faithfully implemented, or closely monitored.
Consequently, it’s hard to know whether all this activity will yield significant and lasting improvements in literacy achievement. That’s why this year’s Wonkathon asks: What needs to happen next—at the state, district, and school levels—for the science of reading revolution to fulfill its promise and ensure that far more children learn to read well?
WHAT’S A WONKATHON?
For eleven years now, we at the Thomas B. Fordham Institute have hosted an annual Wonkathon on our Flypaper blog to generate substantive conversation around key issues in education reform. Last year’s forum focused how policymakers and practitioners can reduce chronic absenteeism.
Schools have a responsibilityto educate students about what it means to be an American. Students should exit high school with an appreciation for our nation’s values, among which include freedom, liberty, and justice for all—and the knowledge of how we’ve failed at times to live up to them. They should come away understanding how free-market principles have raised living standards to unseen heights. And how our ancestors fought tyranny overseas and won. Schools should teach students how democratic institutions protect our unalienable rights and give voice to all Americans today.
Yet various data indicate that schools are failing in this important task. Consider recent surveys revealing troubling attitudes among young people about our nation and its ideals.
This summer, Gallup reported that just 41 percent of Gen Z—13- to 28-year-olds—say they are “proud to be an American.” This is a far lower rate than older age groups, and it’s lower than the large majorities of Gen X who were “proud to be an American” as young adults during the early 2000s.
A Cato Institute/YouGov survey recently found that more young people hold favorable views of socialism than capitalism (62 to 50 percent). Alarmingly, one-third express a favorable view toward communism, an ideology that has left millions dead.
Pew Research Center surveysfind that just 39 percent of young adults believe the American Dream is “still possible,” and a mere 16 percent affirm that the U.S. “stands above all other countries in the world.”
Besides these glum views, the Nation’s Report Card (NAEP) reveals major deficiencies in students’ knowledge about America. In 2022, just 13 and 20 percent of eighth graders scored proficient on national U.S. history and civics exams, respectively. Other survey data uncover similar knowledge deficits among young people, whether in high school or college.
Ohio lawmakers should be doing more to make sure that students are well-educated in American history and government. Yet a recent proposal from House lawmakers would hit the brakes. What do they propose, and how would it undermine civics education? And what could lawmakers do instead that would give students a stronger understanding and appreciation for our nation?
First, the bad idea. Tucked in a larger bill aimed at public school deregulation, Representatives Gayle Manning and Adam Bird seek to eliminate Ohio’s U.S. history and government end-of-course exams. Though these high school tests are not required under federal law—likely why they’re being targeted—the proposal would erode accountability for civics education. Results from these exams are reported publicly and count towards schools’ state ratings, as they are included in performance index and value-added scores. These checks help ensure that high schools, at least,[1] prioritize civics education, alongside math and reading.
Dumping the U.S. history and government tests would actually turn back the clock by more than two decades, as the state has long administered high school social studies exams.[2] Without a history assessment, Ohio would no longer check whether students know something about the New Deal, World War II, and the Cold War—all topics outlined in the state’s high school history standards and which may appear on the state exam. Lacking a government exam, students’ understanding of the Declaration of Independence, Northwest Ordinance, and U.S. Constitution could go untested.
Lawmakers should resist the urge to cut U.S. history and government exams, but also consider constructive steps that can improve civics instruction from elementary to high school. This is a bigger discussion than what space affords here, but let’s consider three starter ideas:
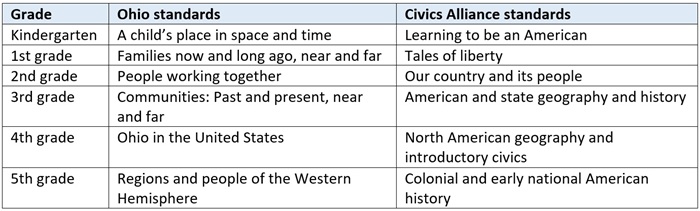
1. Beef-up instruction about American history and civics in elementary schools. As a 2021 national Fordham analysis pointed out, U.S. history and government content is lacking in Ohio’s elementary social studies standards. Having read these standards (and Ohio’s model curriculum) myself, I cannot help but concur. It is indeed thin gruel in the earliest grades. In grades K–3, the only clear expectation that schools teach children about their country comes in kindergarten. There, schools are prompted to teach that “symbols and practices of the United States include the flag, Pledge of Allegiance, and the National Anthem.” Nowhere else do we find expectations in those grades that schools introduce children to crucial events (e.g., American Revolution), influential figures (e.g., Abraham Lincoln), important places (e.g., Ohio River), or founding documents (e.g., Constitution). Instead, we discover mostly vague, uninspiring statements such as a first grade history standard urging schools to teach that “the ways basic human needs are met have changed over time.”
To put a finer point on it, consider the stark contrast between Ohio’s social studies standards and those developed by the conservative Civics Alliance. In its K–3 standards, the emphasis rests on teaching children about their nation. Meanwhile, Ohio’s early elementary standards are organized around family and community, topics worthy of inclusion, but don’t introduce American history and government in a serious way until fourth grade. To be clear, I am not suggesting that Ohio rush out and adopt the Civics Alliance framework, as policymakers would need to address concerns or be ready to stand firm against progressives’ pushback.[3] Still, it’s worth reading the two sets of standards side by side (and other qualitystandards) and judging for yourself whether Ohio does enough to promote knowledge about America during elementary school.[4]
Table 1: The main theme of Ohio and Civics Alliance social studies standards, grades K–5
Note: In the Civics Alliance standards, the “main theme” appearing in this table refers to the title given to its grade-level standards; Ohio calls it the “theme” for each grade.
2. Ensure the U.S. history exam covers all the nation’s history, from 1492 to present (not just 1877 through today). Surprisingly, Ohio’s U.S. history exam doesn’t cover the full sweep of the nation’s history. Why? Ohio’s social studies standards split American history into two courses: an eighth-grade course that covers history until 1876, and then a high school course that covers 1877 to the present. This means that the high school U.S. history exam only covers “part II” of American history.[5] And since there is no eighth-grade social studies assessment, students’ knowledge about colonial America, the Revolutionary War, westward expansion, and slavery and the Civil War goes untested. Lawmakers should make sure that students have a firm understanding of all American history, which—assuming the state maintains its current social studies framework—means adding an eighth grade U.S. history exam to its high school test.
3. Require students to pass the U.S. history and government exams (or the citizenship test, as an alternative) as a condition of graduation. Students passing U.S. history and government exams earn one of the two “seals” needed for graduation. That’s an OK start. But since students have a dozen seal options—and course grades may substitute for test passage—they can easily graduate without demonstrating proficiency on U.S. history and government exams. State lawmakers should insist that students pass these exams or the citizenship test, as GOP gubernatorial candidate Vivek Ramaswamy has proposed. This would push American history and government to the forefront in schools’ priorities, motivate students to learn valuable content, and help ensure that all Ohio students leave high school with the knowledge necessary for responsible citizenship.
* * *
Ohio schools should be places where students learn what it means to be an American. Standards and accountability measures help ensure schools carry out this important responsibility. These policy levers aren’t the only ones that matter, of course, but they are essential if we are to graduate young people knowledgeable about our nation and the values that have held it together for almost two hundred and fifty years.
[1] State lawmakers in 2021 ditched the fourth and sixth grade social studies exams, so there is no assessment-based civics accountability before high school.
[2] In previous iterations of the state testing program, this consisted of a ninth-grade citizenship test and, later, a tenth-grade social studies Ohio Graduation Test.
[3]House Bill 103 of the 135th General Assembly proposed a task force charged with revising social studies standards with an eye toward using the Civics Alliance framework as a baseline. The bill did not move out of committee (for proponents and opponents, see here).
[5] The only exception is that high school U.S. history covers founding documents (e.g., Constitution and Declaration of Independence), as does eighth grade history.
Nestled between these two extremes are Ohio’s math results. There are glimmers of good news, to be sure. But there’s also a lot of work to be done and no time to waste. Here are three big takeaways that will hopefully inspire state leaders to take action on policies that can boost math achievement.
1. Math proficiency improved incrementally since last year.
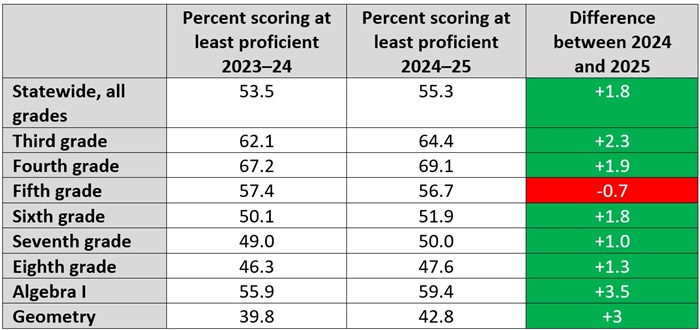
Chart 1 shows the number of students who scored proficient or above on the state’s math exams during the two most recent school years. In the final column, which identifies the difference between 2024 and 2025 results, green shading indicates improvement and red indicates a decline.
Chart 1. Percentage of students scoring at least proficient on math state tests in 2024 and 2025
For the most part, the year-to-year differences are positive. The overall statewide proficiency rate went up by 1.8 percentage points, which is much better than the measly half a percentage point the state managed between 2023 and 2024. In elementary and middle school, third grade registered the largest improvement in proficiency, with a jump of 2.3 percentage points. But it was the high school exams of Algebra I and geometry that produced the largest gains overall (3.5 and 3 percentage points, respectively). Meanwhile, the only grade level to see a drop in proficiency was fifth, though it was by less than 1 percentage point.
Although the year-to-year differences are positive, it’s important to recognize that there are significant numbers of students who aren’t meeting grade level standards. On two tests, eighth grade math and geometry, proficiency was below 50 percent. Last year’s eighth grade results are especially worrisome, as these are students who are now in their first year of high school. In less than four years, they’ll be out in the world as adults—and less than half of them are currently proficient in math. Third and fourth grade results are encouraging, as proficiency is around or above 65 percent. But even in these areas, there are still tens of thousands of students who aren’t proficient.
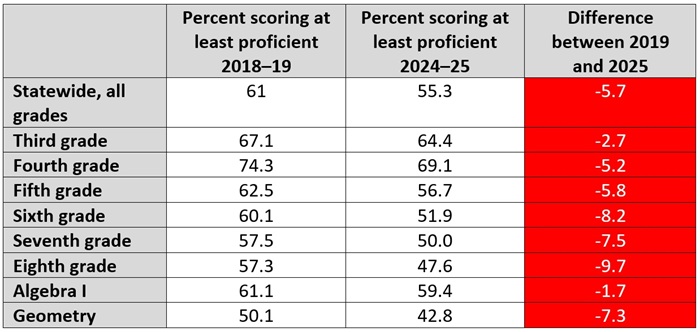
2. Proficiency rates still haven’t returned to pre-pandemic levels.
Ohio’s state report card summary celebrates that we’ve seen “encouraging improvements” in statewide math proficiency over the past five years. And as outlined above, proficiency has improved in nearly every grade level. But limiting comparisons to the past five years means setting the 2020–21 school year as the baseline for improvement. That’s the same academic year that state test results cratered courtesy of the pandemic. In fact, in the majority of grades and subjects, 2021 test scores are the lowest on record over the last decade. When scores are that low during the baseline year, it’s not difficult to show improvement.
To get a complete picture of math achievement in Ohio—and to put improvements into the proper perspective—it’s crucial to compare recent results to pre-pandemic proficiency rates. Chart 2 shows the number of students who scored proficient or above on the state’s math exams during the 2018–19 and 2024–25 school years. The final column identifies the difference between the two, with red shading indicating that the proficiency rate hasn’t returned to pre-pandemic levels.
Chart 2. Percentage of students scoring at least proficient on math state tests pre- and post-pandemic
It should worry policymakers, advocates, and families that the entire final column is red. Statewide and in every grade level, math achievement has yet to bounce back to pre-pandemic levels. But it’s the size of these discrepancies that should shift the worry meter into overdrive. Fourth and fifth grade have a gap of more than 5 percentage points. Seventh grade and geometry have a gap of approximately 7 percentage points. Sixth grade clocks in at just over 8 percentage points. And eighth grade has a whopping 9.7 percentage point difference. Remember, the statewide proficiency rate jumped less than 2 percentage points this year. If Ohio doesn’t start improving at a more rapid pace, it will take another five years to close all of these gaps.
3. More than a fourth of students are scoring limited in most grades.
When students take Ohio’s state exams, their results fall into one of five performance levels: limited, basic, proficient, accomplished, and advanced. The top three levels (proficient, accomplished, and advanced) are considered passing scores, while the lowest (limited) is a red flag that students are far behind and at serious risk of falling further still.
Chart 3 shows the percentage of students who scored limited during the last two academic years. The good news is that the number declined in every grade except eighth. The bad news is that even with these declines, there are still significant numbers of students scoring limited. In elementary and middle school, the percentage ranges from 23 percent in fourth grade to an eye-popping 38.5 percent in eighth. Algebra I posted the smallest percentage, perhaps because the exam is part of Ohio’s graduation requirements and has higher stakes attached. Even so, a fifth of students are still scoring limited in a subject that’s critical for future success.
Chart 3. Percentage of students scoring limited on math state tests
***
Ohio has a math problem. Too many students aren’t meeting grade level standards. Achievement has yet to bounce back to pre-pandemic levels. Tens of thousands of kids are scoring in the lowest achievement category. And while proficiency rates did improve compared to last year, an average bump of less than 2 percentage points isn’t enough. It’s time for state leaders to buckle down and take the math crisis in Ohio seriously. Students are counting on it.