
Last week, the Ohio Department of Education and Workforce (DEW) released updated report cards for the 2024–25 school year. Overall, the results are troubling. Early literacy numbers are disappointing. Reading proficiency rates dipped down. Statewide math proficiency crept up but still sits at just 55 percent. And in the majority of urban districts, overall proficiency rates are alarmingly low.
Clearly, there’s work to be done. But Ohio’s issues extend beyond academics. Chronic absenteeism, which is defined as missing at least 10 percent of instructional time for any reason, can negatively impact both academic and social-emotional development. And according to state report cards, a fourth of Ohio students—roughly 400,000 kids—were chronically absent last year.
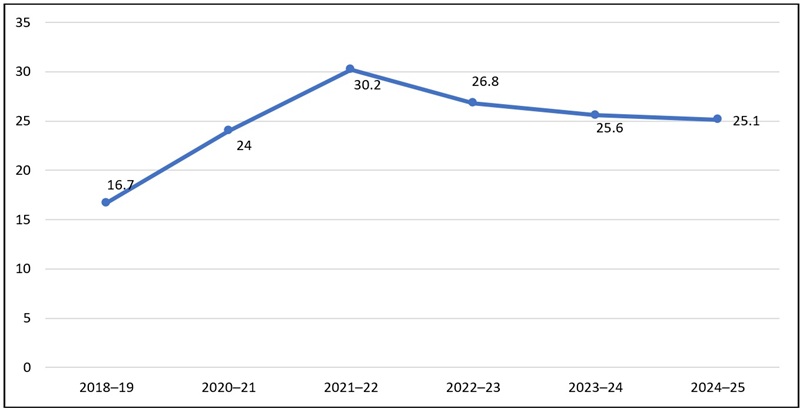
Figure 1 displays Ohio’s statewide chronic absenteeism rate over time. In 2018–19, it was just shy of 17 percent. But by 2021–22 it had jumped to 30 percent, as the number of students who were chronically absent skyrocketed during pandemic-era disruptions. Ohio’s rate ticked down to 27 percent the following year, which many hoped would be the start of a significant downward trend. But the last two years have dashed those hopes. The statewide rate was 25.6 percent in 2023–24 and 25.1 percent in 2024–25. That’s an improvement of fewer than 2 percentage points over the course of two years.
Figure 1. Statewide chronic absenteeism rate, 2018–2025
The statewide rate obscures even worse numbers at the local level. Table 1 identifies nine districts that registered chronic absenteeism rates above 50 percent during the 2024–25 school year. The highest rate was in Lorain (which also happened to post the state’s lowest performance index score), followed by Youngstown and North College Hill near Cincinnati. More than half of students in Cleveland and Columbus were also chronically absent last year. Rates from the 2023–24 school year have been included for comparison. The final column shows the year-to-year difference, with green shading indicating a decline in the district’s chronic absenteeism rate and red shading indicating a rise.
Table 1. Districts with chronic absenteeism rates above 50 percent in 2024–25

From a year-to-year perspective, it’s not all bad news. East Cleveland, which dropped its chronic absenteeism rate from an eye-popping 63.5 down to 53.2, is a welcome bright spot. That’s a decline of more than 10 percentage points and, along with some impressive academic improvements, signals that things are looking up in East Cleveland. Lockland Local also registered a sizable decline of 5.3 percentage points. But four other districts saw their rates jump. North College Hill had an increase of 5.1 percentage points and Cleveland went up by 4.2 percentage points.
Chronic absenteeism is a problem for all schools. But it’s especially troublesome in districts where large numbers of students are academically behind. Table 2 identifies the pre- and post-pandemic chronic absenteeism rates in the Ohio Eight, a group of eight urban districts with a long history of academic struggles, as well as the statewide average. The final column identifies the difference between pre-pandemic rates in 2019 and the most recent post-pandemic percentage in 2025.
Table 2. Pre- and post-pandemic chronic absenteeism rates in the Ohio Eight districts
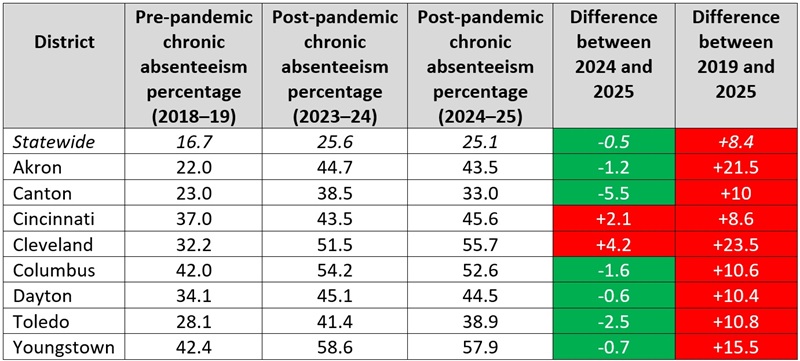
These data answer several important questions about progress (or lack thereof) in the Ohio Eight.
First, how are districts faring overall? Not well. At least a third of students are chronically absent in each one. Three of them—Cleveland, Columbus, and Youngstown—have rates above 50 percent. And they’re all well above the statewide average, with the gap ranging from 7.9 percentage points in Canton to a whopping 32.8 in Youngstown. Youngstown’s sky-high numbers are particularly noteworthy because, although the district technically improved between 2024 and 2025, it was by less than 1 percentage point. Not only is Youngstown’s 2025 rate the worst among the Ohio Eight, it’s the second worst in the entire state.
Second, did chronic absenteeism rates decline during the most recent school year? In six of the eight districts, the answer is yes. Only Cincinnati and Cleveland registered higher percentages in 2025 than 2024. Canton saw the biggest improvement, with a decline of 5.5 percentage points, followed by Toledo with a drop of 2.5. The four remaining districts clocked in with improvements below 2 percentage points.
Third, after several years of fully in-person classes, have districts bounced back to pre-pandemic levels? No. Not even close. Five of them have a gap of roughly 10 percentage points between their 2019 and 2025 rates. Another two—Akron and Cleveland—have appallingly large discrepancies of more than 20 percentage points. And while Cincinnati was one of two districts to see an increase in its 2025 rate, it’s also the district with the smallest gap—8.6 percentage points—between current and pre-pandemic numbers.
Overall, these data paint a depressing picture. The needle has barely moved at the state level. And in some districts, chronic absenteeism has actually gotten worse. State leaders have tried to address the issue with pledges and taskforce recommendations and toolkits. But if those efforts are having an impact, it’s still not visible on state report cards.
Part of the problem is that state report cards only come out once a year, which means Ohio publicly updates absenteeism rates just once a year. Now that last year’s numbers have been published, we’re all pretty much in the dark until next September. Given the sizable impact chronic absenteeism can have on short- and long-term student outcomes—and Ohio’s troubling academic results on this year’s report cards—annual data dumps aren’t going to cut it.
For a better alternative, Ohio could look to Rhode Island, where leaders have created several publicly available, interactive tools. For example, the state’s real-time attendance dashboards update daily to show attendance trends in individual schools, along with data on early dismissals and tardies (both of which can have a sneakily big impact on chronic absenteeism). Ohio could create its own version of these dashboards to give local officials, district and school leaders, and families consistent access to detailed data that they can act on immediately instead of waiting and hoping that next year’s numbers are better.
State-level policy alone won’t solve Ohio’s chronic absenteeism problem. In fact, boosting attendance is largely in the hands of local leaders, schools, and community members, as they’re the ones who are trusted by parents and regularly interact with kids. But state leaders can support local efforts with real-time data. Here’s hoping they choose to do so quickly.