It’s been a little over two years since Ohio policymakers established a statewide initiative championing the science of reading, an evidence-based instructional approach that focuses on phonics and knowledge-building. Under this policy, public schools are required to use state-approved high-quality instructional materials (HQIM) and teachers and administrators must complete professional development. The state budget passed just a few months ago built on these efforts by continuing to fund literacy coaches and requiring the Department of Education and Workforce (DEW) to maintain and expand its professional development offerings.
Here at Fordham, we’ve been keeping a close eye on a variety of success indicators to track the progress of this sweeping effort. Recently released state report cards for the 2024–25 school year offer our first in-depth look at student achievement under these policies. But before we dig into the data, here are some important reminders about why it’s far too early to make any sweeping judgments.
First, this initiative is a huge undertaking. And as the saying goes, Rome wasn’t built in a day. Progress (or lack thereof) during the first official year of implementation shouldn’t be used to judge the success or failure of such a complex policy. The science of reading is a long-term investment in our schools and students’ futures, and patience—combined with a strong sense of urgency—is required. Remember also that a one-year change in proficiency rates doesn’t make for a trend. We won’t be able to understand the true impacts of this effort until we have a few more years of data.
Second, the science of reading largely focuses on Ohio’s youngest learners. The students who will benefit from these changes are currently in preschool, kindergarten, and first grade—but state testing doesn’t begin until third. Ohio’s “improving K–3 literacy” measure sheds some light on growth among early elementary students (more on that below), but for the most part, report card data won’t include impacted students for another few years.
Third, the 2024–25 school year was one of transition, during which plenty of districts were still working out science of reading implementation kinks. For example, according to a report given by DEW officials at a public meeting this summer, 82 percent of districts reported that they were fully aligned to the state’s HQIM expectations by June 15. That means one in every five weren’t fully aligned. (To its credit, DEW plans to audit districts and schools this year to verify their alignment.) Professional development is similar. State lawmakers required all current educators to complete a professional development course in the science of reading, but the deadline wasn’t until June 30, 2025. In other words, although science of reading implementation officially began last year, in reality, it was more of a transition period.
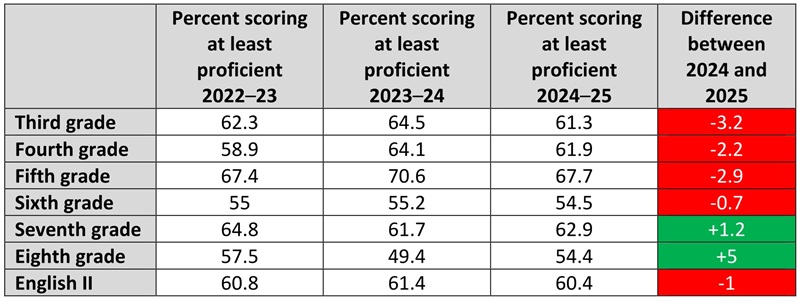
Even with these caveats, it’s crucial to closely examine report card data. To begin, let’s take a look at statewide results. Chart 1 shows the number of students who scored proficient or above on the state’s English language arts exams. In the final column, which identifies the difference between 2024 and 2025 results, green shading indicates improvement and red indicates a decline. Only two grades—seventh and eighth—saw an increase in the percentage of students who scored at least proficient. Every other grade saw a decrease, with the steepest drop coming for third graders.
Chart 1. Percentage of students scoring at least proficient on English language arts state tests
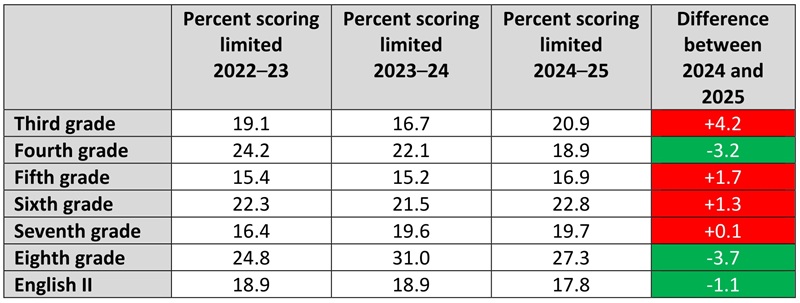
Tracking proficiency numbers will help state leaders measure progress. But identifying how many students score in the lowest achievement level, or “limited,” is also crucial, as declining numbers there would indicate progress as well. Chart 2 identifies the number of students in grades 3–8 and high school who scored limited during the last three school years. The final column identifies the difference between 2024 and 2025 results, with green shading indicating improvement (fewer students scoring limited) and red shading indicating a regression (more students scoring limited). Unfortunately, only three grade levels—fourth, eighth, and the high school English II exam—registered fewer limited scorers than the prior year. Every other grade saw an increase. The highest jump in limited scorers was in third grade, with an increase of more than 4 percentage points. Together, the data in charts 1 and 2 paint a worrisome picture for the make-or-break year of third grade, as fewer students scored proficient and more scored limited.
Chart 2. Percentage of students scoring limited on English language arts state tests
Given that Ohio’s science of reading effort is a statewide initiative, it’s important to track statewide results. But state numbers can mask improvement (or lack thereof) in individual districts. The report card’s early literacy component allows us to dig deeper. For the sake of narrowed focus, let’s consider results from the Ohio Eight, a group of eight urban districts with a long history of poor performance. We’ll also add Lorain and East Cleveland to the mix, since they spent several years under the oversight of now-defanged Academic Distress Commissions. (So did Youngstown, which is one of the Ohio Eight.) Together, these ten districts serve nearly 187,000 students—more than a tenth of the state’s public-school population—and are among those most in need of early literacy improvement.
First, let’s look at how they performed overall on the early literacy component. Chart 3 displays two data points—districts’ star ratings on the component and the weighted percentage that determined those ratings. This percentage is based on three measures: third-grade reading proficiency rates, third-to-fourth grade promotional rates, and the percentage of off-track readers who move to on-track status in the following year. Districts with a weighted component percent of less than 58 earned one out of five stars while those with a weighted component percent from 58 to less than 68 earned two stars. In the columns dedicated to the most recent school year, green shading indicates improvement from the prior year, yellow indicates results that remained flat, and red indicates a decline.
Chart 3. Overall early literacy results on state report cards in selected districts
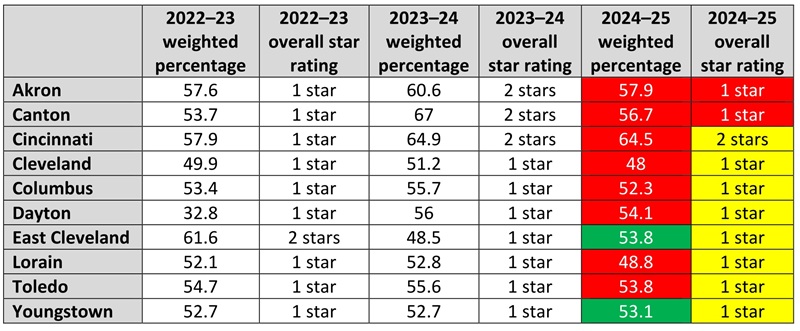
Cincinnati was the highest performer of these districts and the only one to earn two stars. Its weighted percentage did decline between 2024 and 2025, but the drop was small enough that it did not impact its rating. The lowest performers were Cleveland, which earned a weighted percentage of 48, and Lorain, with a 48.8. Just two districts earned a higher weighted percentage than they did the prior year: East Cleveland and Youngstown. East Cleveland improved by 5.3 percentage points, while Youngstown eked out a gain of less than half a percentage point.
Next, let’s take a closer look at one of the early literacy component’s three measures: third grade reading proficiency. Chart 4 displays the percentage of students who scored proficient on the reading segment of the ELA exam, as well as the statewide third grade proficiency average.[1] The final column identifies improvement between 2024 and 2025 with green shading and a decline with red.
Chart 4. Percentage of third graders scoring proficient on the reading segment of state ELA exam in selected districts
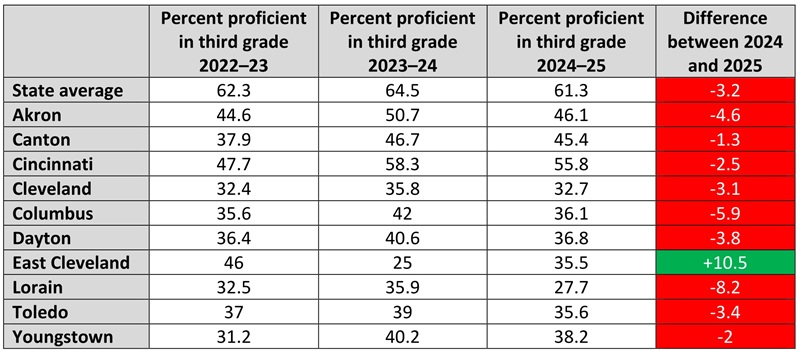
The only district that improved was East Cleveland, with a sizable jump of more than 10 percentage points. Considering East Cleveland had the worst proficiency rate of these districts in 2024—an abysmal 25 percent—that’s good news. Meanwhile, in the nine districts that regressed, the decline ranged from 1.3 percentage points in Canton to a whopping 8.2 percentage points in Lorain. That puts Lorain’s third grade proficiency rate at just under 28 percent, making it the only district in the group where fewer than a third of third graders were proficient (although Cleveland, the next lowest performer, only meets that threshold via rounding). It’s also worth noting that almost all of these districts are considerably behind the state average, with the difference ranging from 15.2 to 33.6 percentage points. Cincinnati had the smallest gap and is just 5.5 percentage points behind the state average.
Lastly, let’s take a look at progress. DEW tracks district progress via the “improving K–3 literacy” measure, which uses the results of fall diagnostic assessments to determine the percentage of students who move from “not on track” to “on track” in reading from one year to the next. These results indicate how well schools are improving K–3 literacy throughout all the early grades, not just third. By doing so, the measure identifies schools and districts that are making critical progress with struggling readers. Chart 5 displays the overall percentage of students that each district moved to on track in reading during the three most recent school years, as well as the difference between 2024 and 2025 results, with green shading indicating improvement and red a decline. Canton, which is shaded in yellow, is a unique case, as its kindergarten data for the 2023–24 school year were misstated on its report card.
Chart 5. Results for the improving K–3 literacy measure on state report cards in selected districts
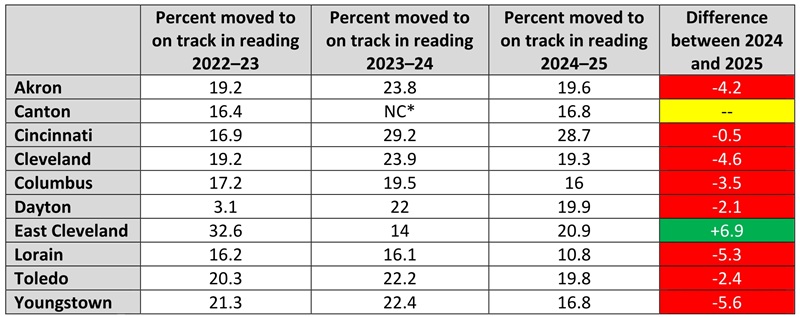
Unfortunately, there’s very little progress to celebrate. Only one district—East Cleveland—showed improvement. But it did so with a sizable jump of nearly 7 percentage points that catapulted it from the worst of these districts in 2024 to second among them in 2025. There’s still a lot of work to be done, but improved results in both progress and proficiency should be welcome news in East Cleveland.
The other nine districts didn’t fare as well. The percentage of students who were moved to on track in reading declined across the board, with drops ranging from half a percentage point in Cincinnati to 5.3 percentage points in Lorain. The decline in Lorain means the district managed to move just 10 percent of its students to on track in reading. That’s not just the lowest percentage among these districts, it’s the lowest in the entire state. Lorain’s third grade proficiency rate, meanwhile, was the second lowest in the state. Such abysmal numbers should prompt some pointed questions for lawmakers, who voted to give the district a free pass by dissolving its Academic Distress Commission and its state-mandated academic improvement plan. Clearly, Lorain hasn’t improved much in terms of early literacy. In fact, the district is moving backwards.
***
This latest round of state report cards clearly demonstrate that Ohio districts and schools have their work cut out for them when it comes to boosting reading outcomes. But with the state’s science of reading initiative, they have evidence-based tools that should help over the long haul. Now that last year’s transition period is in the rearview, it’s time to look ahead—and put the pedal to the metal!
[1] The statewide results are for the entire third grade English language arts exam, which includes writing, and not just the reading segment.