- Black families disproportionately attend schools of choice and so are caught in the middle of the school choice debate in Chicago. —Chicago Sun-Times
- Student debt, underemployed degree-holders, and political intolerance are causing Americans to lose faith in the value of college. —Douglas Belkin, Wall Street Journal
- Classroom rewards can improve behavior and don’t quash intrinsic motivation, but proper implementation matters. —Emily Oster, Parent Data
- “DEI is worth saving from its excesses. Companies should root out discrimination and hostile training sessions and focus on optimizing talent.” —Roland Fryer, Wall Street Journal
- The latest issue of the journal for state boards of education covers best practices for implementing high quality curricula. —State Education Standard
News stories featured in Gadfly Bites may require a paid subscription to read in full. Just sayin’.
- The irony in this piece is more visible than a mass coronal ejection, I reckon. Sentence one: “Education is at the heart of preparations being made ahead of Ohio’s total solar eclipse coming April 8.” Sentence two: “…and many schools have already announced closures for students the day of the eclipse.” (Mansfield News Journal, 1/22/24)
- School boards gonna school board; unions gonna union. This disastrous mess brought to you by the never-very-functional Akron City Schools will likely be in litigation forever. There are a number of moving parts—always a hallmark of the obstructionist playbook—but the bottom line is that a chance for the district to provide free tutoring services to hundreds of needy students will likely never happen due to union grievances with the plan, the debate around it, the means of its adoption, etc., etc. Tough luck, kiddos! (Akron Beacon Journal, 1/23/24)
Did you know you can have every edition of Gadfly Bites sent directly to your Inbox? Subscribe by clicking here.
Because the housing and education markets are linked, evictions and other involuntary changes in residence often force students to change schools at a time when they are already vulnerable.
But is disrupting at-risk students' education in this manner really necessary?
In this report, University of North Carolina professor Douglas Lee Lauen uses a unique dataset to examine whether charter school enrollment breaks the link between residential and school mobility, particularly for students from traditionally disadvantaged communities.
The results suggest that the right to school choice is also about the right to stay put.
Download the full brief or read it below.
Foreword
by David Griffith and Amber M. Northern
Every now and then, the cracks that form at the intersection of housing and education policy become visible to a casual observer. An overcrowded school building.[1] A desperate family that commits “residency fraud” so their kids can learn.[2] A homeless parent who struggles to enroll her children in a local school.[3]
Yet too often, such fissures are undetectable to all, save the case workers and educators who do their best to patch them (with mixed results). One day Johnny is scraping out a D-minus in English. The next day he’s gone, carried away by circumstances beyond his control—social, economic, familial—to unfamiliar streets and classrooms unseen.
Alas, Johnny’s experience is far from unique. Roughly one in five poor families in the United States changes residences each year, often involuntarily.[4] Worse, because the housing and education markets are linked, involuntary changes in residence often force already-vulnerable students to change schools, at least when their new address is sufficiently far afield that they wind up in another attendance zone.
It follows that, insofar as school choice weakens the link between housing and education, it may hold particular benefits for students who experience “residential instability.” Families would surely benefit from being able to change homes while keeping their children at the same school. Yet, to our knowledge, this potential benefit has never been studied, perhaps because doing so requires a dataset with detailed information on students’ home addresses.
That’s why we were excited to learn of the dataset that the University of North Carolina’s Douglas Lee Lauen and his research assistants have painstakingly assembled. Professor Lauen is well-known for his prior work on charter schools and educational accountability and, like us, was eager to shine a bright light on this neglected dimension of school choice. In addition to information on student demographics, achievement, attendance, and discipline, his database includes the home addresses of every student who enrolled in a North Carolina public school between 2016–17 and 2018–19. This unusually rich dataset, which includes information on more than four million students, enables analysis of the relationships between residential mobility, school mobility, and charter school enrollment.
Lauen’s resulting report is worth reading in full. But here are its four key findings.
First, about one in seven students experiences a change in residence or school in a given school year. Moreover, there is a strong link between residential and school mobility, although it’s hard to say how many of these moves are “involuntary.”
Second, Black and Hispanic students are more mobile than White students. For example, Black students are about twice as likely to change schools as White students (and about two-thirds of those moves are accompanied by changes in residence). In other words, racial disparities in school mobility are effectively baked into a system in which housing and schooling stay linked.
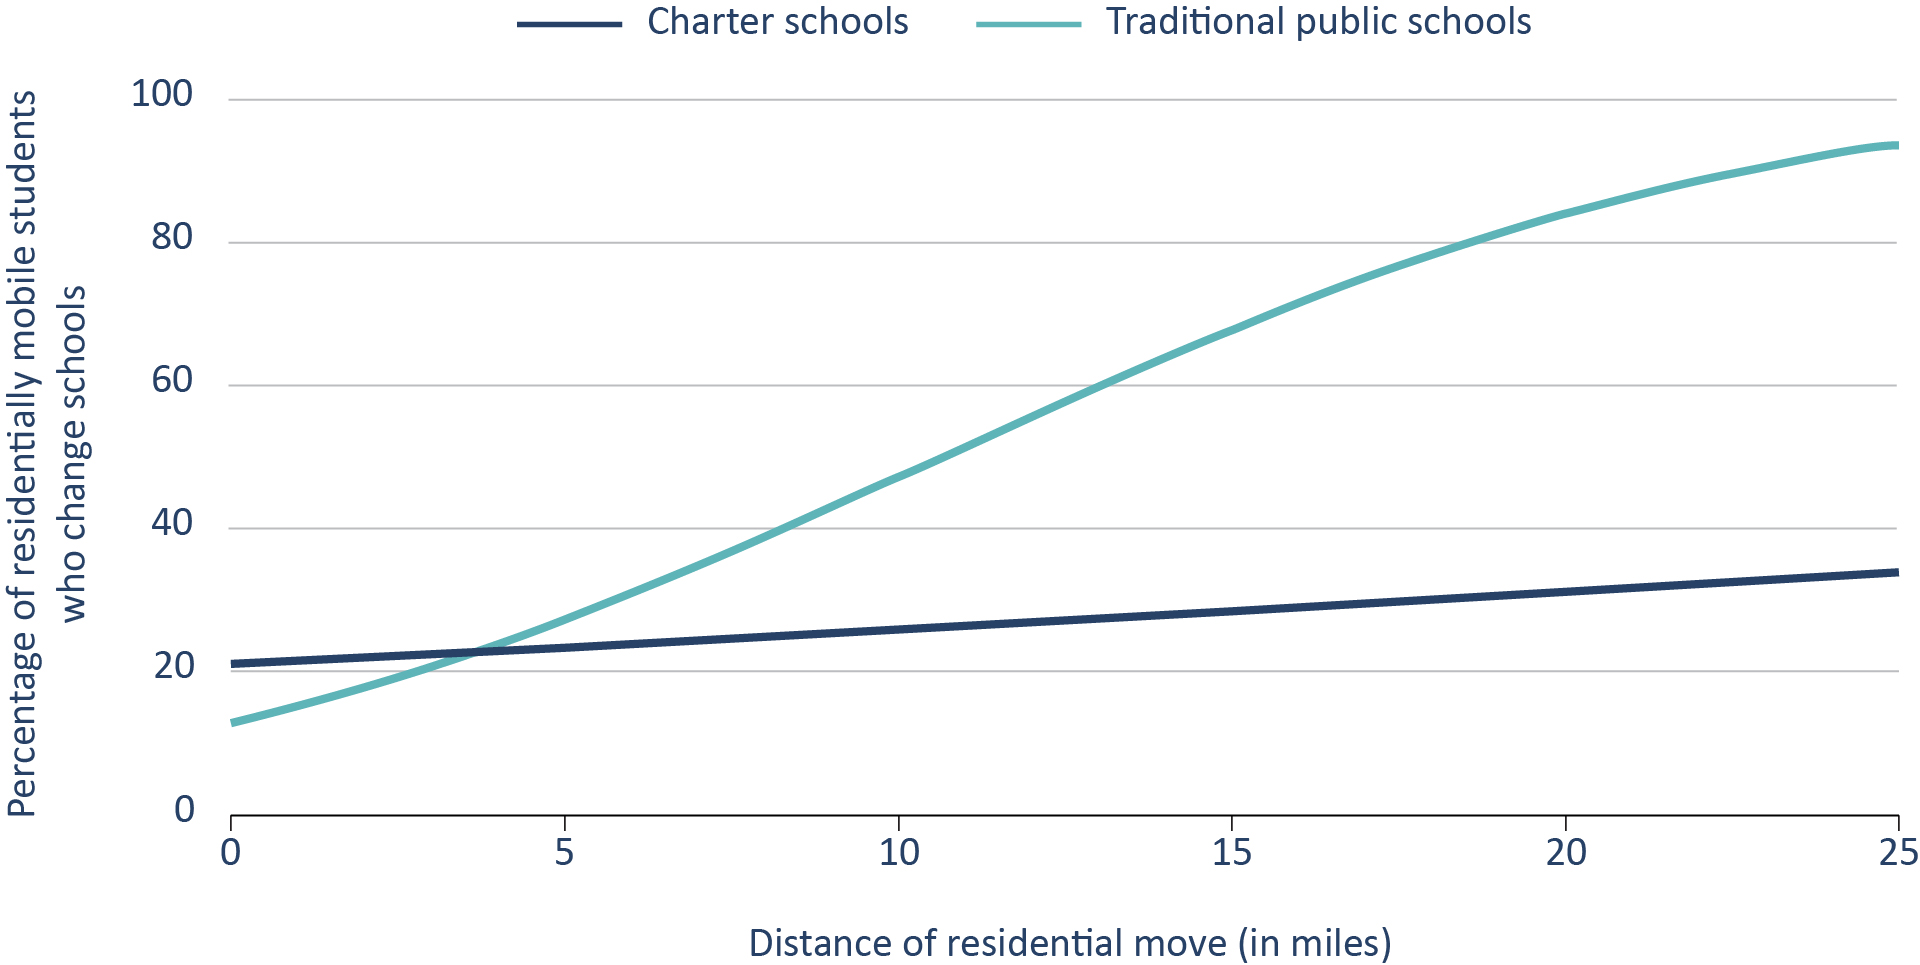
Third, residentially mobile students in charter schools are less likely to change schools than their counterparts in traditional public schools. More specifically, the former become less likely to change schools relative to students in traditional public schools as the distance of the residential move increases (Figure FW1).
If you think about it, this makes sense: The further a family moves, the more likely the kids are to wind up in the catchment zone of a different traditional public school, or an entirely different school district. But most charter schools don’t have catchment zones, so provided any transportation barriers are surmountable, nothing prevents their students from remaining enrolled should where they live change.
Figure FW1: As the distance of the residential move increases, students in charter schools become less likely to change schools than those in traditional public schools.
Finally, residential mobility, school mobility, and “compound” mobility are all associated with a small decline in academic progress in math and a slight increase in suspensions. In other words, the results suggest that needlessly high mobility rates have real costs for students (and of course there could be other costs that we do not observe).
Isolating these adverse effects is challenging, as is generalizing about the various scenarios that can result in a student changing schools. (Consider the difference between a student who is expelled and a student whose parent takes a higher-paying job in a better-resourced community.) Still, if there’s no reason to believe that a student’s new school will be better than their old one, it’s hard to endorse a regime that forces families to change schools when they change homes.
***
“Freeing” students in low-income neighborhoods from low-performing schools remains a key benefit of school choice. But another, albeit less obvious, benefit is reducing the educational disruption and personal stress that often come with a change in residence, especially for students in those same neighborhoods.
Every year, about 3 million children in the United States are evicted.[5] As of 2022, about 1.2 million students were considered homeless by the U.S. Department of Education (though the true number is almost certainly higher).[6] And in the past year, a combination of rising rents and the expiration of pandemic-era protections has created a housing crisis that has disproportionately affected students of color.[7] Right now, in New York City alone, at least 100,000 kids are in temporary housing.[8]
Obviously, school choice can’t address all of the factors underlying such tragic statistics, or completely quell their consequences. But more robust and equitable open enrollment policies would be one step. More charter schools (which are legally prohibited from giving preference to students from “good” neighborhoods) would be another. And, regardless of how we attack the problem, the burden of proof should fall on those who insist that students who are already perilously close to falling through the cracks must change classes, teachers, curricula, and peer groups if and when they find a new home.
In short, the right to school choice is also about the right to stay put.
Introduction
Every year, about 10 percent of U.S. households change residences. Often, these changes are positive, such as when a family upgrades to a larger or newer home or when parents move to be close to better career opportunities. But sometimes they are a sign that something has gone wrong. And in these cases, the implications for student learning and well-being are generally considered to be negative.
Moving is a stressful activity for any parent, but for many low-income families who rent their homes, “residential instability” is a constant challenge. Residential mobility rates are much higher for renters than for homeowners (24 percent versus 6 percent),[9] and they are significantly higher for poor families, who are far more likely than wealthy or middle-class families to experience such unwelcome shocks as eviction or “unit failure” (e.g., a collapsed roof).[10]
Because housing and education markets in the United States are linked, involuntary changes in residence can also force already vulnerable students to switch schools. After all, most traditional school districts assign students to schools based on the catchment zone in which they reside. Most require students to enroll in a new school when a residential move takes them across those boundary lines, and students whose moves take them to new school districts are nearly always obliged to change schools, save in the handful of states with robust interdistrict choice policies.
Consequently, to the extent that school choice severs the link between housing and education, it seems likely that it holds particular benefits for the subset of students who experience residential instability. After all, provided the new address is reasonably close to the child’s previous school and some sort of transportation can be arranged, nothing prevents families who enroll their children in charters, private institutions, or other schools of choice from keeping their children in these institutions when their home addresses change.
To our knowledge, there has been no research on the tendency of charters or other schools of choice to retain residentially mobile students. Accordingly, this study uses data from North Carolina to explore the effect of residential mobility on school mobility, the relationships between both forms of mobility and student outcomes, and the extent to which charter school enrollment can buffer students from the potentially harmful effects of residential instability.
More specifically, this study seeks answers to four research questions:
Q1: What percentage of students experience residential and/or school mobility?
Q2: How do residential and school mobility rates vary by race and socioeconomic status?
Q3: Is the relationship between residential and school mobility stronger or weaker in charter schools? And what impact does the distance of the residential move have on this relationship?
Q4: To what extent are residential and/or school mobility associated with worse outcomes for students?
Because the study is limited to North Carolina, the answers to these questions necessarily reflect the Tar Heel state’s specific student population and charter school sector, which in some ways are atypical compared to other states (see The North Carolina context). On the other hand, this is a first-of-its-kind examination of these questions in a large and diverse state with a healthy mix of rural, urban, and suburban areas. Therefore, to the extent that the “tyranny of zip code” remains a dominant feature of K–12 education in the rest of the United States, the findings may hold broader lessons.
Background
Prior research suggests that both residential and school mobility have negative effects on children’s well-being and academic outcomes,[11] and at least one study has found that changing schools has a negative impact on residentially mobile students.[12] Furthermore, research shows that poor families move more frequently than rich families and are more likely to relocate to poor neighborhoods with inferior schools.[13] Perhaps as a result, the effects of mobility seem to be particularly acute for poor students.[14]
While the most obvious potential benefit of school choice is that students can gain access to schools that better meet their needs, a less obvious possibility is its potential to reduce the disruption associated with residential shocks that cause low-income families to move from one school catchment area to another. After all, unlike students in most traditional public schools, students in charters typically don’t need to change schools when such shocks occur, so long as the distances and transportation logistics are manageable.
Notably, a more recent line of research suggests that enrolling in a charter school reduces the likelihood that students will subsequently change schools, especially if the charter is high performing.[15] Yet, to our knowledge, there is no research on the extent to which enrolling in a charter school mitigates the negative consequences of residential mobility.
Data and methods
Data for this study come from the North Carolina Department of Public Instruction (NCDPI). The source files contain records for every student who enrolled in a North Carolina public school from three consecutive school years (2016–17 through 2018–19) and include information on students’ home addresses, enrollment, demographics, attendance, disciplinary records, and achievement.
To enable a clean comparison of brick-and-mortar charter and traditional public schools, we exclude magnet schools, virtual charter schools, schools run by UNC Hospitals, and schools run by the state department of corrections from the sample. We also restrict the sample to students with three consecutive years of enrollment data and arrange the analytic samples into three three-wave panels of third through fifth graders, sixth through eighth graders, and ninth through eleventh graders. To produce accurate estimates of “nonstructural” school mobility (i.e., mobility that is not attributable to expected transitions from one grade band to the next), we drop students who made “structural” moves in nonmodal grades (e.g., between fourth and fifth grade rather than between fifth and sixth grade). However, we retain students who did not make normal grade progressions (i.e., those who were retained and those who skipped a grade). After cleaning the address file in Stata to make the addresses and zip codes as consistent as possible, students’ addresses were geocoded with ArcGIS using the USA local composite locator—a process which accurately located about 99 percent of addresses. Finally, a small number of students with more than two addresses for the same school year were dropped.
To measure the predicted gains for students in different mobility categories, we rely on ordinary least squares regression methods (for more, see the Technical Appendix). Unless otherwise stated, these models control for lagged versions of the four outcome variables in the study (math and reading achievement scores, days absent, and suspensions); indicators for economic disadvantage, gifted, disability, English language learner, race/ethnicity, male, retained in grade, and structural moves (i.e., making a school move that is required by a grade-span configuration within the grade 3–5, 6–8, or 9–11 groupings); and neighborhood (i.e., census tract) fixed effects. Standard errors are cluster corrected at the school level. In the figures below, we use a measure of neighborhood socioeconomic status (SES) that is an average of census tract variables linked to the student’s address (see the Technical Appendix).
The North Carolina context
North Carolina’s 200-plus charter schools account for about 9 percent of the Tar Heel state’s total K–12 public school enrollment, a figure that has increased rapidly since 2011, when the legislature lifted the cap established by the state’s original charter school law.
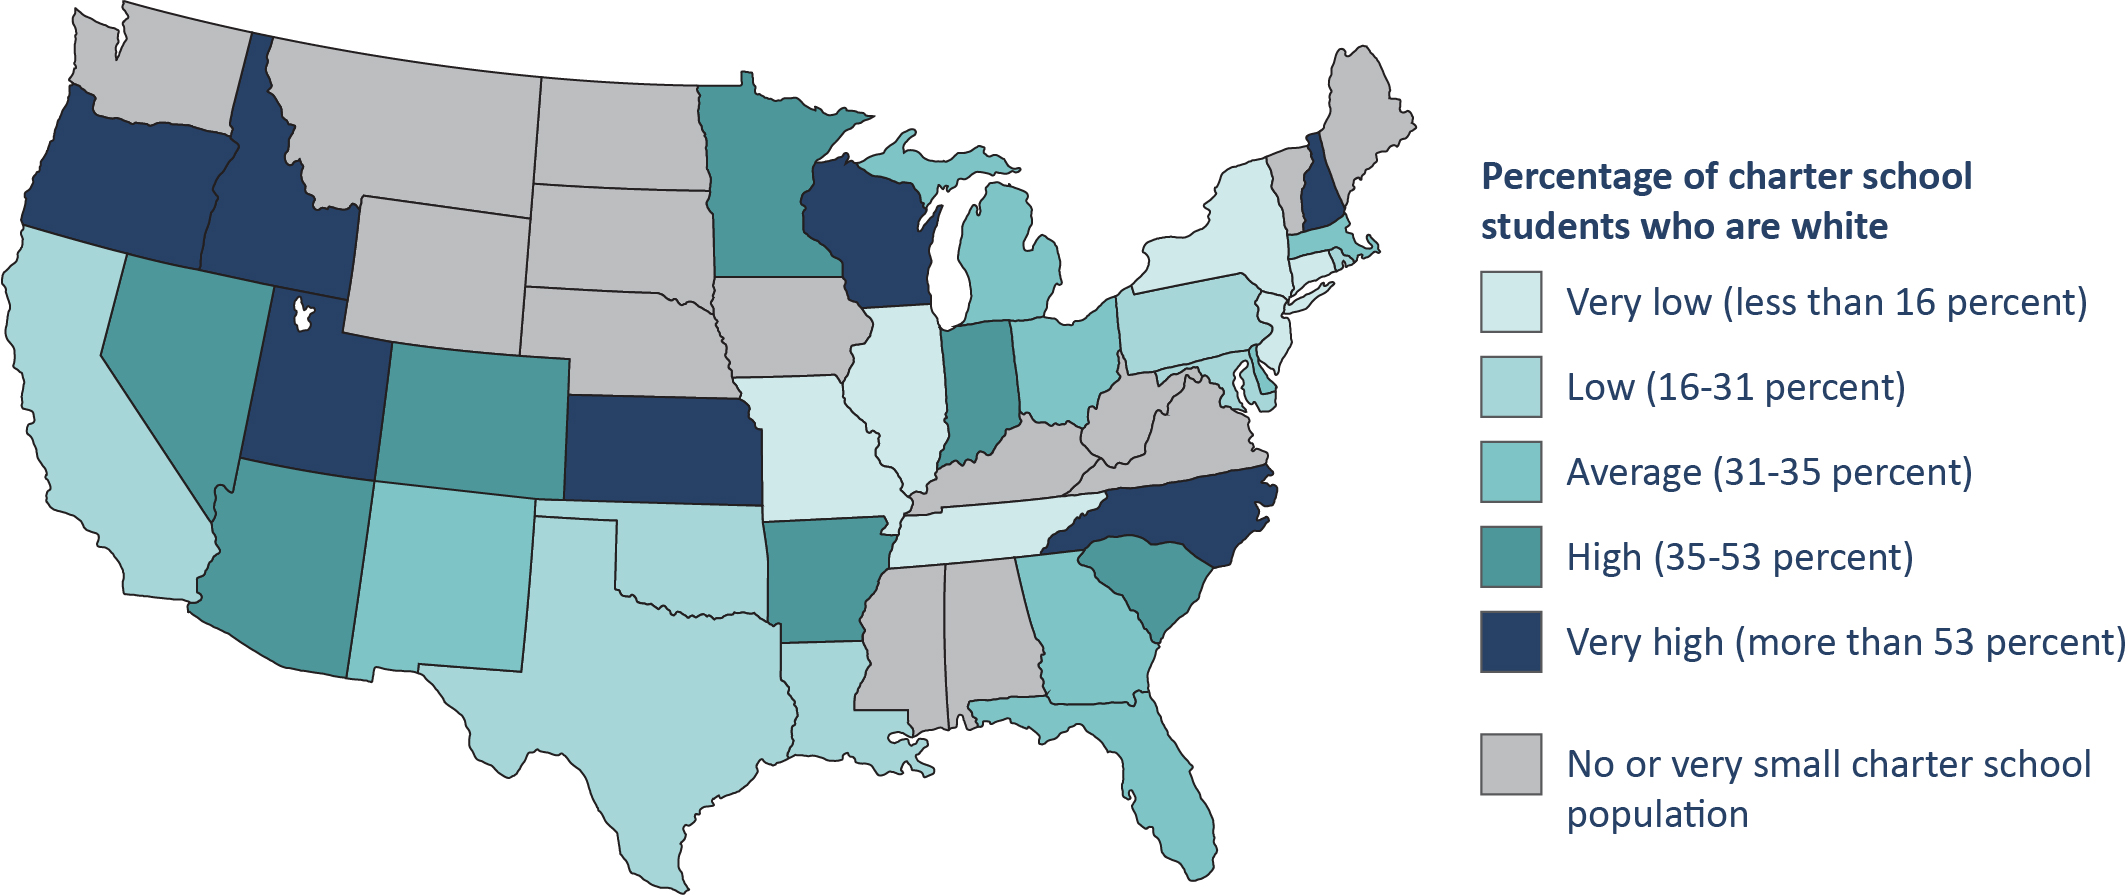
As in most states, charters in North Carolina are concentrated in places with high population density, which tend to be more affluent than rural areas; however, unlike many states, North Carolina also has many charters in affluent suburban and exurban areas, including in the Raleigh-Durham, Charlotte, and Winston-Salem metro areas (see Figure 1). Consequently, North Carolina’s charter schools serve an unusually White and affluent student population relative to other states (see Figure 2).
As discussed in the findings, White and affluent students are somewhat less likely to experience residential and/or school mobility than poor, Black, and/or Hispanic students. However, it is less clear that the effects of charter status on mobility or the effects of mobility on other outcomes of interest differ by student group. In other words, the results presented in this study may very well generalize to residentially mobile charter school students in other states, including those with more mobile charter school populations.
Figure 1. Many charter schools in North Carolina are located in higher-income neighborhoods.
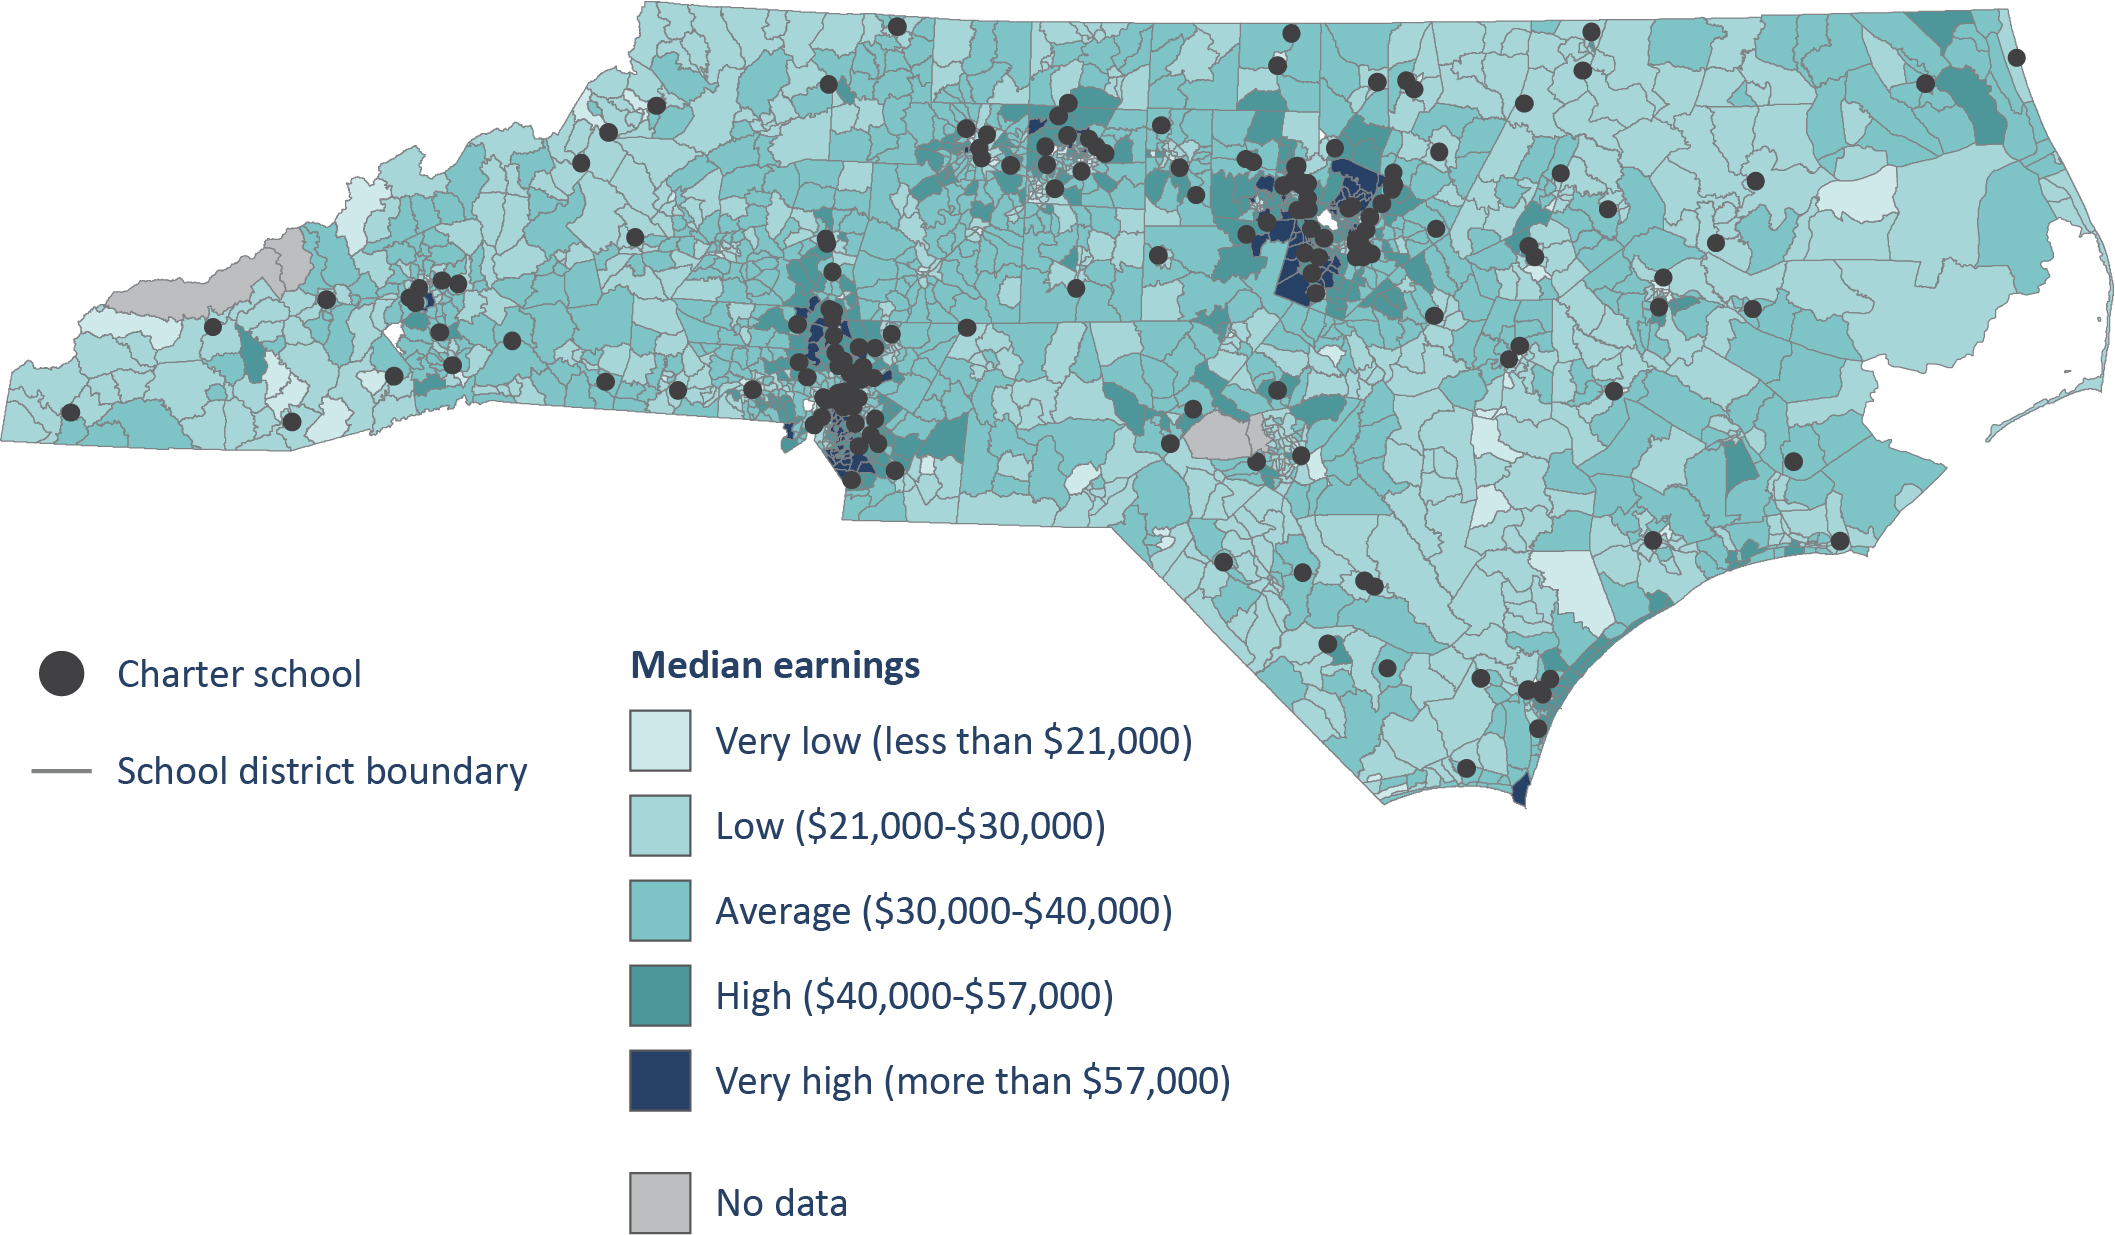
Figure 2. Charter schools in North Carolina serve more White students than charter schools in most other states.
FINDING 1: EVERY YEAR, ABOUT ONE IN SEVEN STUDENTS CHANGES RESIDENCES, SCHOOLS, OR BOTH.
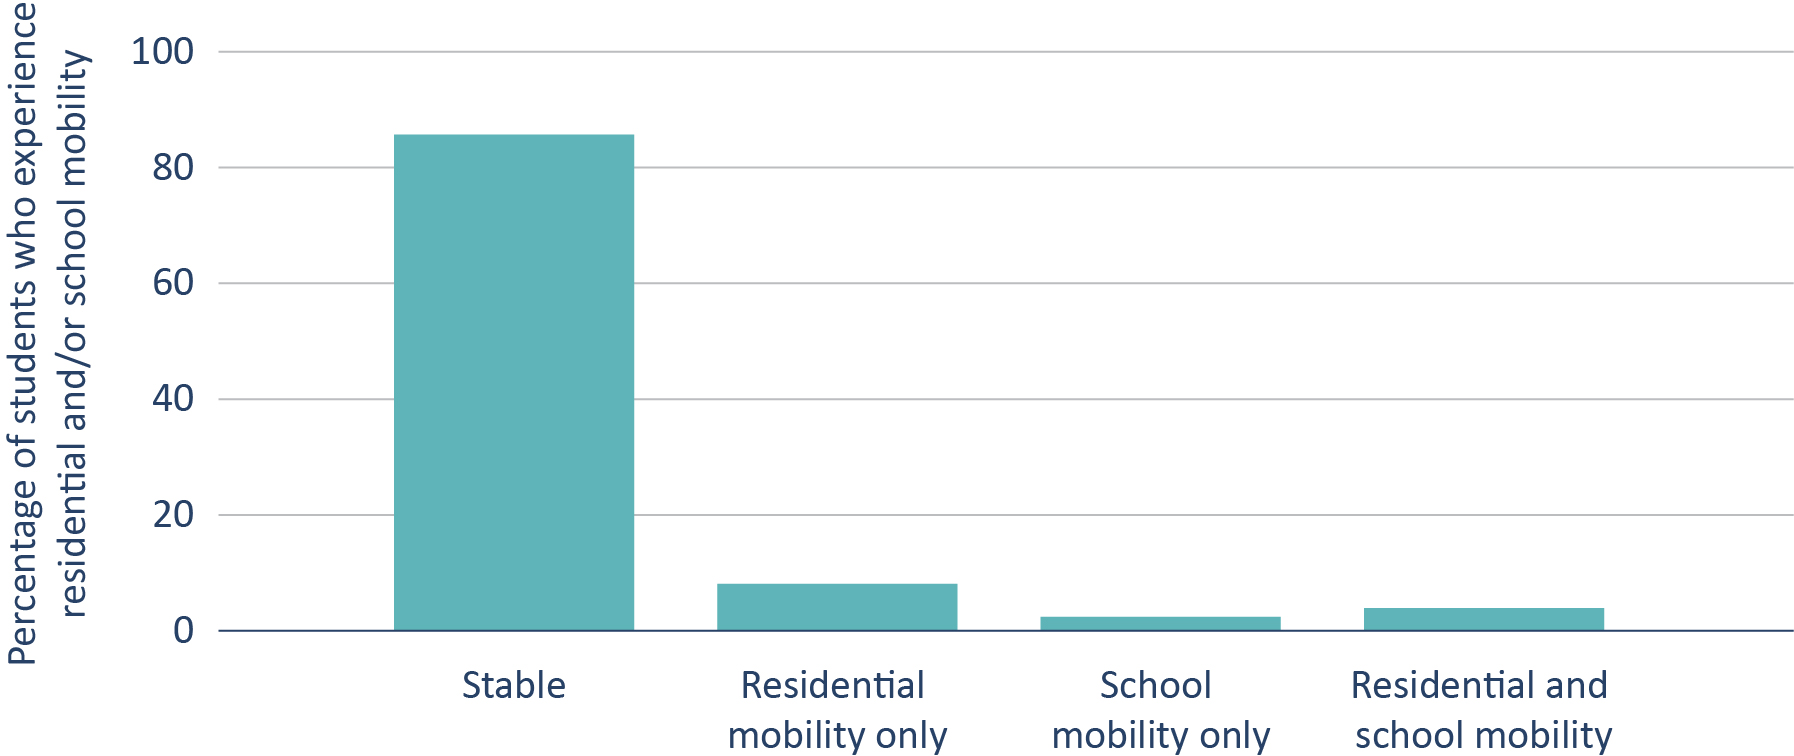
Per the first bar in Figure 3, approximately 14 percent of North Carolina students experience a “nonstructural” mobility event—that is, a change in residence or school that is not attributable to the expected transition from elementary to middle school or from middle school to high school—in a given school year. More specifically, about 7 percent of all students experience residential mobility only, about 2.5 percent experience school mobility only, and about 3.5 percent experience residential and school mobility.
Figure 3. Every year, about one in seven students changes residences, schools, or both.
FINDING 2: IN GENERAL, BLACK AND HISPANIC STUDENTS ARE MORE MOBILE THAN WHITE STUDENTS.
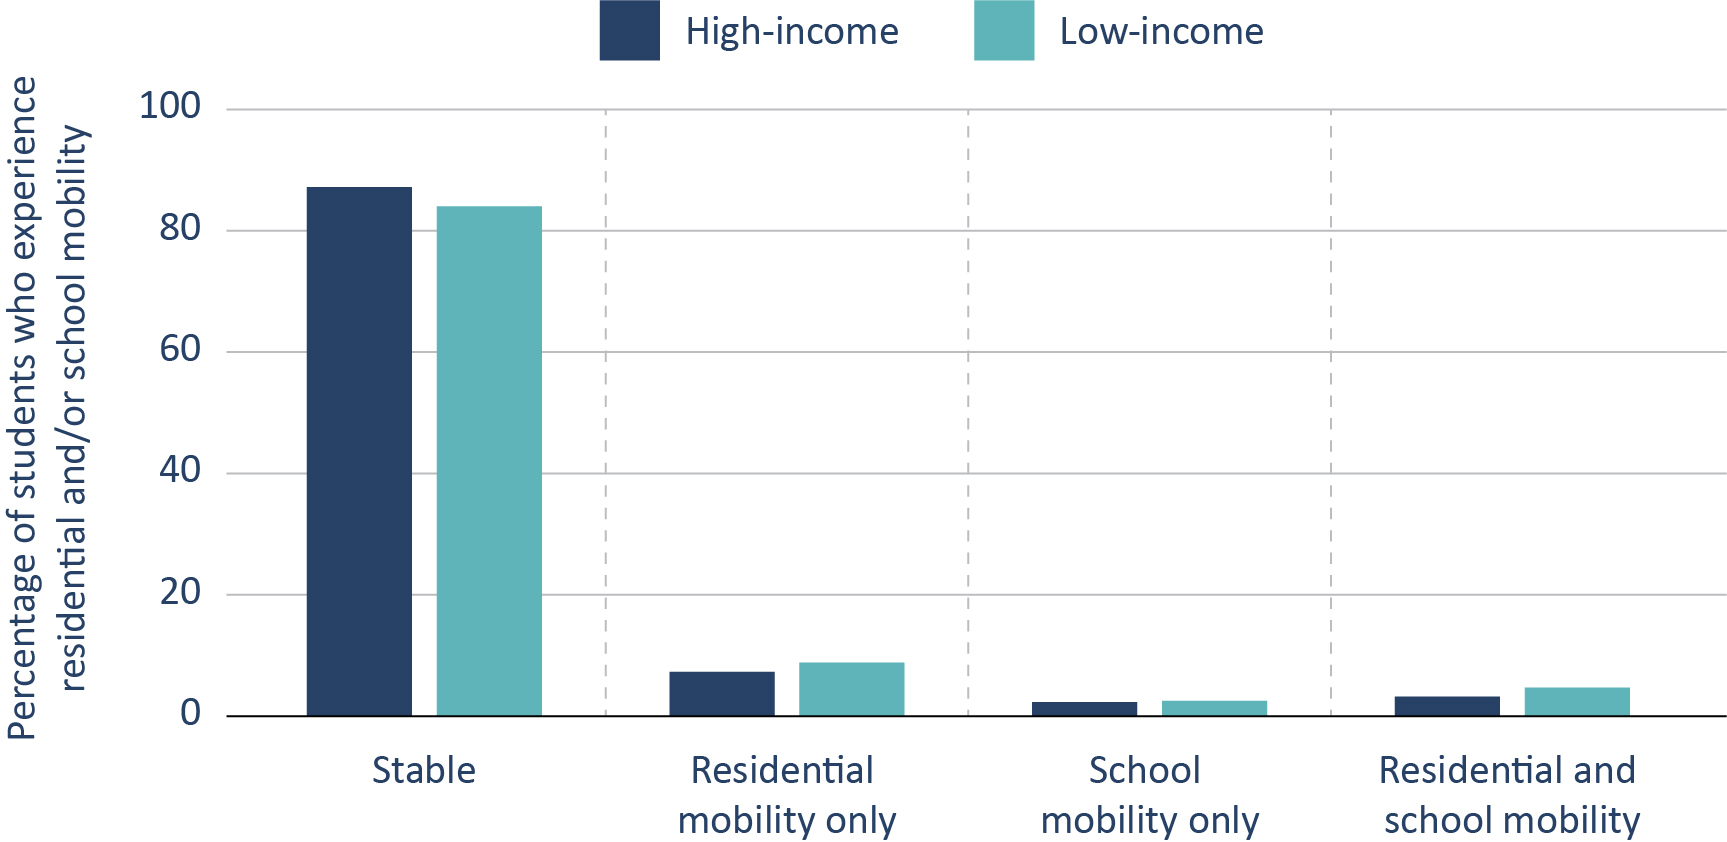
As shown in figures 4 and 5, non-White students and those from low-income families experience higher rates of residential and/or school mobility. For example, more than one in five Black students experiences some form of mobility in a given year. The rate of “compound mobility” (i.e., concurrent residential and school mobility) for Black students is more than double the rate for White students.
Figure 4. In general, Black and Hispanic students are more mobile than White students.
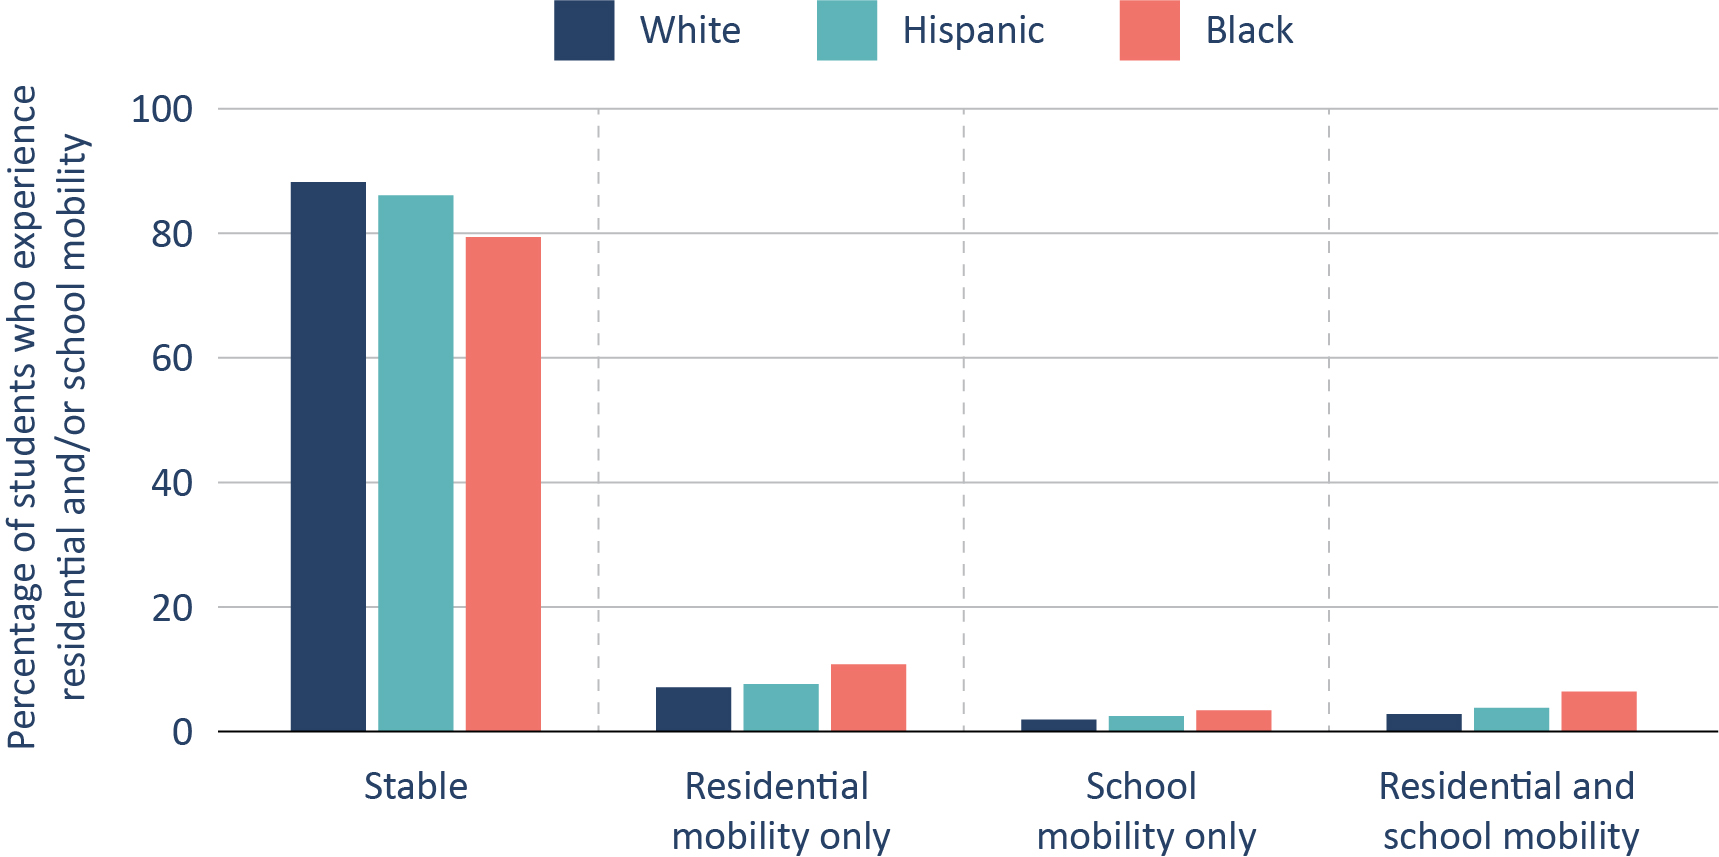
Figure 5. In general, low-income students are more mobile than high-income students.
FINDING 3: RESIDENTIALLY MOBILE STUDENTS IN CHARTER SCHOOLS ARE LESS LIKELY TO CHANGE SCHOOLS THAN THEIR COUNTERPARTS IN TRADITIONAL PUBLIC SCHOOLS.
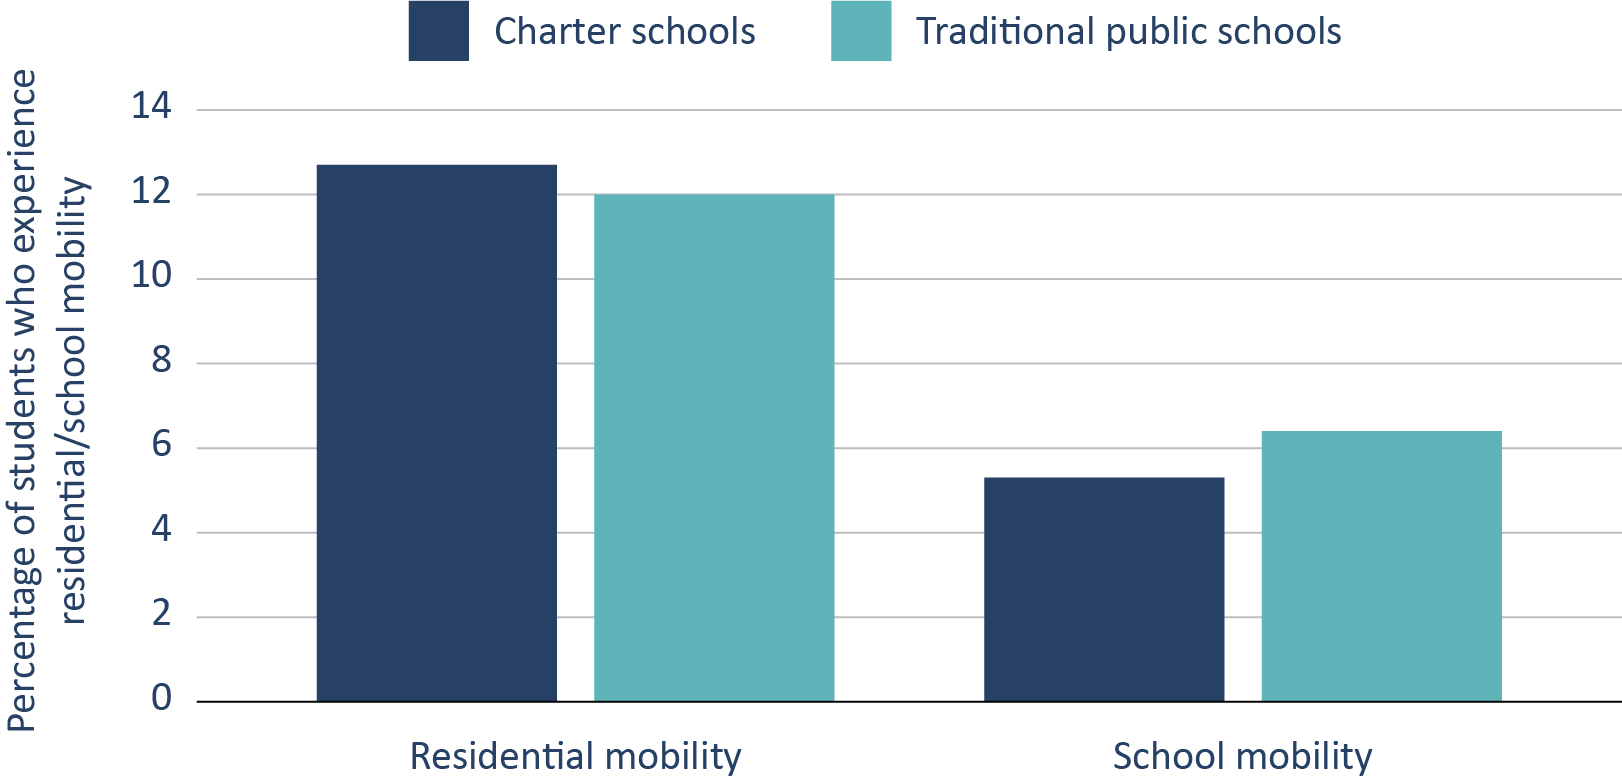
Per Figure 6, despite the fact that students in charter schools have a slightly higher residential mobility rate than students in traditional public schools (12.7 percent vs 12.0 percent), students in charters are somewhat less likely to change schools than students in traditional public schools (5.3 percent versus 6.4 percent). Moreover, residential mobility only is somewhat more common in the charter school population, whereas school mobility only and “compound” mobility are somewhat less common (not shown).
Figure 6. Despite having slightly higher rates of residential mobility, students in charter schools have slightly lower rates of school mobility.
Per Figure 7, these patterns may be explained by the fact that, for charter school students, a residential move is less likely to trigger a school move. Roughly speaking, about one in three residentially mobile students in a traditional public school switches schools, versus about one in four residentially mobile students in a charter school.
Figure 7. Residentially mobile students in charter schools are less likely to change schools than residentially mobile students in traditional public schools.
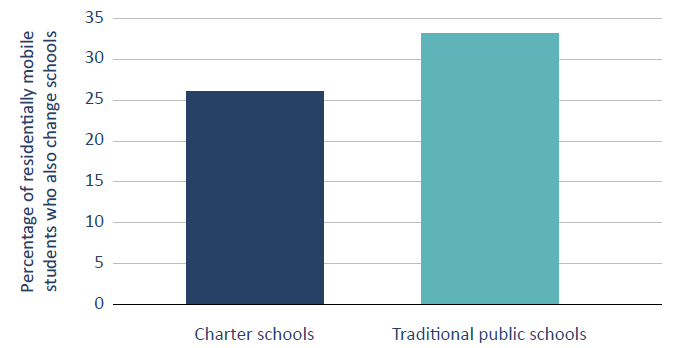
Figure 8 unpacks the relationship between residential and school mobility across the two sectors by plotting the distance of the residential move against the probability of a school move for students initially observed in a charter versus a traditional public school. Per the figure, the slope of the graph for students in traditional public schools is much steeper than the slope of the graph for students in charter schools. In other words, relative to students in traditional public schools, students in charter schools become increasingly less likely to change schools as the distance of the move increases. For example, even at distances of greater than twenty miles, students in charter schools have a less than 40 percent chance of switching schools. Yet for students in traditional public schools, the equivalent figure is at least 80 percent.
Because students who make longer residential moves are more likely to leave their traditional public school’s catchment zone, this growing divergence between charter and traditional public schools makes sense. After all, most charters don’t have catchment zones, so nothing prevents families who change residences from reenrolling, provided some form of transportation can be arranged.
Figure 8. As the distance of the residential move increases, students in charter schools become less likely to change schools than those in traditional public schools.
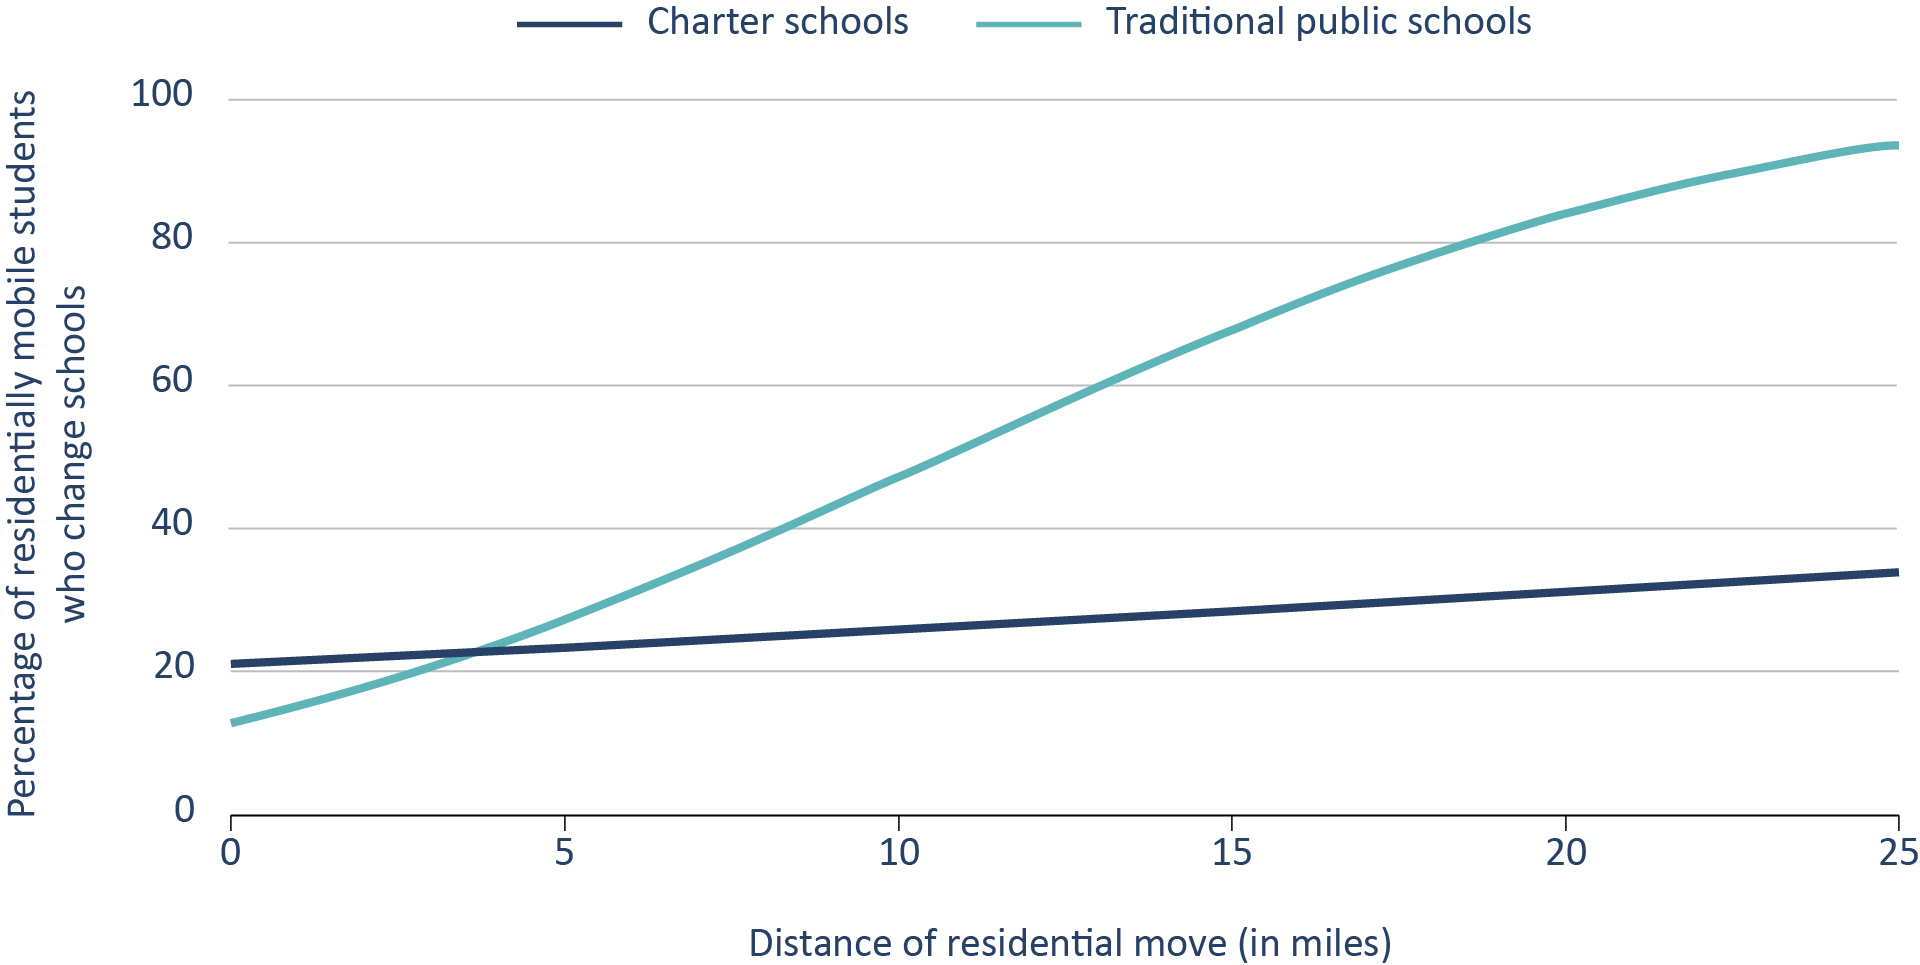
Per the figure, many charter school students seem willing and able to drive long distances to remain enrolled – an intuition that is also supported by other data. For example, on average students in North Carolina charters have longer commutes than students in the state’s traditional public schools (6.6 versus 3.9 miles), with about 22 percent of charter school students in the state crossing traditional school district lines.[16] Yet the figure also shows that for short-distance moves (which are far more common), charter school students are more likely to switch schools than their counterparts in traditional public schools. Although we cannot definitively assess the reasons for this, it is possible that families that enroll their children in charters have a higher tolerance for school mobility and/or a stronger desire to optimize school quality than families that enroll their children in traditional public schools.
FINDING 4: RESIDENTIAL MOBILITY, SCHOOL MOBILITY, AND "COMPOUND MOBILITY" ARE ALL ASSOCIATED WITH A SMALL DECLINE IN MATH ACHIEVEMENT AND A SLIGHT INCREASE IN SUSPENSIONS.
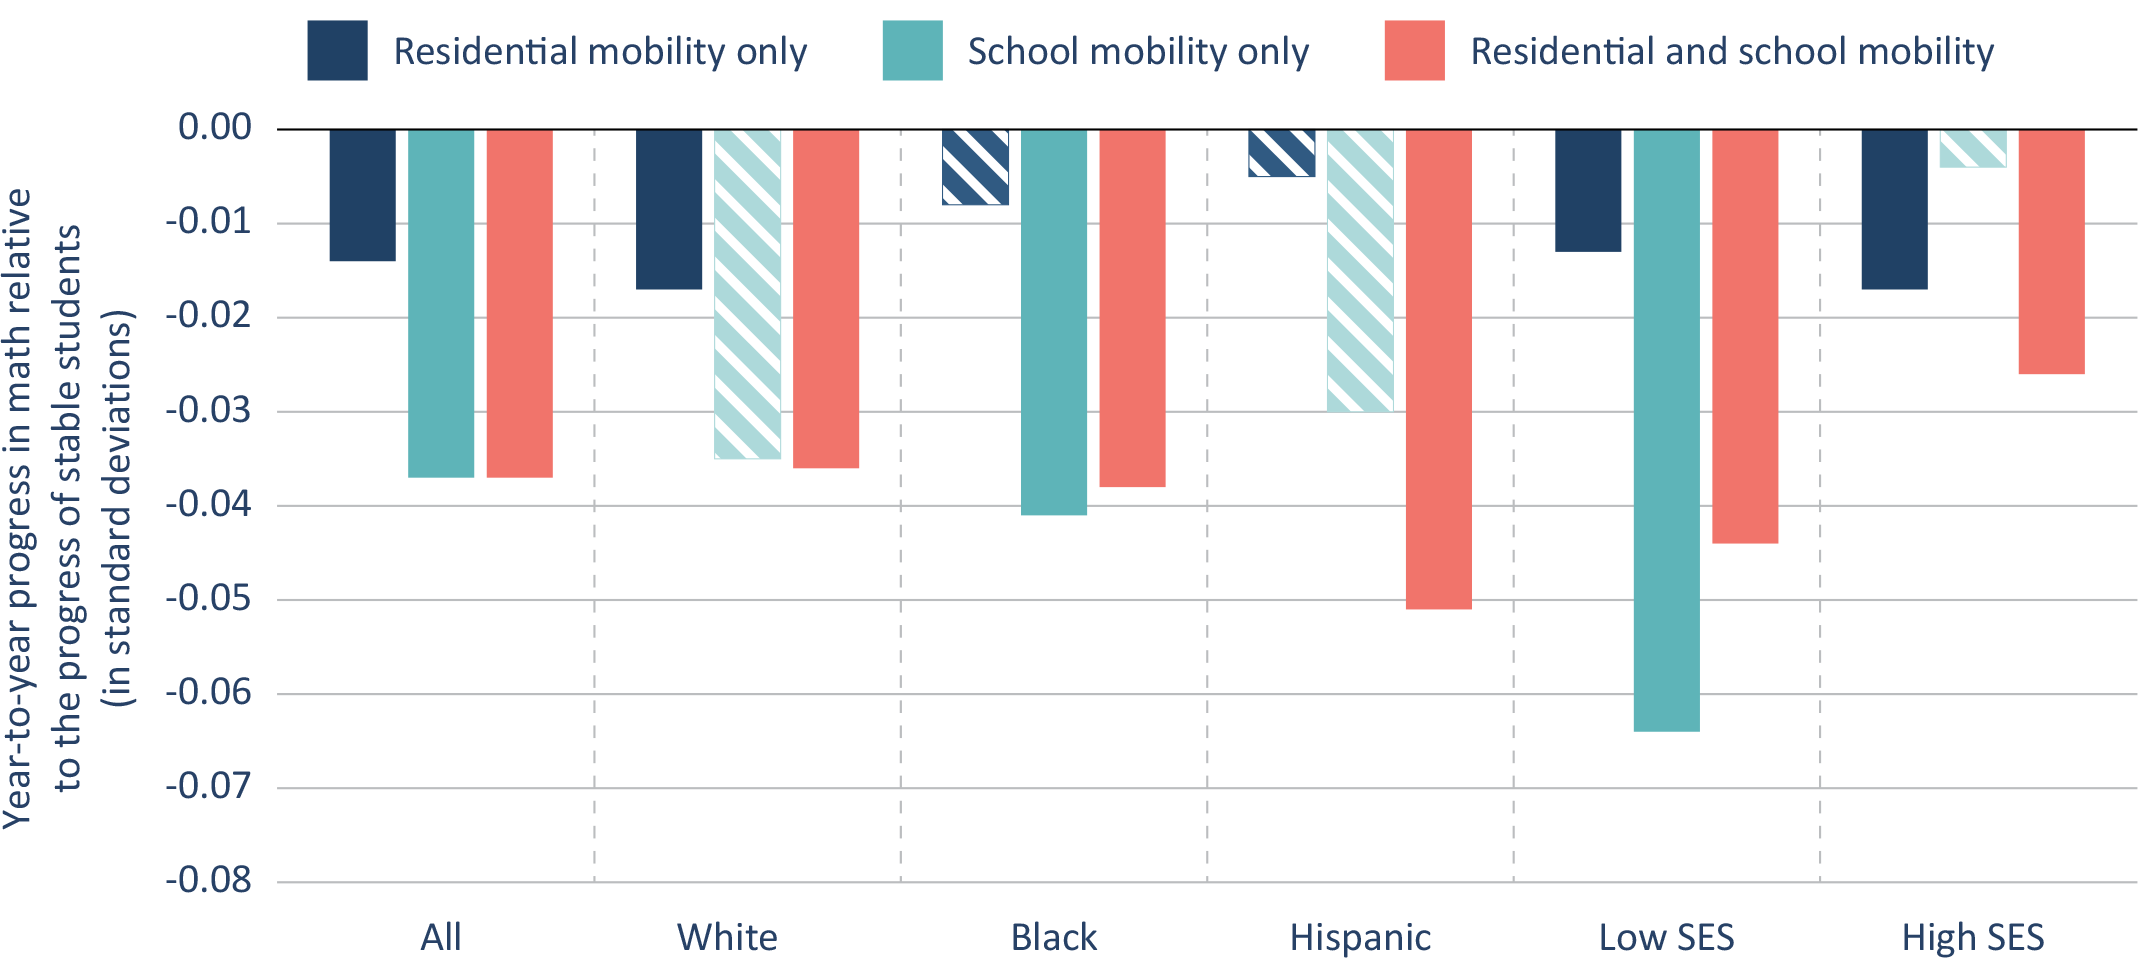
On average and controlling for many of the determinants of mobility, students who experience any form of mobility—residential, school, or compound—make slightly less progress in math the following year (see Figure 9). However, the negative effects of residential mobility are smaller than the effects of school mobility only and of compound mobility.
Figure 9. Compared to stable students, students who move tend to make less progress in math, especially when they change schools.
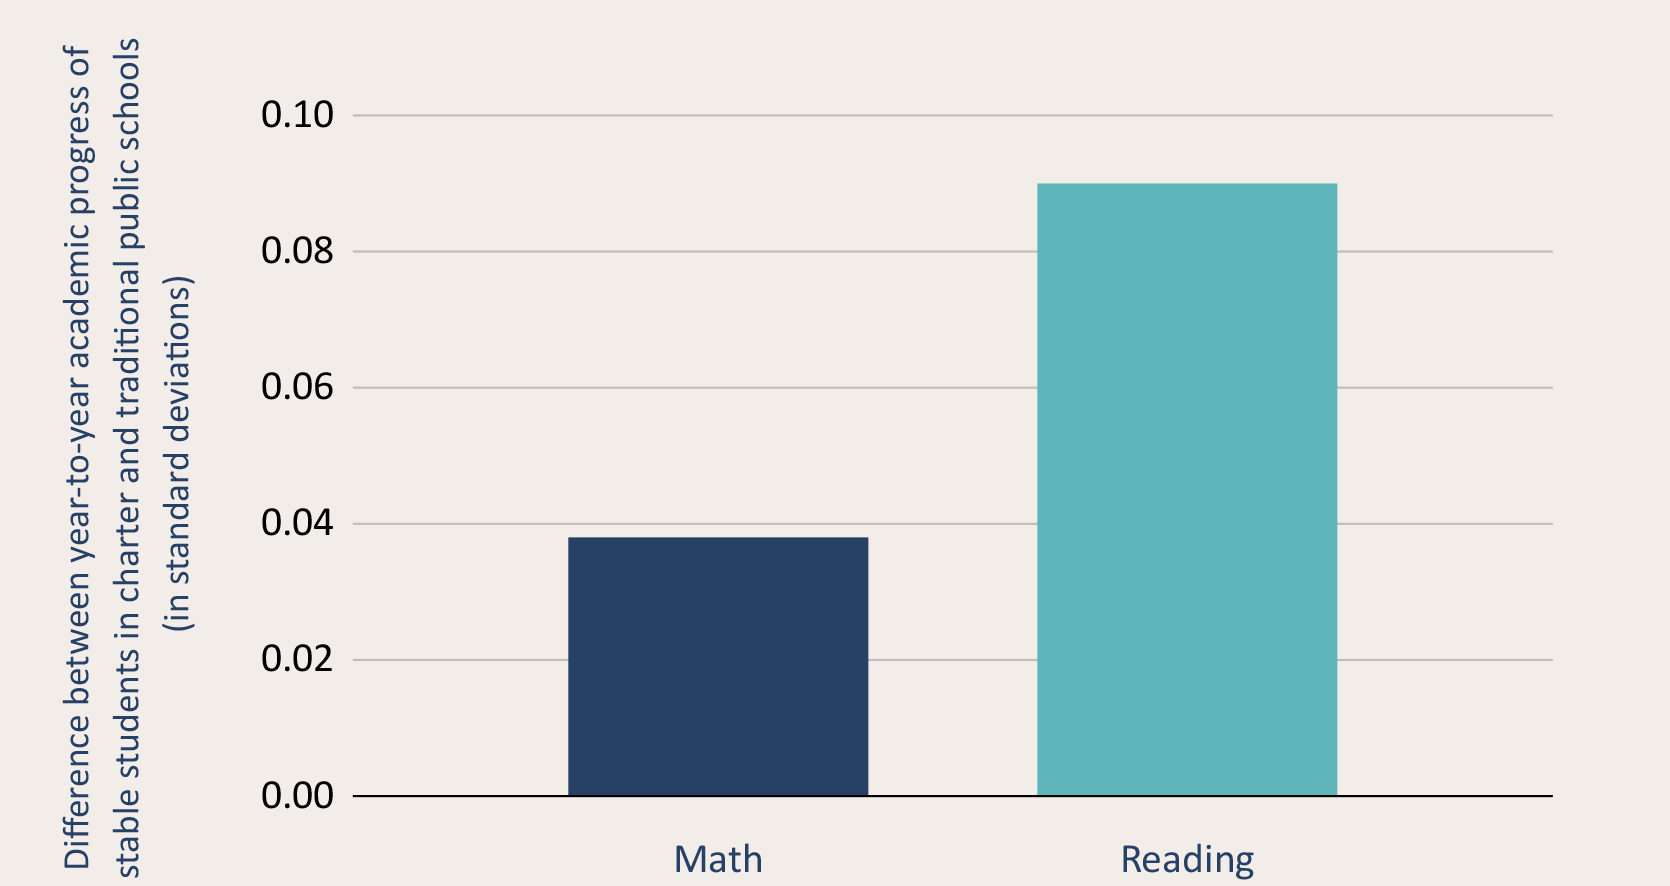
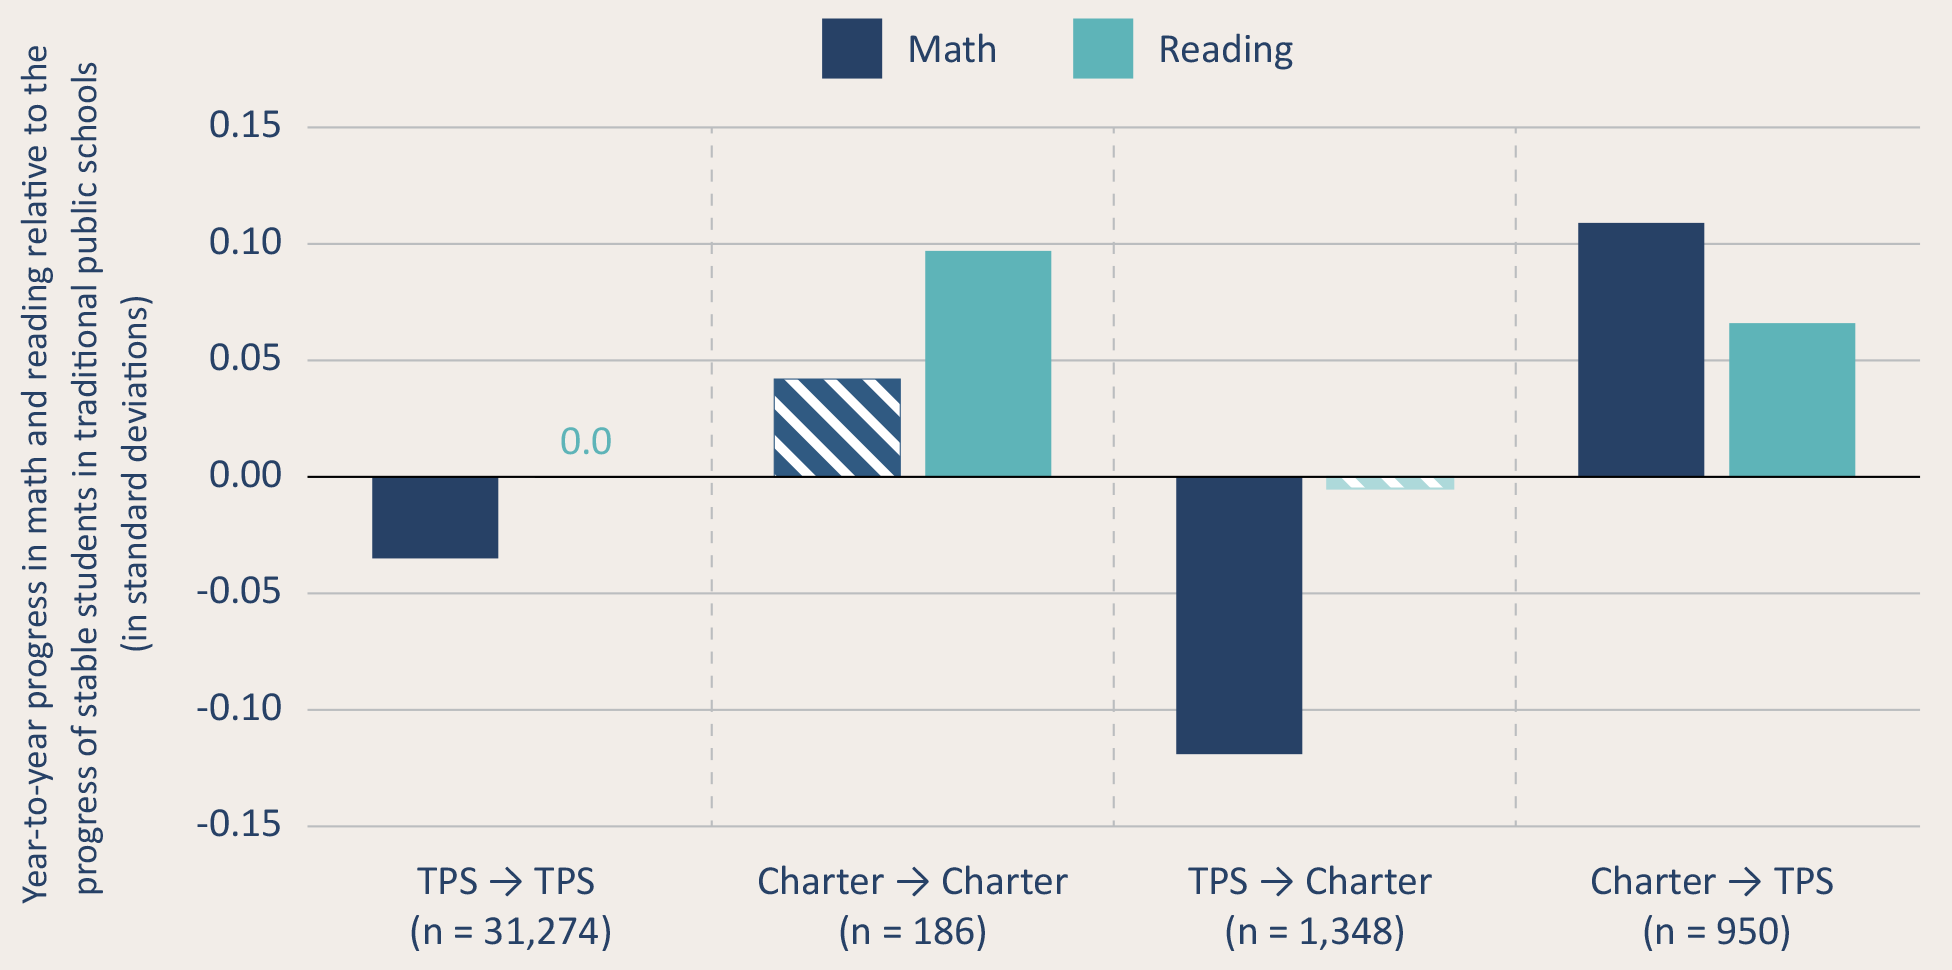
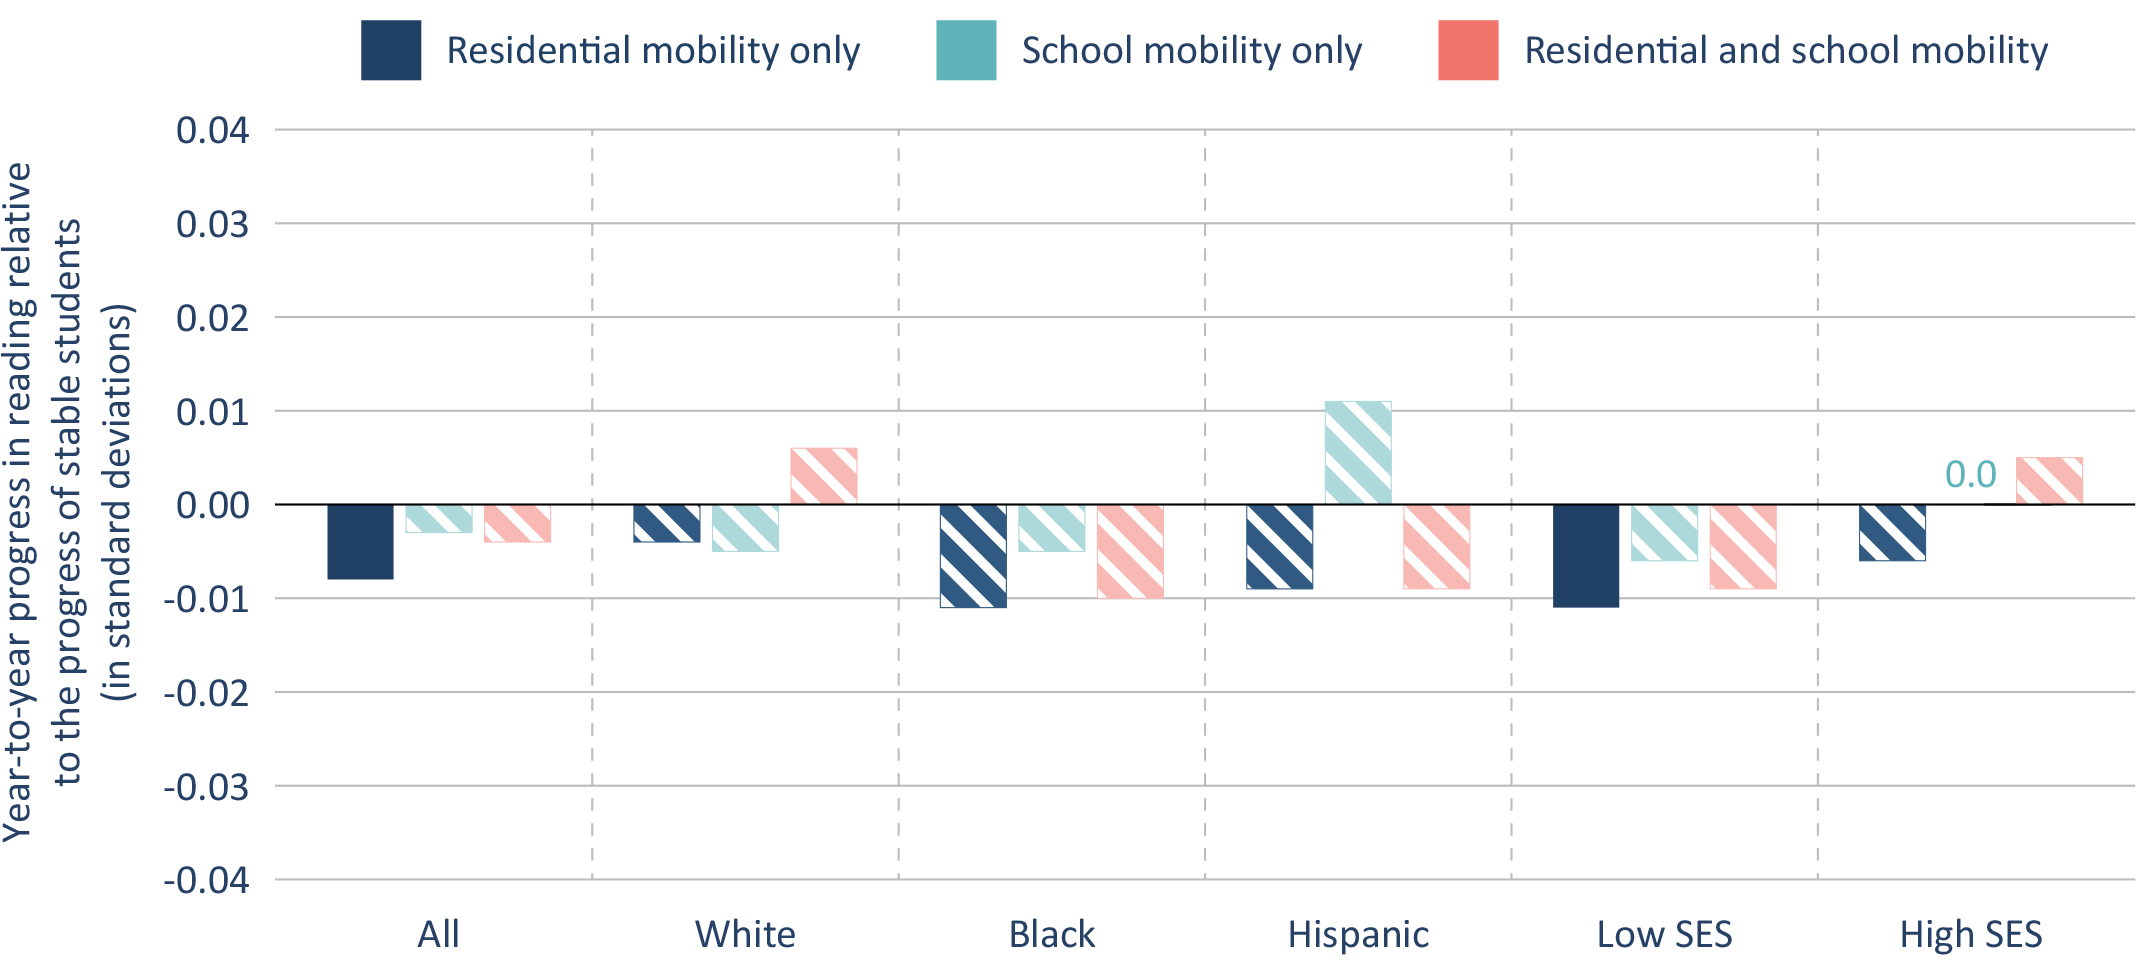
In contrast, there is no significant association between any type of mobility and reading growth for most student groups (see Figure 10), although a small subset of students who switch from charter schools to traditional public schools appears to benefit in reading (see Do the outcomes associated with residential and/or school mobility differ by sector?).
Figure 10. In reading, students who change residences and/or schools perform similarly to stable students.
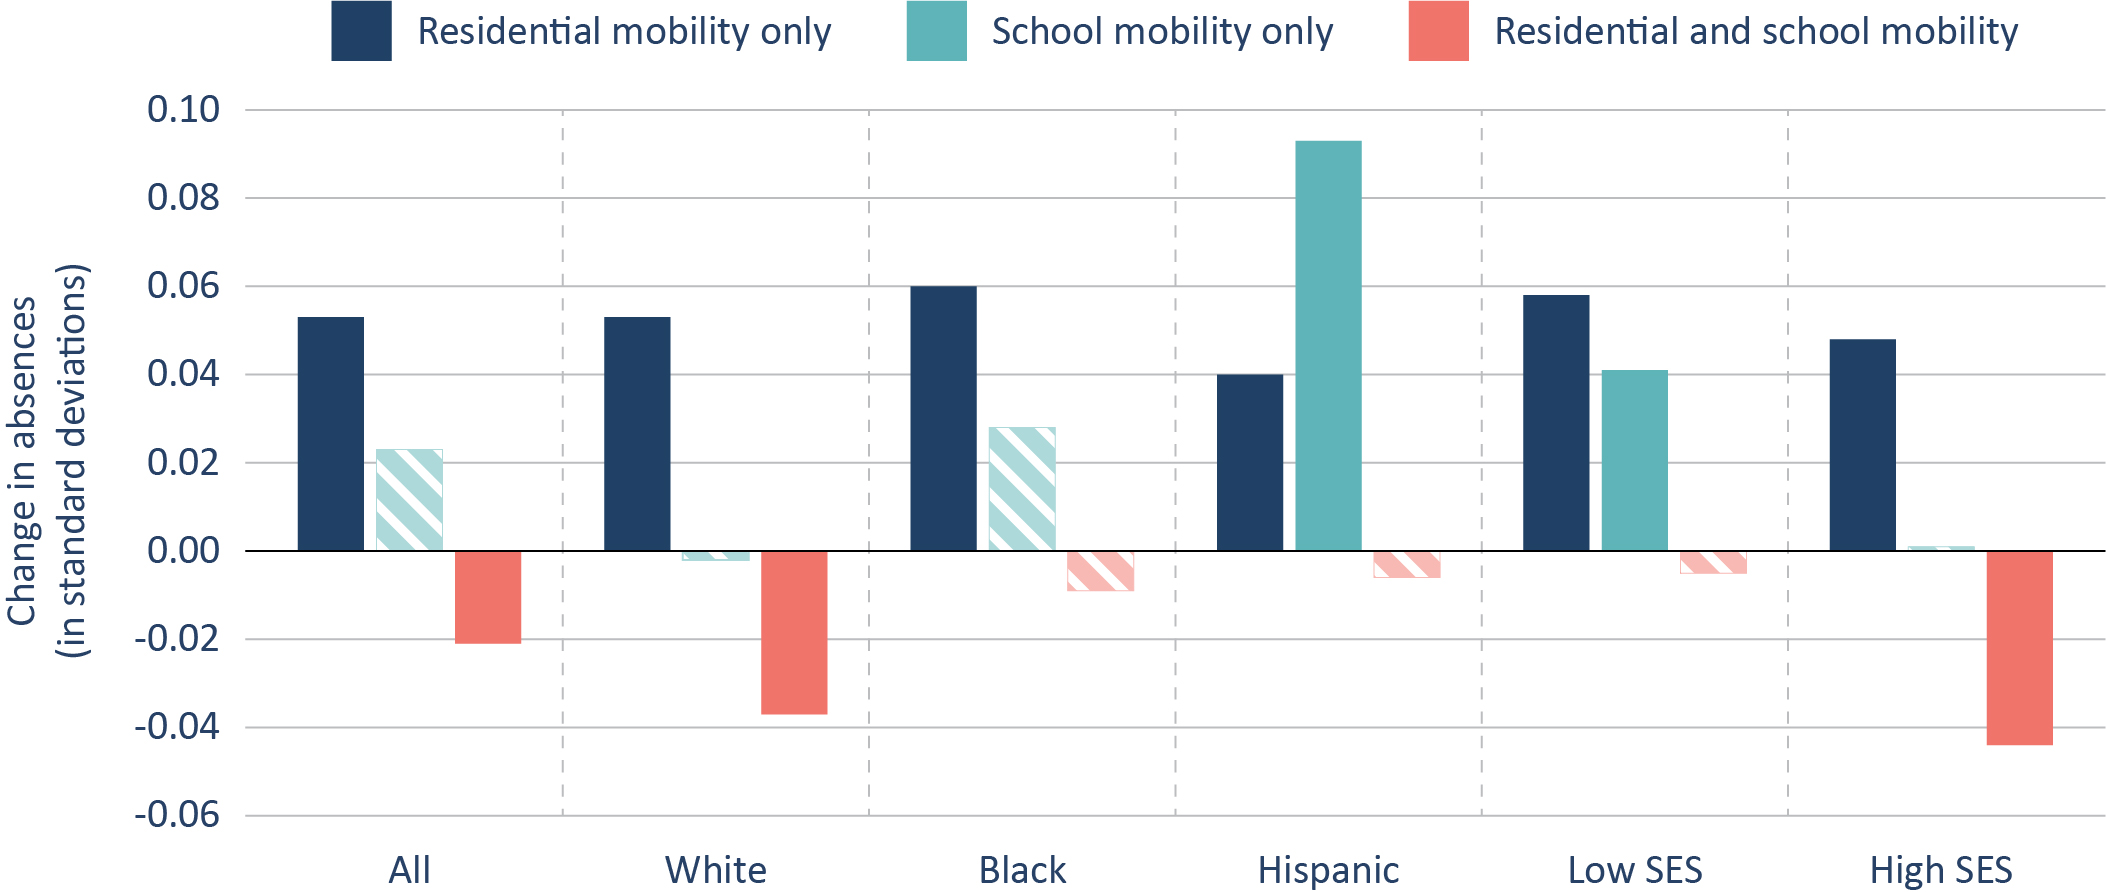
Mobility is also associated with small increases in suspensions and/or absences for some groups in some mobility categories (Figures 13 and 14). More specifically, per Figure 13, residential mobility only is consistently associated with an increase in absences for all students. This may be explained by an increased distance between home and school or moving outside a bus or walk zone. In contrast, school mobility only is associated with increases in absences for Hispanic and low-SES students, and compound mobility (both types concurrently) is associated with a decline in absences for higher-SES students.
Figure 13. On average, students who change residences are slightly more likely to be absent, while those who change schools (or residences and schools) are less likely.
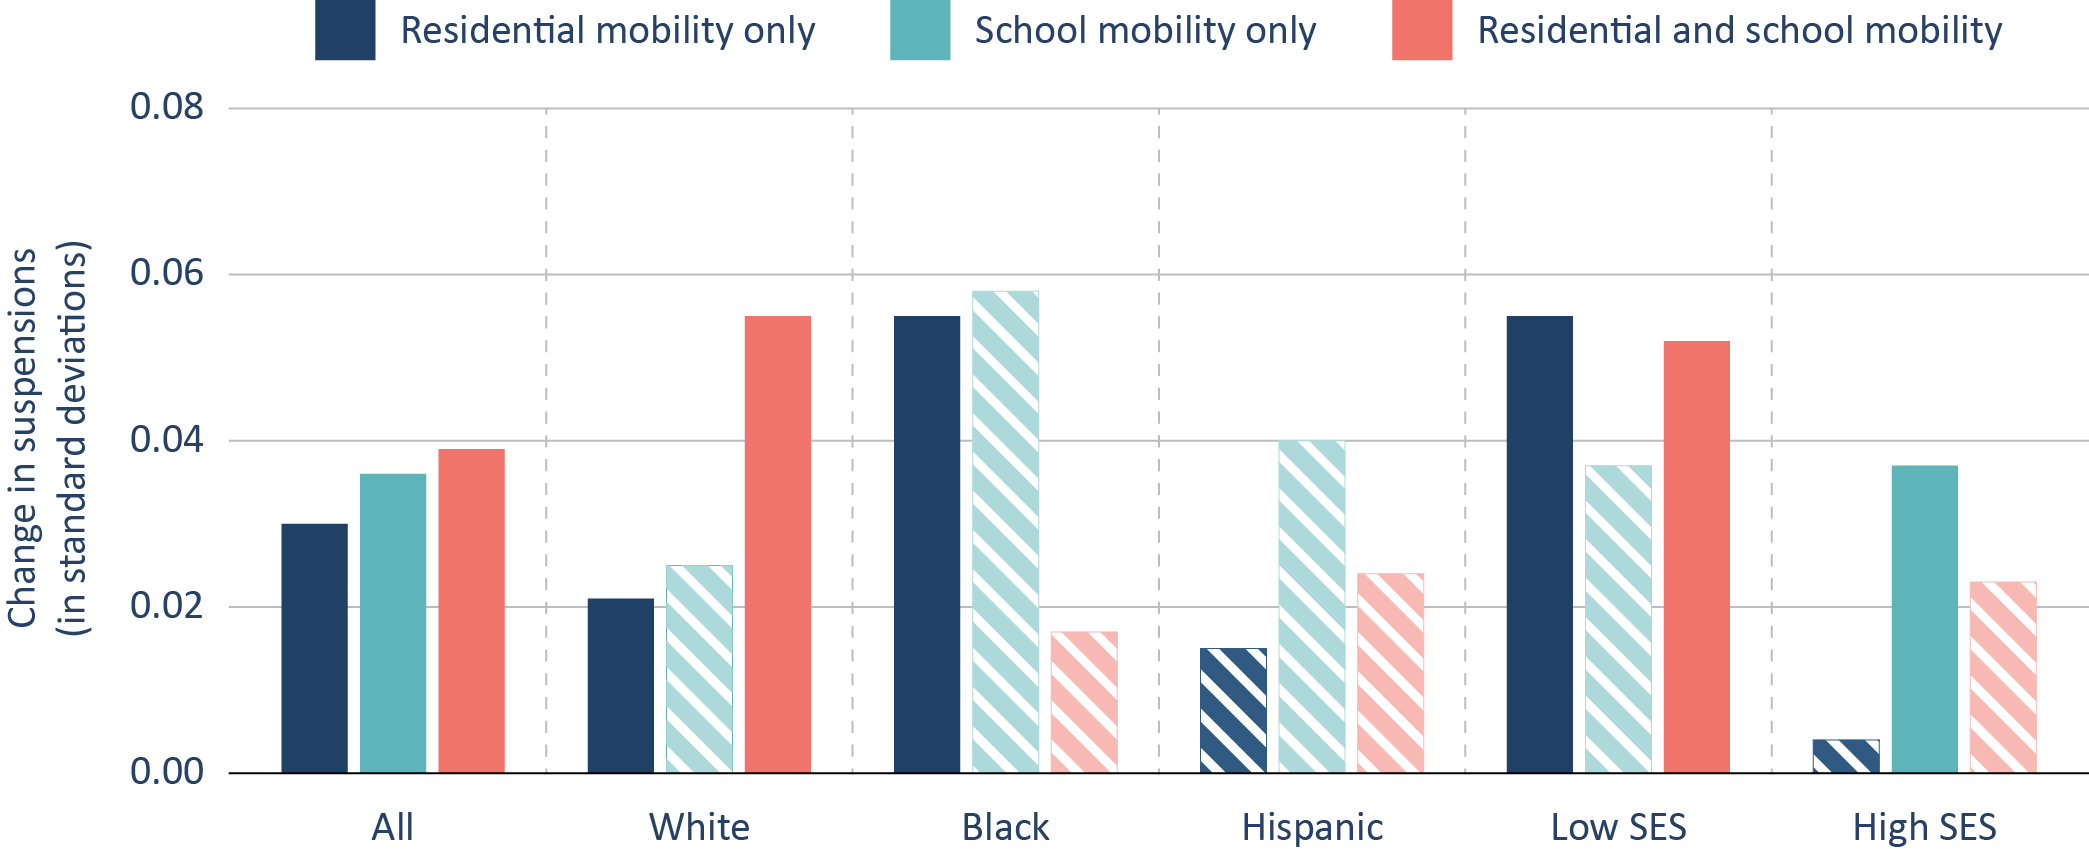
As shown in Figure 14, mobility is associated with some small increases in suspensions, although effects differ by subgroup. Those who only change residences tend to see an increase in suspensions. These effects are strongest for Black and low-SES students. In contrast, moving schools only is not consistently associated with strong effects on suspensions, with the exception of high-SES students. Finally, among students who experience both forms of mobility, White and low-income students tend to see an increase in suspensions, although that is less true for Black and Hispanic students.
Note, however, that the estimates presented in this section only capture the initial experiences of mobile students—that is, their experiences in the year immediately following their move.
Figure 14. On average, students who change residences and/or schools are slightly more likely to be suspended.
Conclusion
Broadly speaking, the results are consistent with the hypothesis outlined in the introduction: Students who change residences are often forced to change schools in an education system that is based on local attendance zones, and students who change schools make slightly less academic progress and are slightly more likely to be absent or suspended. Thus, insofar as it reduces the incidence of involuntary school switching, expanding school choice may hold particular benefits for residentially unstable and/or mobile students.
In short, the right to school choice isn’t just about parents’ and students’ right to leave when conditions are unacceptable. It is also about their right to stay put.
Limitations
Obviously, students are not randomly assigned to new residences or schools. Therefore, despite the fact that we control for observable student characteristics, the results are fundamentally associational.
In addition, the data that are the basis for this report have some limitations. First, students’ home addresses have no dates or time ordering other than the year in which they appear. Consequently, we cannot measure departure and destination addresses within a school year and cannot definitively match student addresses with other within-year data (e.g., absences and suspensions). Furthermore, we only have three years of address data, so a four-year outcome such as high school graduation is out of bounds (as are long-run effects on test scores). Finally, we do not have access to school catchment area shape files to determine which traditional public school a student is assigned or the distance from the student’s address to their assigned school.
Technical Appendix
We use the following abbreviations for the study’s key student-level variables:
- RM – residential mobility indicator
- 1 if moved residences at least once between school years, 0 otherwise
- SM – school mobility indicator
- 1 if moved schools at least once between school years, 0 otherwise
- CH – charter indicator
- 1 if attended a charter in the current year, 0 otherwise
- Y – a student end-of-year outcome (test score, absences, GPA, suspensions, etc.)
- these will be either continuous or binary
- X’ – student level control vector
- includes lagged test scores, absences, and suspensions
- therefore, in equations with outcomes and lags of the same outcomes, we will be measuring adjusted growth models
- θn
- neighborhood fixed effects
For the findings reported in Section 2, the effects of mobility on gains in outcomes, we regressed study outcomes (e.g., test scores, absences, grades, etc.) on a multinomial mobility variable that is coded as stable (baseline category), RM only, SM only, or RM and SM. Our linear model predicting a continuous outcome for student i in tract n at time t, we estimated
 (1)
(1)
This model decomposes the unique effects of SM and RM and of compound mobility (experiencing both SM and RM). It includes control variables, including lags, and census tract fixed effects, so the results can be interpreted as adjusted gains of the outcome with comparisons restricted to students within the same census tracts.
To further understand the relationship between mobility and student outcomes for charter students relative to TPS students, we estimate the following model with the three types of mobility variables and their associated interaction terms:
 (2)
(2)
This model permits examination of charter versus TPS differences in the effects of stability and mobility. We cluster correct all standard errors to adjust for the nonindependence of observations within schools.
Measurement of neighborhood SES
There are many concerns about using free and reduced-price lunch as a proxy for socio-economic status (SES). Among them is that it only measures whether a family has low income; it does not capture the full range of income, and it does not capture other relevant factors related to educational success such as parental education. Another is that charter schools are not required by the state of North Carolina to participate in the federal school lunch program, which makes consistent measurement across traditional public schools and charters impossible on the basis of program participation.
Our neighborhood SES measure is a proxy for family SES in the sense that it is linked to the child’s home address’s census tract via his/her home address. It consists of median earnings, unemployment rate, poverty rate, college-educated percentage, and percent single-headed household, all measured as part of the 2010 census. These components were standardized and averaged to create a tract SES scale (alpha = .87). If free/reduced-price lunch (FRL) was a valid measure of SES, we would expect the correlation of track level percentage of FRL and average SES to be similar for the TPS and charter populations. This is not the case. Among charter students, the correlation is -.46, and for TPS students it is much stronger at -.76. This disparity indicates possible weakness in the measurement of family income by charter schools.
ENDNOTES
[1] Chad Mills, “After months of debate, Hillsborough County School Board votes to change district boundaries.” ABC Action News: WFTS Tampa Bay, last modified June 20, 2023. https://www.abcactionnews.com/news/region-hillsborough/after-months-of-debate-hillsborough-county-school-board-votes-to-change-district-boundaries.
[2] Alia Wong, “Using a different address for school placement can be a crime. Is school choice a solution?” USA Today: Education, last modified August 8, 2023. https://www.usatoday.com/story/news/education/2023/08/08/address-sharing-school-placement-can-be-crime/70515010007/.
[3] Amanda Gomez and Kaela Roeder, “Schools can get funds to help homeless students. Why do so many miss out?” The Center for Public Integrity: Unhoused and Undercounted, last modified December 6, 2022. https://publicintegrity.org/education/unhoused-and-undercounted/washington-dc-schools-funds-homeless-students-miss-out/ https://www.chalkbeat.org/philadelphia/2023/8/29/23844399/pennsylvania-homeless-students-schools-disenrolled/.
[4] Brett Theodos, Sara McTarnaghan, and Claudia Coulton, "Family Residential Instability." Urban Institute, Last modified May 2018. https://www.urban.org/sites/default/files/publication/98286/family_residential_instability_what_can_states_and_localities_do_1.pdf.
[5] Graetz, et. al. “A comprehensive demographic profile of the US evicted population,” Proceedings of the National Academy of Sciences 120, no. 41 (October 2023). https://www.pnas.org/doi/10.1073/pnas.2305860120.
[6] Corey Mitchell and Amy DiPierro, “Officials: Federal government must do better for homeless students.” The Center for Public Integrity: Unhoused and Undercounted, last modified December 14, 2022. https://publicintegrity.org/education/unhoused-and-undercounted/government-helping-homeless-students-mckinney-vento-funding/.
[7] Caleigh Kelly, “Post-pandemic surge in evictions spotlights unequal housing crisis.” The Hill, last modified July 4, 2023. https://thehill.com/business/housing/4076132-post-pandemic-surge-evictions-housing-crisis/.
[8] Housing Security in NYC: What the Most Recent Census Data Tells Us” Citizens’ Committee for Children of New York, last modified November 17, 2022. https://cccnewyork.org/data-publications/housing-security-in-nyc-2021/.
[9] Riordan Frost, “Are Americans Stuck in Place? Declining Residential Mobility in the U.S.” (research brief, Joint Center for Housing Studies of Harvard Unviersity, Cambridge, MA, May 2020), https://www.jchs.harvard.edu/research-areas/research-briefs/are-americans-stuck-place-declining-residential-mobility-us.
[10] Brett Theodos, Sara McTarnaghan, and Claudia Coulton, “Family Residential Instability” (policy brief, Metropolitan Housing and Communities Policy Center, Urban Institute, Washington, D.C., May 2018), https://www.urban.org/sites/default/files/publication/98286/family_residential_instability_what_can_states_and_localities_do_1.pdf.
[11] Adam Voight, Marybeth Shinn, and Maury Nation, “The Longitudinal Effects of Residential Mobility on the Academic Achievement of Urban Elementary and Middle School Students,” Educational Researcher 41, no. 9 (December 2012): 385–92, https://doi.org/10.3102/0013189X12442239; Jimmy Scherrer, “The Negative Effects of Student Mobility: Mobility as a Predictor, Mobility as a Mediator,” International Journal of Education Policy and Leadership 8, no. 1 (2013): 1–15, https://doi.org/10.22230/ijepl.2013v8n1a400; Majida Mehana and Arthur J. Reynolds, “School mobility and achievement: a meta-analysis,” Children and Youth Services Review 26, no. 1 (January 2004): 93–119, https://doi.org/10.1016/j.childyouth.2003.11.004; Joseph Gasper, Stefanie DeLuca, and Angela Estacion, “Switching Schools: Revisiting the Relationship between School Mobility and High School Dropout,” American Educational Research Journal 49, no. 3 (2012): 487–519, https://doi.org/10.3102/0002831211415250.
[12] Brett Theodos, Claudia Coulton, and Amos Budde, “Getting to better performing schools: The role of residential mobility in school attainment in low-income neighborhoods,” Cityscape 16, no. 1 (2014): 61–84, https://www.jstor.org/stable/26326858; Sarah A. Cordes, Amy Ellen Schwartz, Leanna Stiefel, and Jeffrey Zabel, “Is neighborhood destiny? Exploring the link between neighborhood mobility and student outcomes,” Urban Studies 53, no. 2 (2016): 400–17, https://www.jstor.org/stable/26146255.
[13] Ibid.
[14] Gasper, DeLuca, and Estacion, “Switching Schools.”
[15] Allison Gilmour, Colin Shanks, and Marcus A. Winters, “Effect of Charter Schooling on Student Mobility and Classification Status” (policy brief, Wheelock Educational Policy Center, Boston University Wheelock College of Education and Human Development, Boston, MA, 2021), https://wheelockpolicycenter.org/wp-content/uploads/2021/05/CharterEffectOnMobility_PolicyBrief.pdf; Marcus A. Winters, Grant Clayton, and Dick M. Carpenter II, “Are low-performing students more likely to exit charter schools? Evidence from New York City and Denver, Colorado,” Economics of Education Review 56 (2017): 110–17, https://doi.org/10.1016/j.econedurev.2016.12.002; Marcus A. Winters, “Understanding the Gap in Special Education Enrollments Between Charter and Traditional Public Schools: Evidence From Denver, Colorado,” Educational Researcher 44, no. 4 (2015): 228–36, https://doi.org/10.3102/0013189X15584772; Luke Dauter and Bruce Fuller, “How Diverse Schools Affect Student Mobility: Charter, Magnet, and Newly Built Institutions in Los Angeles” (working paper, Los Angeles School Infrastructure Project, Policy Analysis for California Education, Stanford, CA, July 2011), https://edpolicyinca.org/sites/default/files/2011_WP_PACE_DAUTER_FULLER.pdf.
[16] Kyle Abbott, Eric Houck, and Douglas Lee Lauen, “Out of Bounds: The Implications of Non-Resident Charter Attendees for North Carolina,” (forthcoming).
[17] “As a Matter of Fact: National Charter School Study III,” Figure 1.19 (CREDO, 2023).
About this study
This report reflects the contributions of many individuals, starting with Professor Lauen (without whom it would not exist). In addition to Dr. Lauen, we are grateful to professors Sean Corcoran and Ron Zimmer for their technical review of early drafts, and to Pamela Tatz for copyediting. On the Fordham side, we extend our thanks to Chester E. Finn, Jr., Michael Petrilli, and Amber Northern for reviewing drafts, to David Griffith for managing the project, to Stephanie Distler for overseeing report production and design, and to Victoria McDougald for handling media dissemination.
Access to the confidential administrative data was permitted through a data access agreement with the North Carolina Department of Public Instruction (NCDPI) and facilitated by the Education Policy Initiative at Carolina. Dr. Lauen would like to thank Ashley Baquero of the NCDPI Office of Charter Schools and Assistant State Superintendent Andrew Smith for their support of this work and their advice throughout this project, Kyle Abbott and Elizabeth Brown for excellent research assistance, and Philip McDaniel for GIS advice.
Funding for this report comes from the Walton Family Foundation, The Louis Calder Foundation, and our sister organization, the Thomas B. Fordham Foundation.
Although it’s a brand-new year, many Ohio students are still caught in the education riptide of the pandemic era. Achievement in reading and math has improved from the horrific lows of 2020–21, but students remain behind. In math, for example, just 53 percent of students met grade-level proficiency standards last year, down from 61 percent in 2018–19. Achievement gaps remain unacceptably wide, and chronic absenteeism is pervasive. To turn the tide, schools and students need all hands on deck. But many of the most important hands—those that belong to parents and families—may not fully realize the challenges facing their children.
Consider a 2023 report published by Learning Heroes, a nonprofit group that seeks to equip parents to support their child’s education. They found that nearly nine in ten parents nationwide believe their children are performing at or above grade level in reading and math, even though less than half are actually performing at grade level. This disconnect is largely a result of parents relying on report card grades as their primary source of information. The vast majority say that their kids are earning mostly A’s or B’s, and “understandably equate a good grade with grade-level achievement.”
But report cards measure much more than just achievement—things like class participation or group work might factor in, too—and grade inflation is rampant. As a result, they note, “relying on report cards in isolation could prevent parents from initiating crucial interventions.” Without a complete picture of student progress, it’s impossible for families to hold schools accountable for serving their children well or know when it’s time to make a change.
Fortunately, last year’s landmark state budget, House Bill 33, included two important provisions that could help Ohio parents get a better handle on their child’s achievement and empower them to make decisions accordingly. Both provisions must be implemented by districts beginning this year. Given that the state’s testing windows begin as early as March 25, state and district officials are hopefully already discussing how to implement these changes (and if they’re not, they should be). With that in mind, let’s take a closer look at each.
Faster delivery of a child’s state test scores to parents
After students complete state exams, the Department of Education and Workforce (DEW) assembles test score reports that offer detailed information about how students performed in reading, math, and other subjects compared to state standards. DEW sends these reports to districts, which then distribute them to parents.
The vast majority of students finish testing by early May. Ideally, families would receive their score reports within a month or so—not just for the sake of an efficient and timely turnaround, but also because score reports can help parents decide when to get struggling students extra help (like tutoring over the summer) or when to make an even bigger change (like switching schools in the fall). Unfortunately, Ohio families haven’t historically been guaranteed a quick turnaround for state test results. Most have waited months to receive their child’s score report, leaving them little to no time to take advantage of the summer months or plan for the fall.
Thanks to HB 33, that’s about to change. Beginning this year, public and private schools will be required to provide score reports to families by June 30. This new deadline could require a great deal of administrative work for districts, especially those that have historically distributed reports via the postal service or students’ backpacks when they return in the fall, rather than through the more efficient means of email or a secure online portal (districts and schools have discretion in how test scores are reported to parents). It will also require the state to move more quickly, and to ensure that tests are still scored accurately despite the tighter turnaround. Both will be tall tasks. But when it comes to ensuring that parents have up-to-date and accurate data so they can make informed decisions, timeliness is necessary.
Intervention and parental engagement for struggling readers beyond third grade
Since 2012, Ohio’s Third Grade Reading Guarantee has required schools to administer diagnostic reading assessments to students in grades K–3, identify those who are off track, notify their parents, and create improvement plans. The original version of the Guarantee also required schools to retain students who, based on state assessments or state-approved alternative exams, didn’t meet reading standards by the end of third grade. Schools were required to provide these retained students with intensive reading interventions, such as summer school or tutoring.
Last year, after much complaining from school groups and despite strong evidence that it benefits students, lawmakers functionally ditched the retention requirement. Going forward, schools will be able to promote a student to fourth grade regardless of their reading level if their parent or guardian requests promotion after consulting with the student’s reading teacher and building principal.
In a perfect world, parents of children who do not meet third grade reading standards would receive all the information they need to make an informed decision between retention and promotion. That includes an accurate debrief on the extensive research demonstrating that retention benefits struggling readers, acknowledgment that social promotion might harm them in the long run, and a clear and specific outline of how the district plans to provide intensive intervention. However, given that the driving force behind eliminating retention was largely district administrators and teachers unions, the reality is that most consultations will result in a recommendation for parents to request promotion.
When that happens, districts will be off the hook for retention. But they won’t be off the hook for updating parents about their child’s progress and providing intensive intervention until the student reads at grade level. Under the previous policy, districts only had to provide intensive reading intervention for as long as a student was retained, which couldn’t be more than two years. Now, they’ll be responsible for providing intervention for as long as it takes for students to meet grade-level standards—even if that doesn’t happen until middle or high school—and keeping parents informed of their progress. This should give families additional opportunities not only to obtain accurate information from schools, but to hold them accountable for catching their kids up.
***
In schools across the state, thousands of students are still struggling to break free from the academic undertow of the pandemic. To help them catch up, educators and families will have to work together. But that’s only possible if parents have accurate, timely, and honest information about student progress and achievement. A quicker turnaround on state score reports and a new opportunity for parents to hold their local school accountable for their child’s progress are steps in the right direction.
News stories featured in Gadfly Bites may require a paid subscription to read in full. Just sayin’.
- Another quiet day for the Bites. St. Mary Catholic School in the German Village neighborhood of Columbus is showing off its new expansion and renovation to the Dispatch a little bit ahead of the official unveiling next week. It looks fantastic, sounds even better, and augurs a huge turnaround for the school which was losing students and eyeing closure less than a decade ago. They have added capacity and look ready and able to accept lots of new students. Why yes, they do accept EdChoice Scholarships. Why do you ask? (Columbus Dispatch, 1/22/24)
- Not that anyone’s keeping score just yet, but you can count the editorial board of Vindy.com among the early non-supporters of a legislative proposal to pay Ohio students to attend school. (Vindy.com, 1/22/24)
Did you know you can have every edition of Gadfly Bites sent directly to your Inbox? Subscribe by clicking here.
Stories featured in Ohio Charter News Weekly may require a paid subscription to read in full.
On the grow in Toledo
“We have had an enrollment increase year after year over a five-year period. We anticipate our enrollment will continue to grow.” So says Northwest Ohio Classical Academy governing board member Stephen Koralewski, discussing the school’s recently-completed expansion project. And he’s not kidding: Enrollment has more than doubled since the Toledo charter opened in 2019, adding students and grade levels each year. It is anticipated that more than 600 students will attend next year, with the new classrooms, dining commons, science labs, and outdoor courtyard likely being as big a draw as their humanities and liberal arts-focused curriculum. Kudos!
High degrees of excellence
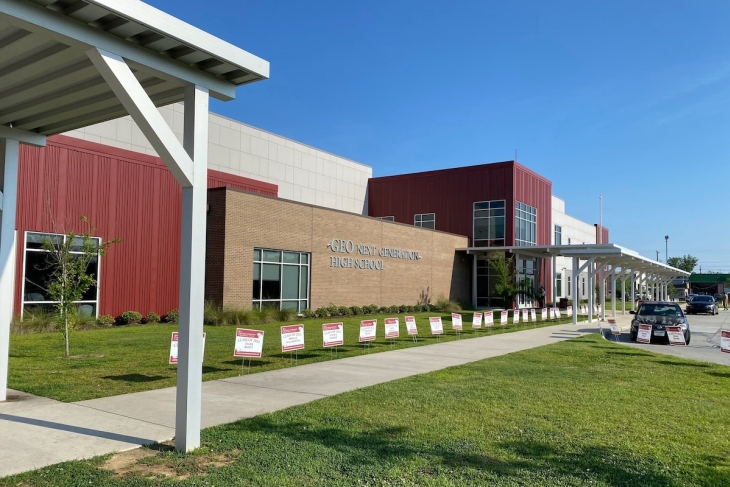
Indiana Governor Eric Holcomb last week honored high schoolers Abram Lewis and Khaya Njumbe, who are both about to earn their bachelor’s degrees even before they finish high school. The two young men are students at GEO Academy’s 21st Century Charter School in Gary, Indiana. The charter network is laser-focused on helping to get its young students ready for college work and setting them on a path to earn credits and, yes, a degree if possible as soon as they are ready. You can read more about these dedicated students and all the adults supporting them toward excellence in this interview with GEO CEO Kevin Teasley.
National School Choice Week
Just in case you didn’t know, National School Choice Week 2024 is next week! States from North Carolina to Wyoming and everywhere in between are ready to celebrate parental choice in education. Hope you are too!
Parents say…
The National School Choice Week organization also released the results of a new parent survey ahead of the celebrations. Among the headline findings: 72 percent of parents surveyed considered new schools for their children in 2023, compared to 52 percent in 2022; 64 percent of parents say they wish they had more information about education options; and just 29 percent say that the same school type works well for all of the children in their home. Check out the full survey for all the details.
The view from Chicago
The Chicago Board of Education recently adopted a platform that aims to discourage, limit, and even possibly end school choice in the city. What this plan means in reality is not yet clear, but parents who have relied on charter, private, and other options are already pushing back. Definitely a story to keep an eye on.
NAPCS conference news
The National Charter Schools Conference will be held in Boston from June 30 to July 3, 2024. It is hailed as the largest national gathering of educators, advocates, and leaders in the charter community. Early bird registration ends February 19. NAPCS is looking for breakout session presenters during the conference who are willing to share insights, tactics, resources, methodologies, and success stories. Those interested in presenting can find more information and the link to submit a proposal here.
*****
Did you know you can have every edition of the Ohio Charter News Weekly sent directly to your Inbox? Subscribe by clicking here.
News stories featured in Gadfly Bites may require a paid subscription to read in full. Just sayin’.
- Not much to cover on this snowy day, but what we do have is worth digging into in some depth. It concerns the 2024 priorities of the elected school board of Parma City Schools. The district, we’re told, comprises three communities: Parma, Parma Heights, and Seven Hills. The latter community has apparently been sparsely represented on the board over time, despite being home to the “most affluent” residents and the most expensive houses in the district. (Read, provides more local tax dollars to the schools.) That historical situation is termed both “paradoxical” and “ironic” here; but whatever it is, it changes now since both the president and vice president of the 2024 board are from Seven Hills for the first time. I have no idea what changes may come, but it should be interesting to follow. The possibilities are intriguing. Another interesting note: My long-suffering Bites subscribers (really, the 8 of you only have yourselves to blame for this after all these years) will recall that I expressed concern last week when Parma’s superintendent touted his new parent liaison position for resident families who chose charters and private schools. I feared that it was a thinly veiled attempt to try and entice those families away from their choices and into the district. Surely it would be easier for them to “get assistance” if they were in the fold officially. Well, in this piece we learn that the elected vice president of the board—a Seven Hills resident in her first term—has three children that attend private school. Whole lotta irony there, I reckon. Perhaps this means that the whole plan to “provide help for choice families” is actually real. Or, at a minimum, if supe does have some idea of converting choice families, I feel that he’s going to have to start with his board VP. (Cleveland.com, 1/17/24)
Did you know you can have every edition of Gadfly Bites sent directly to your Inbox? Subscribe by clicking here.
Khaya Njumbe enrolled at GEO Academies’ 21st Century Charter School, in Gary, Indiana, when he was eleven years old. By age thirteen, he’d become the youngest student in state history to earn an associate degree. By the time he graduates this May, at age fifteen, he will have earned a bachelor’s degree from Indiana University Northwest, and will soon enroll in medical school.
Abram Lewis, who attends the same school, was accepted to Purdue Northwest’s bachelor’s degree track at age sixteen, the youngest student to ever do so. He will also earn a bachelor’s degree by the time he graduates in May.
These are just two of the most recent success stories to come out of the GEO Academies network of eight schools operating in grades kindergarten through twelve in Indiana and Louisiana. Founded a quarter century ago, they focus on preparing traditionally underserved students for college-level coursework—a laudable and important goal in a country plagued by large race- and income-based college-success gaps. One of the noteworthy ways the network does this is by putting high school students on real college campuses and supporting their success there—demonstrating to these young people that they’re absolutely capable of earning a degree. This differs from many dual-enrollment programs that merely give students access to college-level coursework that’s taught by a high school teacher in a high school classroom.
To learn more about GEO Academies’ operations, philosophy, and success, I spoke with Kevin Teasley, its founder and CEO.
Why did you start GEO Academies twenty-five years ago? What were the foundational principles? Have those changed over the last quarter century?
Back in 1992, when I led California’s school voucher campaign, I met a man named Dr. Anjim Palmer. He had a private school for Black students located in South Central Los Angeles. I was trying to get his support for vouchers. He, of course, supported school choice but was reluctant to support Prop. 174. Why? Because he didn’t know the people behind the initiative. He said if you care about our children and our people, then where were you when I built this school? When my mother died? When my children got married? His point was well taken. There is no relationship. No history. Thus, no trust. Many school choice advocates, including me, didn’t invest any more time in the communities they seek to change than the life of a political campaign. Without my realizing it, this shared wisdom formed a foundational principle of GEO.
After leading many political campaigns across the country, I was looking to do something more meaningful than just raise money for radio, TV, phone bank, and mail campaigns. I thought about Dr. Palmer’s comments and decided to start Greater Education Opportunities (GEO) Foundation in 1998 to build meaningful and trusting relationships by empowering underserved families to create and support the school choice policies of their preference—charters, vouchers, tax credits, etc. They choose. I committed to support them for the long haul, and GEO was the vehicle to make it possible.
After a few years of GEO operating, Indiana passed a charter law, and we were invited to open one of Indiana’s first charter schools. I saw this as an opportunity to go beyond the talk of school choice and prove to our local communities that choice works and benefits inner-city families. Over the last twenty-five years, our efforts have become so much more than proving choice works. We’ve developed strong relationships in the communities we serve. We are present for funerals, weddings, graduations, new jobs, and new births. We have very meaningful and trusting relationships in the communities we serve. That’s good for school choice.
And while we started our schools with the stated intention of improving test scores and high school graduation rates, we found a strong disconnect between our aspirations and student aspirations. Most students we served didn’t see themselves as going to college due to costs and lack of anyone in their families having gone to college. Heck, many of the families we serve lack high school diplomas. And we want their kids to do better on tests and go to college?
So after many years of doing what traditional college prep high schools do—focusing on academic rigor, stressing the importance of going to college to increase lifetime earning potential, and doing the college tour, scholarship, and application workshops, and yet, ultimately failing to get through to students—we decided it was time to take a very different approach. We stopped talking at them and started showing them. We started putting students on a real college campus while they are supposed to be in our high schools. We wanted to show students they can do college. Take away the mystique and fear of college. Knock down the financial barriers of college by paying their tuition, too. And provide them the necessary staff support—academic and social—to help them succeed.
It started with Vincent Pena in 2011. He was sixteen. He was smart, but he was going to drop out of our high school. He didn’t see himself going to college, couldn’t afford it, and his family needed him to help pay the bills. It was a five-alarm fire for us. We offered to put him in college if he passed the college entrance test. We promised to pay his tuition, buy his books, and to help him earn an associate degree. He took the test, passed, and two years later, he became the first in Northwest Indiana to earn a full associate degree before graduating from high school. This experience changed GEO’s model dramatically.
Today, more than sixty students have earned associate degrees before graduating from our high school in Gary, and now we are replicating our model in Indianapolis and Baton Rouge. One Gary student earned her bachelor’s degree from Purdue in 2017 before graduating from our high school. She was not a unicorn. Two more will do that in 2024, and six more will do that in 2025. We are just getting started in Baton Rouge, but already had 10 percent of our inaugural graduating class of 2023 earn associate degrees while in our high school—a first for the city. This year, in 2024, we will have 20 percent of our graduating class accomplish this goal. The support of our schools and the actions and results of these students are having a positive psychological impact in Gary. And now, it’s spreading to Indianapolis and Baton Rouge.
Those college and career readiness programs you just mentioned—central to GEO Academies and with many extraordinary success stories over the years—are a rather sharp departure from how high school is usually structured in the country. Why do you take that approach? And how do you facilitate and maintain its success?
Yes, our schools are very different from traditional schools. We begin with the end in mind. And we believe this is just as much a psychological battle as it is an academic battle. We are all about student college and career success. We’ve learned talking about going to college is not enough for our students. Our students need real college experience while with us. Once they see they can do college work, high school graduation becomes more important to them. Our annual high school graduation rates are near 100 percent today, and our college and career readiness ratings in Indiana are nine times the state average for the demographics we serve and five times the general population across the state.
We facilitate and maintain our success each year by budgeting properly and prioritizing these outcomes. College and career success drives every decision we make. We don’t invest in huge facilities. We don’t have a large staff. We are not a destination high school. We are a launching pad. We intentionally partner with local colleges and universities to provide teachers and facilities. This increases the educational opportunities we can provide our students, saves us from having to compete with higher ed (and others) for high-quality teachers, and saves us facility costs, too. We don’t need to build huge facilities.
This approach allows us to spend the “savings” on paying tuition and providing students access to the many educational opportunities that already exist on college campuses and in career centers. We are a small school, but we seek to provide all the amenities you find at large schools and more. For example, we don’t own a plane or flight simulator, but our students earn pilot licenses. We don’t have a welding tool on campus, but our students earn welding certifications. And we don’t have a Spanish teacher, but our students learn Spanish (at the college level). We offered more than 200 additional courses to students and met their individual interests, but didn’t have the expense of all those full-time teacher salaries and all those additional classrooms. These are significant savings!
American schools have long suffered from “excellence gaps”—wherein students from marginalized backgrounds who are capable of advanced achievement fare much worse than their advanced peers who are more advantaged, be it test scores, college acceptance, college graduation, or lifetime earnings. Schools only have so much power to narrow these gaps—but where they do have influence, in what ways do you think schools fail? And how could they succeed?
I think many schools fail to fully empower students because they have blinders on. Schools say they believe kids can do more, but then they limit them to opportunities on their own campuses. They say it is too expensive or cumbersome to allow students to take real college courses and transport them to college campuses. These are excuses—convenient and focused on schools, not students.
Dual-credit or AP courses on high school campuses work for some students but not for all. And they are not the same as real college courses. Many students need and benefit from real college campuses experiences while they still have the support of their high school staff.
This is how we turn things around. We exist for the students and the students alone. The dollars we receive per student belong to our students, not our schools. We are here to help students earn as much as they can with the public dollar as possible. No law says students are limited to earning a K–12 education with K–12 dollars. No one says that. We don’t. So if a student of ours is capable of doing more and earning a K–16 education within the thirteen years we have them in our K–12 schools, why not allow and support that? Students benefit. Society benefits.
You believe you model is scalable across America. Can you expound on that, touching on start-up costs, state funding, and what, if anything, would have to change in other locales to facilitate that expansion? What are the biggest challenges to making such scaling a reality?
Yes, our model is scalable. Philanthropy is needed for school launch, but after that, we operate on state, local, and federal dollars. That is our goal. We don’t build a model based on annual philanthropic gifts. That’s not smart. The college credits and degrees our students earn are paid for with the public dollars we receive.
The most important change that is needed is in the mindset of adults running traditional schools. Everyone always wants more money (who doesn’t), but until that money flows, how are you going to help students do more with what you have? That’s the job. In Gary, Indianapolis, and Baton Rouge, we partner with local colleges and universities because they have the expertise, it is economical, and it provides real experience our students need to go to college and complete college. It also helps our students see why they need to finish high school.
At the higher-ed level, mindsets need to change, too. High school students can do college work, they don’t misbehave on campus, and they can work with older students and adults. And as an aside for all those higher-ed institutions with declining enrollments, partnering with your local high school is perhaps the best way to increase your enrollment and get students to not only enroll, but complete their degree with your institution. Don’t wait until they are seniors or graduate from high school to recruit them. We start our students as early as ninth grade in real college courses.
Lastly, at the state policy level, we need to break down the silo between K–12 funding and higher-ed funding. It’s as if the two shall not meet. They should. And the budgets should be blended accordingly. The funds don’t belong to institutions. They belong to students. States should fund students earning an education and not restrict it to K–12 results. Indiana is now supporting and rewarding high schools for producing students who earn one and two years of college. The state rewards high schools with a $1,500 check per student earning thirty college credits and $2,500 per student earning an associate degree. This is a giant step toward incentivizing high schools to do more than tradition expects. Other states should replicate this effort.
GEO Academies have grown to eight schools that serve more than 4,000 students. What are the organization’s plans for the next five to ten years?
We’ve been reluctant to say we will grow to fifty to 100 schools in five or ten years. While we would like to do that, that would take a lot of philanthropy to launch. It is most important for us to open quality schools, not focus on the quantity of schools. Each location is unique. That said, I think it is fair to say we will double in size in the next five years and serve more than 8,000 students by 2029. More important than the number of students we serve will be the number of students earning associate degrees before graduating from our high schools. While I’d like to say we will have 100 percent of our students graduate with an associate degree in four years, we are open enrollment schools, and many of our students want to pursue career certifications, too. So, our goal is to get to 50 percent of our graduating classes earning associate degrees, with 100 percent earning at least one full year of college and/or a high-quality career certification while in our high schools. Even for students who don’t complete the full sixty credits and only have forty-five, or thirty, or even only three, they have already taken significant steps towards envisioning and accomplishing their future.
This is the third in a series on doing educational equity right. See the introductory post, as well as ones on school finance, advanced education, school closures, homework, grading, effective teachers, and a concluding post on doing educational equity wrong.
If school funding is the issue around which it’s easiest to find common ground across left and right, school discipline might be the hardest.
That shouldn’t be surprising, given how divisive our country’s debate has been on the related issue of criminal justice and law enforcement. Whether it’s violent crime on the streets or mayhem in the hallways, conservatives are going to focus first and foremost on law and order, while liberals will be concerned primarily with fairness and equal treatment.
Nor do folks on right and left view racial disparities in arrests and incarceration—and suspensions and expulsions—the same way. For many on the left, such disparities are clear evidence of racial discrimination and injustice. Conservatives, however, view it as far more complicated, starting with the need to understand whether there are differences in actual behavior. If individuals from certain groups are more likely to commit murder, they will be more likely to be locked up for violent crime. If individuals from certain groups actually get into more school fights, they will more often be suspended or expelled—even if justice is meted out to individuals perfectly fairly and without bias .
So how can we try to bridge these vast ideological divides? Let’s go back to my three rules:
- When aiming for equity, we should level up instead of leveling down.
- We should focus on closing gaps between affluent students and their disadvantaged peers, not between high-achieving students and their lower-achieving peers.
- We should focus equity initiatives primarily on class, not race.
The first rule is by far the most important, yet rarely gets discussed as part of the school discipline debate. And that’s because most of our arguments are about how adults should respond to student misbehavior. Should teachers send kids to the principal’s office? Should principals suspend kids, and for which kinds of infractions? Should school-board policy ever include expulsions, and what safeguards should be in place? How to make all of this less racially biased?
But those decisions are downstream from student behavior itself. And the first goal of any student discipline policy should be to help students behave better—to “level up.” In other words, we should reject the “soft bigotry of low expectations” when it comes to students’ comportment in classrooms, hallways, and the cafeteria, just as we reject it when it comes to our beliefs around what “certain kids” can learn.
We should avoid at all costs, then, any policies that indicate to kids that they can get away with bad behavior—cussing out their teachers; bullying their peers; interrupting instruction; much less engaging in violence. And we should focus instead on schoolwide approaches to helping students meet high behavioral standards.
To be clear, I don’t have in mind the old-school “no excuses” fetishes around matching socks, tucked-in shirts, and silent hallways, but standards of behavior that we’d expect to see in any well-run, joyful, learning-focused school.
That means modeling good behavior for students; holding them accountable for infractions; working proactively with families when there are bigger issues; and supporting teachers when they try to hold the line.
Now let’s bring in rule number two. In this context, it means paying just as much attention to well-behaving students as to their misbehaving peers. That’s one of the purposes of office referrals and suspensions—to “put out” the misbehaving kids so that their peers can return to learning (or, in the context of hallways and lunchrooms, to feeling safe). And that’s critical! We know from several high-quality studies that misbehaving students can wreak havoc on their peers—both in terms of making their behavior worse, and in driving down student achievement. Given that high-poverty schools struggle the most with disciplinary challenges, keeping disruptive students in classrooms only widens the achievement gap. Such policies also drive teachers crazy—and drive many of them out of the profession, or at least out of high-poverty schools.
Yet even discipline hawks—I admit to being one—must admit that suspending or expelling students from school is extremely problematic. A growing body of evidence demonstrates that these practices have troubling consequences for the students subjected to them, even after controlling for underlying factors that might have contributed to students’ misbehavior in the first place. And it doesn’t take a Ph.D. to understand why that might be. Many misbehaving kids are coming from broken homes and/or dangerous communities. Making them spend days or months on the streets, away from opportunities to learn, is hardly going to do them any favors.
What we need, then, are well-designed interventions for misbehaving students—especially chronic and violent offenders—that help them learn to improve their behavior, keep them learning academically, and protect their peers from further disruption along the way. That’s a tall order, but a number of schools and districts are experimenting with various approaches, from much-improved versions of in-school suspensions to “alternative placements”—other schools that kids attend for short to medium periods before returning to their home campuses.
None of that is easy, and like everything in education, this will only work if we get the details right. That means a lot of trial and error and continuous improvement. But do you know what will make that even harder? Viewing any effort to address student misbehavior as racially tainted.
Which brings us to rule three: focusing primarily on students’ socioeconomic status instead of race. Now, as I wrote in my introductory post, we can’t ignore race entirely. American education has a long and sordid history of discriminating against kids of color, especially Black children, including the use of suspensions and expulsions in racially biased ways. The Office for Civil Rights has a clear and compelling mandate to step in when schools or districts treat individual kids differently on the basis of their race (or other protected categories). Conservatives need to acknowledge as much.
But liberals need to be willing to embrace the complexity of this issue. Yes, Black students are suspended or expelled at disproportionate rates. But if we control for class, we see that most of those disparities disappear. That’s because kids growing up in poverty are much more likely to experience all manner of challenges that make it more likely for them to misbehave in school—and that’s true whether we’re talking about White, Black, or Brown students. Kids without a father in the home are more likely to get in trouble at school. Kids from dangerous neighborhoods are more likely to get in trouble at school. Kids dealing with lead poisoning are more likely to get in trouble at school. Kids who are victims of abuse or neglect are more likely to get in trouble at school.
In every case, these situations are tragic—as is the fact that Black students in America are three times as likely as their White peers to live in poverty, and six times as likely to live in deep poverty. Thus, it’s just a matter of basic math that Black students on average will be more likely to misbehave in school than their peers—not because they are Black, but because they are suffering the ill effects of poverty.
But guess what: The (few) studies that have been able to control for underlying student behavior find that the racial gaps in punishment shrink to almost nothing. Not zero—indicating that some racial bias remains and must be addressed. But it’s very much on the margins, not the center of the story.
To conclude, here’s how we might find common ground around this most vexing issue:
- Put real effort and resources into helping students meet high behavioral expectations.
- Develop alternatives to out-of-school suspensions and expulsions that address the needs of chronically or violently misbehaving students, while protecting the sanctity of the classroom for their teachers and peers.
- When working to root out racial bias in exclusionary discipline, control for differences in student misbehavior, or, if that proves impossible, at least control for students’ socioeconomic status.
The way to “make school discipline more equitable” isn’t by letting kids get away with misbehavior, but by helping all kids, from every group, learn to behave well. We might never fully achieve that lofty objective, but we’ll be a better country if we try.
I used to judge teachers who quit midyear. How could they abandon their students? Didn’t they sign a contract? Could they just really not cut it? Well, now I get it. Midyear quitting may be unseemly, but it’s understandable. When teachers must abide relentless chaos or fear outright brutality, I get it.
In an online thread, thousands of teachers tell stories about the new normal of students throwing supplies, cussing out teachers, and showing complete apathy toward academic work. PBS ran a more thoroughly journalistic story in which teachers raised the same concerns: “Hitting, biting, spitting, throwing furniture” are common in too many classrooms nowadays.
Whatever metric you use, statistics bear out the anecdotes that emerge both from reporting and from online vent sessions: post-pandemic student behavior remains chaotic. In schools across the country, there was a 9 percent increase in weapon confiscation last year. Violence spiked in districts from North Carolina to Denver. In a 2023 survey of superintendents, concerns about behavior topped academic loses as a major concern: 58 percent cited academics as worse since the pandemic, while 81 percent noted behavior.
And teachers are fed up with this reality on the ground. Two representative surveys capture this dissatisfaction. The first, from the National Alliance for Public Charter Schools, finds that the greatest concern among teachers right now is behavior. The second, from the Rand Corporation, places behavior as the number two stressor in teacher’s lives, behind only concern for the academic growth of students. Both place teacher pay, the dissatisfaction about which we hear most, far lower.
But surveys miss what this really means in practice.
They don’t capture the stress and adrenaline shock after breaking up a fight. They don’t capture the change in thinking from “these students are disrespectful” to “I don’t deserve their respect”—a shift as subtle as it is emotionally crushing. Nor does it capture teachers’ all-consuming anxiety—fear, even—at the uncertainty of what will happen that day, playing out worst case scenarios like a suspense thriller in their mind.
Teachers are expressing this dissatisfaction. In Akron, Ohio, for example, the union threatened to walk out after a proposed district policy that would redefine “assault” as only incidences that resulted in injury. In Charlottesville, teachers staged an unofficial walkout, calling in sick on a Friday in November and forcing a shut-down the following Monday and Tuesday because of ubiquitous classroom violence. In Portland, a group of principles penned an open letter pleading for help with record-setting incidents of classroom disruptions and physical altercations.
As with any policy issue, the solutions to this behavioral uptick are complex and mostly unsatisfying. How do you improve poverty? Well, it’s economics, tax-policy, healthcare, safety nets, public philosophy and Zeitgeist shifting, philanthropy, institution building, and more.
The causes of today’s spike in misbehavior are multiple: pandemic-era disruptions in schooling and the subsequent unlearning of behavioral norms and habits, learning loss that fosters academic difficulties and so misbehavior, screen addictions, trends in permissive parenting, broader trends of societal disorder, lenient discipline fads in schools, and on and on. As such, the solutions to our behavior crisis involve dozens of levers in public policy and education reform.
With that in mind, below I hazard six behavior-specific recommendations:
1. Keep the federal government out of it.
Even before the pandemic turned the behavior crisis to eleven, the Obama administration arguably set the course for leniency with its 2014 Dear Colleague Letter, threatening legal action against school districts that showed disparities in rates of punishment, thereby forcing schools towards leniency. Policy at such a high level cannot possibly fit facts on the ground. In a district where I worked, a handful of students racked up the lion’s share of disciplinary action. Recent research finds that it’s also just a handful of novice, ineffective teachers who write the majority of office referrals. These outliers skew data and so handcuff administrators from effectively disciplining students. And any federal policy that incentivized strictness would likely cause the debate to swing equally too far in the opposite direction. Most teachers prefer stricter discipline, and so keeping decisions local would likely bring the pendulum swing to a happier middle.
2. Sweat the small stuff.
Too many administrators ignore the minutiae of behavior codes, such as the need for a uniform policy. Why enforce attendance or discipline a child for talking out of turn when there’s a fight in the cafeteria? “We’ve got bigger fish to fry!” But if school staff do not hold the line on small fights, bigger fish come along. Highly successful charter schools adopt a “broken windows” approach to school order—even paying staff whose job it is to replace every burnt out lightbulb, wipe up every scuff on the floor, and reorder any school display. Sweating the small stuff communicates to students that school buildings are not places that tolerate disorder, and that instead they expect excellence from everyone who walks through their doors.
3. Lean on school boards.
School boards can compel buildings to review student conduct codes to tighten up what behavior warrants what response. I’ve written and reviewed a few discipline codes myself. They are the tools that empower or handcuff an administrator’s ability to back up their teachers. If a code of conduct doesn’t allow a detention or suspension for chronic minor disruptions, for example, a building administrator is powerless to help a teacher. What’s more, school boards can include language, such as that recommended in a model policy by the Wisconsin Institute for Law and Liberty that actively requires administrators to impose consequences: “If a teacher removes a student from class due to behavior outlined in this policy, before a return to class, the building principal or other administrative personnel will administer appropriate corrective action.” If the parents-rights movement leaned into school discipline, they might find more electoral success than messaging about explicit books.
4. Conduct a campaign of behavioral transparency.
Historically, attempts to tighten down on student discipline have met with hostile press cycles. When North Carolina required schools to reassess their discipline codes, local media framed it as a vote against “policies to soften racial disparities.” In a report for AEI, Max Eden recommends that districts open up anonymous surveys and conduct annual behavioral audits to see what is really going on. Districts that have done this receive teacher responses such as “we were told referrals would not require suspensions ‘unless there was blood.’” These would provide much needed rhetorical cover for any enterprising education reformer.
5. To teachers, do what you can.
Let me take off my policy wonk hat for a moment and speak to my fellow educators. I’ve worked in chaotic schools. I’ve seen bathrooms with sinks ripped off the walls and other scenes that aren’t fit to describe in pages such as these. I’ve walked down school hallways that reek of marijuana, where the most common sounds are students cursing and teachers shouting. In these scenarios, I had my students working silently, reading, and learning. One year, my students had the highest reading gains at my school. My administration thought I had some special “relationship-building” magic. I didn’t. I simply sat down one day and listed every consequence that I myself could impose where my administration demurred: pulling kids myself from lunch, recess, or gym to impose my own detention, grades for behavior, and whole class consequences, such as extra homework. I tallied over 150 calls home one year (both positive and negative). Like limping with a broken foot, some of these are not “best practices,” but are necessary when administrators cannot or will not maintain order.
6. To unions, take action.
As a conservative, I can’t believe I’m saying this, but local unions may be one of the few places of leverage that we have. At the national level, the major unions have bought into soft-on-consequences discipline, but, as in Charlottesville and Akron, local unions could force change where all other incentives foster inertia. National advocates are too often removed from boots-on-the-ground teachers, but local reps can see what their teachers really need most, and so are more likely to pick up this fight.
—
I’m a stalwart proponent of instructional, reading, and curricular reforms. These are the policies that will win real academic improvements for American children. But no amount of phonics instruction or civics education will mean much if students can’t even hear their teacher. Getting behavior right comes first.


