
With the past year now in the books, it’s time to look back. During 2023, we at Fordham wrote extensively about the biggest and most important policy issues of the past year, most of which were debated as part of the state budget process. Those include Ohio’s bold moves towards scientifically based reading instruction, landmark reforms in the way the state education agency is overseen and led, universal eligibility (with a twist) for private-school scholarship programs, and advances in funding equity for public charter schools. For more about these initiatives, check out this recap of the final budget bill, along with the pieces linked above.
Rather than rehash these policy wins, this lookback offers five data points, and six charts, that provide a picture of the year that was in Ohio education, with a particular focus on the Buckeye State’s sluggish pandemic recovery. It’s a sobering depiction of where students are at, but one that should remind us of the important work ahead to improve education in the new year.
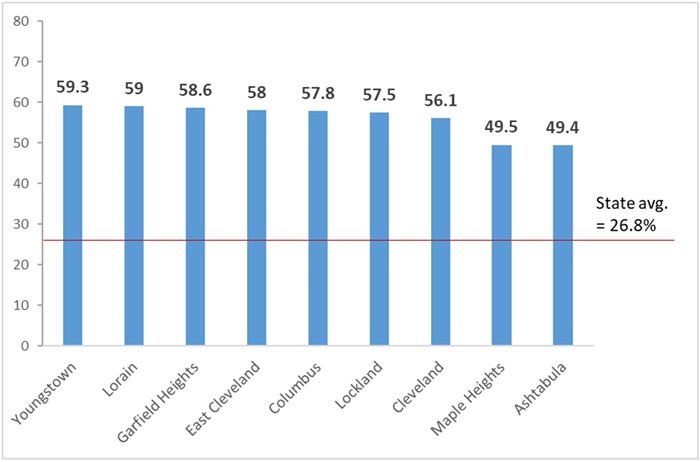
5. Ohio remains in the midst of a school attendance crisis. Following national patterns, absenteeism soared during the pandemic in Ohio. Various reasons help explain the rise, but regardless of cause, the most recent data from 2022–23 reveal that too many students are still missing large portions of the school year. Statewide, just over a quarter of students were chronically absent—i.e., missing the equivalent of eighteen or more days of school. As figure 1 indicates, more than half of students in districts such as Youngstown, Lorain, Columbus, and Cleveland were chronically absent last year. These rates remain much higher than pre-pandemic, and inconsistent attendance is surely making academic recovery harder. Fortunately, advocates have recognized the importance of regular attendance and offered a set of ideas to combat the crisis. State and local leaders should follow their lead and take action in the coming year to ensure students are in the classroom.
Figure 1: Ohio school districts with the highest chronic absenteeism rates, 2022–23
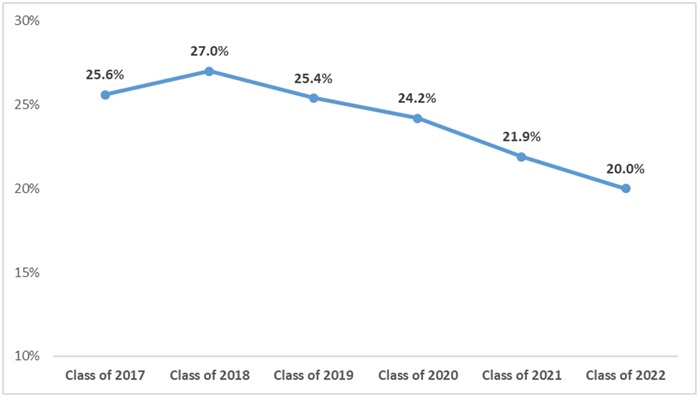
4. College readiness continues to slide. Last fall, the Ohio Department of Education and Workforce released its most recent college-and-career readiness data for the high school graduating class of 2022. Among the data points include the percentage of students achieving college-remediation-free scores on ACT or SAT exams. Achieving these benchmarks indicate that students are prepared for entry-level college coursework and remain important predictors of success in higher education. However, as figure 2 indicates, the state’s remediation-free rate has been on steady decline. Though Ohio has never had a very high remediation-free rate—the highest among recent cohorts is just 27 percent—the percentage sunk to just 20 percent for the class of 2022. The slide began just prior to the pandemic, but has accelerated since then—likely a result of pandemic learning loss. State leaders—and colleges, too—should be concerned that fewer students are exiting high school with the academic skills needed for college coursework.
Figure 2: Students meeting state remediation-free standards on the ACT or SAT, class of 2017 to 2022
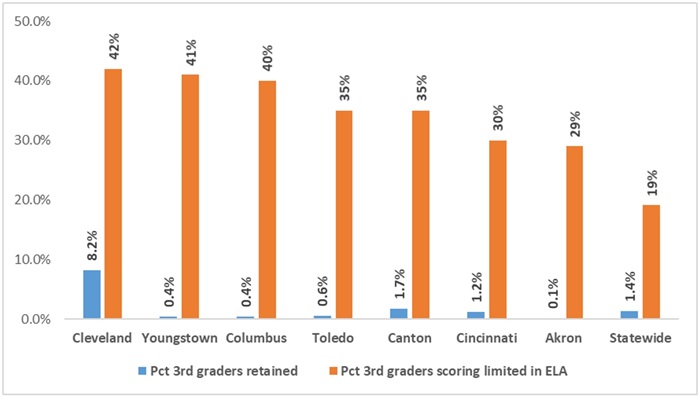
3. Social promotion runs rampant with the Third Grade Reading Guarantee in tatters. Under former state policy, schools would have been required to retain third graders who fell short of state reading benchmarks on their 2023 assessments. But via the state budget bill passed in July, lawmakers let schools off the hook for retaining struggling readers. Figure 3 shows the result of this requirement-free year. Statewide, just 1.4 percent of third graders were retained, despite almost one in five scoring “limited”—the lowest achievement level on state exams—on their English language arts (ELA) assessment. The discrepancies are even larger in urban districts. Akron, Columbus, Toledo, and Youngstown waved through virtually every third grader to fourth grade despite large numbers demonstrating severe reading deficiencies. Unfortunately, widespread social promotion is likely to persist. Beginning this school year (2023–24), the legislature (again via budget bill) carved out a Texas-sized loophole that allows schools to promote struggling third graders provided they receive parental sign-off. With little to stop the grade-promotion train, low-achieving students will once again be at-risk of falling through the cracks. As a growing number of studies indicate, they are apt to fare significantly worse as they progress through middle and high school than if they had been held back.
Figure 3: Third grade retention rates versus percentages of third graders scoring “limited,” 2022–23
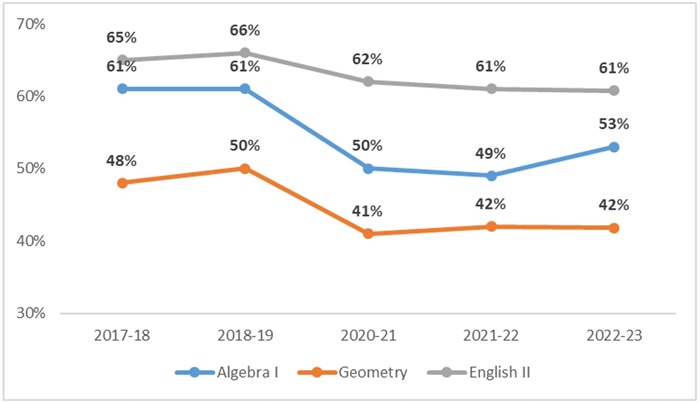
2. Achievement continues to recover from pandemic lows, but progress remains uneven across grade and subject. One of the most closely watched issues continues to be Ohio’s post-pandemic academic recovery. As has been widely documented, achievement plummeted as a result of the school closings and disruptions during the end of the 2019–20 school year and much of 2020–21. But with in-person instruction returning and billions in federal emergency aid being funneled to Ohio schools, achievement has climbed from pandemic lows. As figure 4 indicates, fourth grade math proficiency has risen from 59 to 67 percent between 2020–21 and 2022–23; sixth grade math proficiency has increased from 46 to 50 percent. But despite those upticks, math proficiency still lags noticeably behind pre-pandemic levels; the same holds true in some (though not all) grades for ELA. Meanwhile, as seen in figure 5, recovery has been less impressive in high school. With the exception of last year’s uptick in algebra I, very little improvement is discernable on recent high school exams.
Figure 4: Proficiency rates on fourth and sixth grade exams
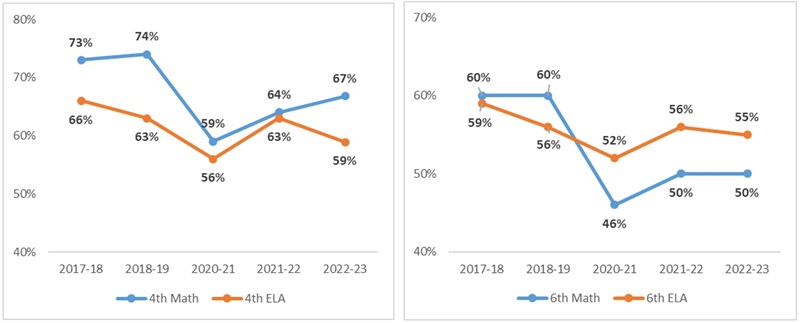
Figure 5: High school proficiency rates on state end-of-course exams
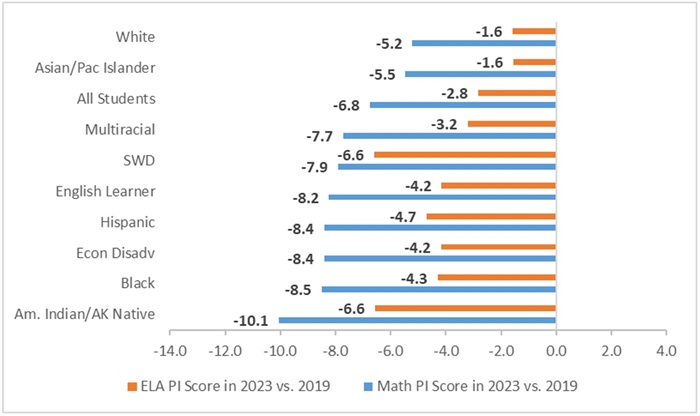
1. The state still has a long way to go to achieve full academic recovery. As a final look at the achievement numbers, figure 6 shows 2022–23 state assessment results by student group in comparison to each group’s pre-pandemic scores from 2018–19. The chart indicates that every student group—and students statewide—still lag their pre-pandemic counterparts. Historically disadvantaged groups (economically disadvantaged or Black or Hispanic students) have the most ground to make up, and students across the board are behind more in math than ELA. Remember, of course, that simply getting back to a pre-pandemic “square one” isn’t exactly cause for celebration, as achievement gaps were unacceptably wide before disaster struck.
Figure 6: Declines in math and ELA performance index scores by student group, 2022–23 versus 2018–19
* * *
During the past year, Ohio leaders advanced a number of policies that can improve schools and boost student achievement. But as these data indicate, the work is far from finished. As we move into the new year, let’s recommit once again to putting student learning and educational excellence at the center of our policy discussions.