NOTE: The Thomas B. Fordham Institute occasionally publishes guest commentaries on its blogs. The views expressed by guest authors do not necessarily reflect those of Fordham.
Although the worst of the pandemic has passed, and the political social media chatter remains focused on the latest culture wars, the academic impacts of the unprecedented interruption to American schooling continue to be felt by Ohio students. That’s the message from the latest round of state exams taken by students this spring, according to my new report prepared for the Ohio Department of Education.
The analysis is based on preliminary results from the exams (the official results will be released later this month) and is the latest in my series of data deep dives designed to track the impact of the pandemic on the state’s students and their subsequent recovery.
To preview, the latest numbers underline how far Ohio students have come from the academic low point recorded in the first year of the pandemic—reflecting the dedication of our educators, the additional resources provided to local districts to support the recovery, and the determined focus of state and local policymakers. However, the tests also reveal how much work remains to be done—especially in mathematics, among older students, and in school districts hit hardest by the pandemic learning disruptions.
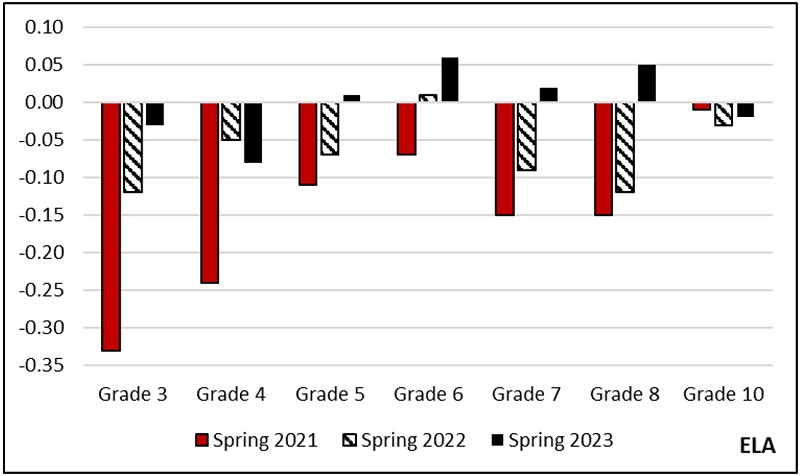
On the positive side, student achievement continued to improve over the past year, with average English/language arts (ELA) scores largely returning to pre-pandemic levels in most tested grades (or nearly so). In third grade, when students take the same ELA exam in both fall and spring, students learned 10 percent more during the 2022–23 school year than was typical before the pandemic and a big improvement on the previous year. This represents nearly double the rate of learning acceleration seen last year on national assessments and is a tremendous accomplishment that should rightly be cheered and recognized.
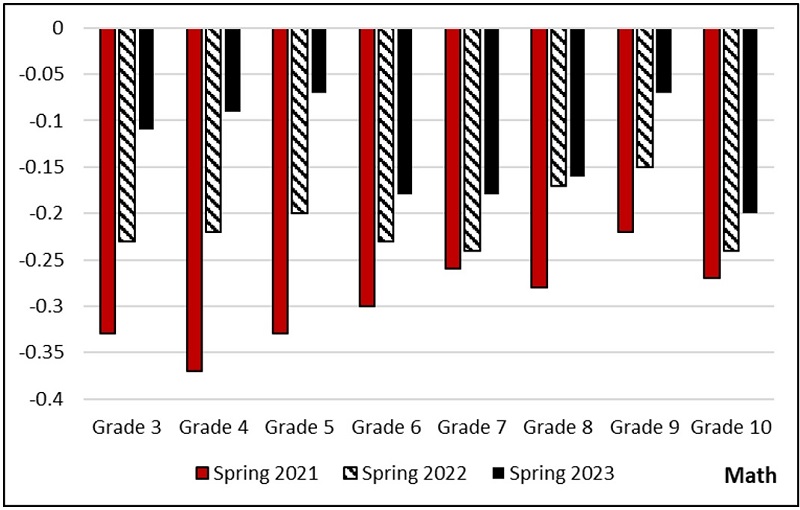
The news is more mixed in mathematics, where the test score declines were considerably larger. While elementary school students posted some catch-up growth over the past year, middle and high school students continue to perform well below pre-pandemic cohorts. And in both ELA and math, the recovery has been uneven, with Black, Hispanic and economically disadvantaged students still facing the largest shortfalls in most grades. These subgroups already lagged their peers before 2020. The gaps widened during the first year of the pandemic and remain bigger than before.
Changes in standardized scaled scores compared to pre-pandemic years, by grade and subject
My latest report contains several other new insights. First, it goes beyond math and ELA to examine both science and social studies in the grades these exams are taken. Achievement in these subjects suffered substantial declines post-Covid and has also experienced partial recovery since then. Second, in addition to describing the trend in statewide average scores, the analysis examines variation across school districts. And it is these numbers that are perhaps the most sobering.
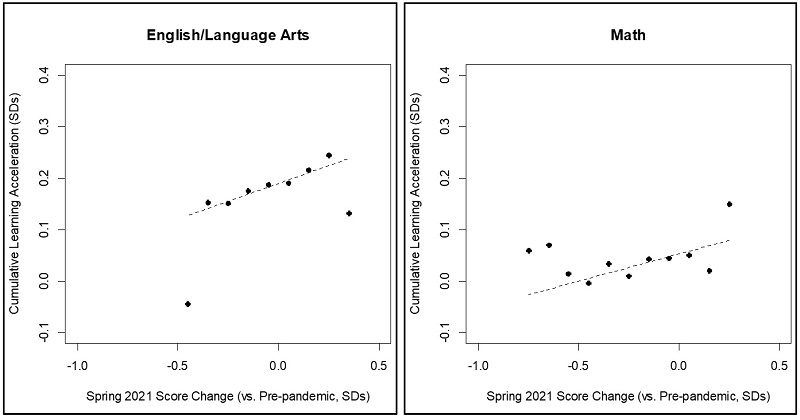
Overall, more than 90 percent of Ohio school districts have seen their achievement improve since spring 2021, the pandemic low. However, the pace of the recovery has varied considerably across different communities. Areas that showed the largest academic declines have not posted faster growth over the past two years—if anything, they seem to be recovering more slowly. This can be seen in the figure below, with districts arranged in order based on the magnitude of their initial losses. The groups on the bottom left of each panel represent districts with the largest test score declines in the first year of the pandemic. As the figures show, they have actually experienced somewhat slower learning acceleration over the past two academic years (tracked on the y-axis) than the rest, a worrying trend since they have the greatest ground to make up. In addition, districts that received the most federal pandemic aid per student have not experienced substantially faster achievement growth. (The districts whose achievement declined the most were also, in general, many of the same districts that received the largest infusion of federal funds.)
Relationship between initial achievement declines and learning acceleration since spring 2021 at the district level
That does not mean that federal dollars have not played an important role in Ohio’s academic recovery. But the data do suggest that federal aid—the last of which must be committed by September 2024—is unlikely to be enough to close the academic gaps. It is important for policymakers to plan for the next phase of the recovery—with strategic emphasis on the subjects, grades, student subgroups, and school districts where achievement continues to show the largest shortfalls.
Over the past three years, Ohio has served as a national model in the transparency policymakers have brought to this issue. No state has kept such a close eye on the trajectory of student achievement and publicized the results in such detail, even when they have not made for pleasant reading. Willingness to track the data and confront bad news head on may explain the impressive improvement in ELA scores over this period. With continued focus from policymakers, we can continue to make further progress in preparing Ohio students for long-term success.
Vladimir Kogan is a Professor in The Ohio State University’s Department of Political Science and (by courtesy) the John Glenn College of Public Affairs. The opinions and recommendations presented in this editorial are those of the author and do not necessarily represent policy positions or views of the John Glenn College of Public Affairs, the Department of Political Science, or The Ohio State University.