

Standards & Accountability
Ohio’s feel-good school report card masks poor student outcomes
In the wake of the September release of school report cards, education groups were in a celebratory mood.
In the wake of the September release of school report cards, education groups were in a celebratory mood.

In the wake of the September release of school report cards, education groups were in a celebratory mood. In an exuberant press release, Columbus City Schools feted its 46 schools that notched three or more stars on their report card. Cincinnati Public Schools boasted its districtwide three-star rating. Even the teachers union—a longstanding report card critic—touted the high ratings received by Ohio schools. “With 94 percent of school districts meeting or exceeding state standards, there is much to celebrate in this year's report card results,” said Ohio Education Association president Jeff Wensing.
It’s true: Lots of districts and schools got an attaboy on their report card this year—and even more than the year prior. But these rosy ratings belie chronic achievement gaps, persistent learning losses post-Covid, and the sluggish improvements students have made to recover academic ground.
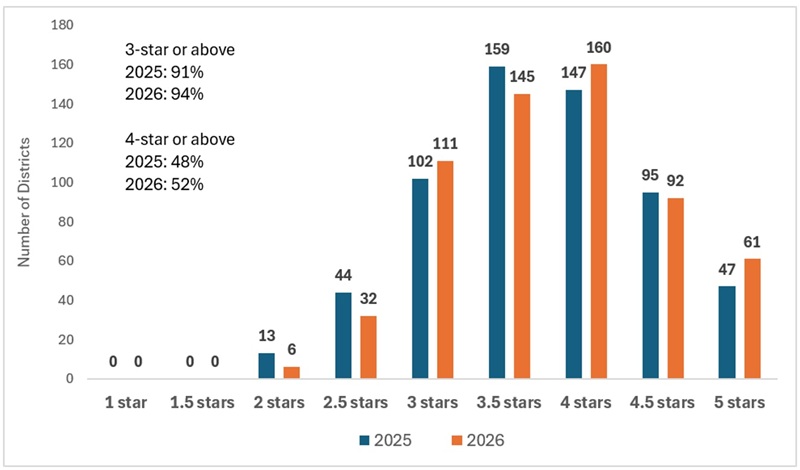
Let us first look at how the 2025–26 overall ratings shook out. As the figure below indicates, more than nine in ten districts statewide did indeed receive three stars or above (three stars indicate “meeting state standards”). Just over half of districts received four stars and above (“exceeding standards”). By contrast, no district—not a single one—received a one-star or 1.5-star overall rating. As shown in the figure, the ratings from 2025–26 outpace the already sky-high marks registered the prior year.
Figure 1. District-level overall ratings, 2024–25 and 2025–26
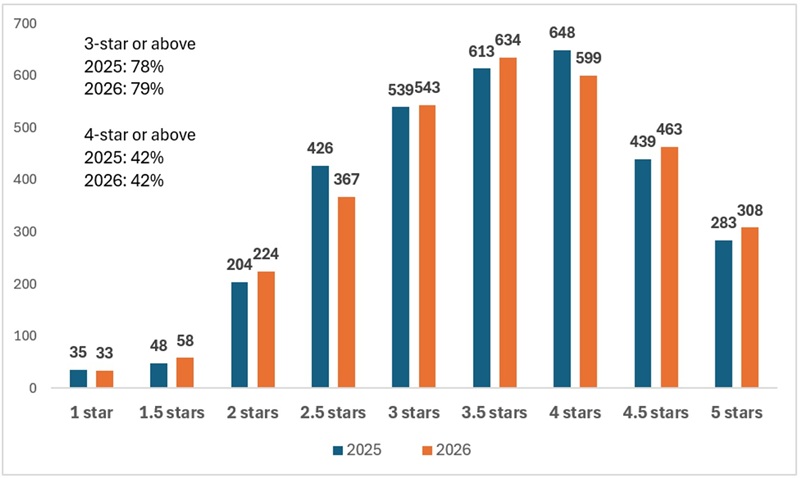
Though not quite as extreme, a similar story unfolds at the individual school level. As Figure 2 indicates, 79 percent of Ohio schools were awarded three stars or above, while 42 percent received at least four. Just 3 percent of schools statewide received one of the two bottom ratings.
Figure 2. School-level overall ratings, 2024–25 and 2025–26
These feel-good ratings obscure the more sobering data about how students fare academically. Two in five Ohio students fell short of math and reading proficiency in 2025–26, with most students still struggling to catch up after the pandemic train wreck. In Columbus, 46 percent of students scored “limited”—the rock-bottom mark on state assessments—while 36 percent in Cincinnati recorded such scores. The state’s elevated chronic absenteeism rates barely budged. The share of students meeting college-ready targets on the ACT or SAT continued their downward slide. Just 18 percent of the class of 2025 met the readiness bar on these entrance exams, down from 27 percent for the class of 2018.
What gives? Why are so many schools getting high ratings when so many students are struggling?
The answer lies in Ohio’s soft report card standards. Based on 2024–25 report card results, I previously examined several areas where policymakers have implemented low performance standards. Left uncorrected over the past year, the problems have only gotten worse and produce inflated ratings. To recap briefly:
In 2021, Ohio lawmakers made significant reforms—many supported by the Fordham Institute—to the school report card. The bones of the system align with best practices, including an emphasis on student proficiency (“achievement”) and academic growth (“progress”) as measured objectively via state assessments. It also features a user-friendly overall rating and a star system to communicate results.
But the cancer of low expectations has infected the otherwise healthy bones of the report card. The result is ratings that offer parents and communities an increasingly dishonest picture of how students fare academically. Curing report-card inflation through raised standards is bound to pain some adults, but it’s also the right thing to do. Honesty, after all, is the best policy.
[1] These ratings are noncompliant with a provision in state law prohibiting more than half of districts or schools from receiving the same rating. This should be addressed in advance of next year’s report card.
[2] Just 16 and 9 percent of Akron and Youngstown graduates, respectively, earn an associate degree or above by their mid-twenties. The median incomes of Akron and Youngstown graduates are $26,130 and $18,486, respectively, five years after high school.

In June, lawmakers passed long-awaited and comprehensive math legislation in the form of Senate Bill 19. The new law aims to improve Ohio’s lackluster math achievement in several ways: the Department of Education and Workforce (DEW) will establish a list of high-quality core curriculum and instructional materials for math; the State Board of Education will ensure all new educators have sufficient math knowledge before teaching math; districts will be required to provide advanced math opportunities to high achievers and evidence-based intervention services to those who are struggling; and schools will be required to submit math improvement plans to the state if fewer than half their students score proficient in third grade math.
Some of the provisions included in Senate Bill 19 will be implemented beginning this year. That makes recently released report cards from last year (2025–26) an important baseline for tracking improvement. Let’s take a look at four data points in particular that policymakers and the public should keep a close eye on.
1. Statewide proficiency on math exams.
The clearest sign that Ohio is improving math achievement would be an increase in the percentage of students who score proficient on state math exams. Table 1 identifies those shares for the three most recent school years. In 2026, just above half of students in all grades across Ohio were proficient in math. Only three grades—third, fourth, and Algebra I—posted rates above 60 percent. Proficiency percentages were lowest in seventh grade (48.6) and Geometry (43.3).
Table 1. Percentage of students scoring at least proficient on math state tests
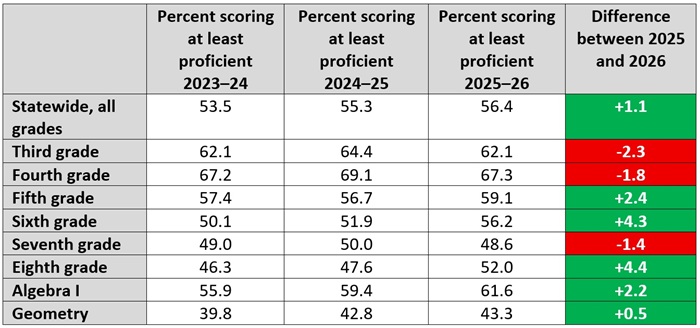
The final column of Table 1 identifies the difference between 2025 and 2026 results, with green shading indicating improvement and red signaling a decline. It’s good news that the percentage of students who scored proficient rose across five grade levels. Results are especially positive in sixth and eighth grade, where proficiency jumped by more than 4 percentage points. It’s bad news, however, that there are three grade levels where proficiency rates declined. Particularly worrisome is the fact that two of the three are third and fourth grade.
2. Statewide proficiency among selected groups of students.
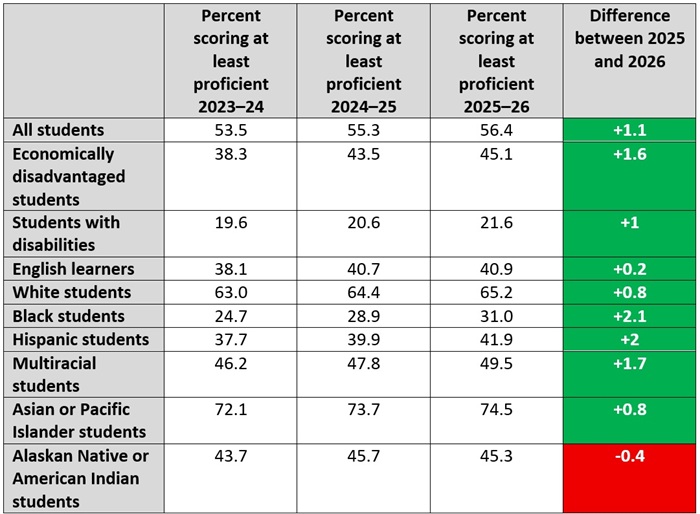
Another way to examine statewide proficiency data is by looking at how demographic groups perform. If Ohio can boost the percentage of traditionally underserved students who are proficient in math, that would be worthy of celebration. Table 2 shows the share of students who scored proficient or above on the state’s math exams during the three most recent school years. Green shading in the final column indicates improvement between 2025 and 2026, while red signals a decline.
As was the case with grade-level data, student-group results are a mixed bag. Proficiency rates are worryingly low for several groups. In 2026, just one-fifth of students with disabilities, less than one-third of Black students, and fewer than half of economically disadvantaged students were proficient in math. Only two groups—White students and Asian or Pacific Islander students—surpassed the statewide mark of 56 percent. The silver lining is that nearly every group improved between 2025 and 2026. But only two of those increases were by 2 percentage points or more (Black and Hispanic students improved by 2.1 and 2 percentage points, respectively). Ohio will have to do much better if it wants to close stubborn achievement gaps sooner rather than later.
Table 2. Percentage of students scoring at least proficient on math state tests
3. Percentage of students scoring limited.
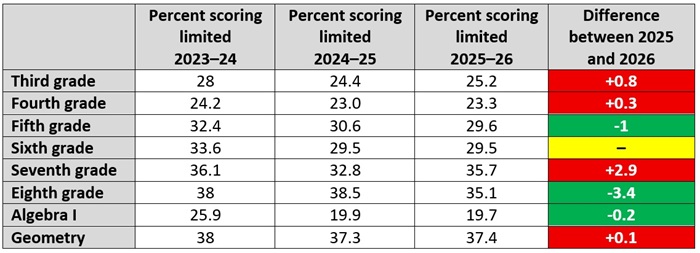
It’s crucial to identify how many students are reaching proficiency each year. But the other end of the spectrum matters, too. If fewer students are scoring at the lowest performance level (limited), then that means schools are pushing more students toward proficiency—even if students haven’t yet reached that level.
Table 3 identifies the percentage of students who scored limited during the last three academic years by grade. The final column identifies the difference between 2025 and 2026 results, with green shading indicating improvement (fewer students scoring limited), red shading indicating a regression (more students scoring limited), and yellow signaling no change.
Unfortunately, the results are pretty grim. In elementary school, roughly one-fourth of third and fourth graders are scoring limited. The percentage in both grades increased between 2025 and 2026. In middle school, even larger percentages of students are scoring limited—29 percent in fifth and sixth grade, and 35 percent in seventh and eighth—although both fifth and eighth grade improved this year. Meanwhile, in high school, it’s a tale of two subjects: Geometry posted the largest percentage of students scoring limited (more than 37 percent) while Algebra I posted the smallest (just under 20 percent).
Table 3. Percentage of students scoring limited on math state tests
4. Statewide pandemic recovery.
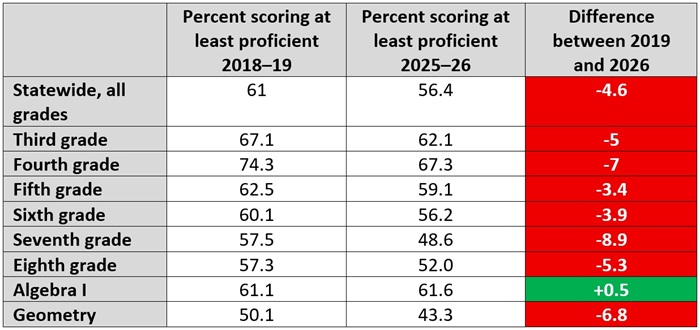
The final data that policymakers and advocates should closely monitor is whether Ohio students have recovered from pandemic-era learning losses. Table 4 identifies the number of students who scored proficient or above on the state’s math exams during the 2018–19 school year, the last before the pandemic, and the most recent 2025–26 school year. The final column identifies the difference between the two, with red shading indicating that proficiency hasn’t returned to pre-pandemic levels.
Algebra I is the lone bright spot. It’s the only state math assessment that’s successfully recovered, likely because the end-of-course exam that students take is part of Ohio’s graduation requirements and thus has higher stakes attached. Math achievement in every other grade has failed to rebound. Not only that, the discrepancies between pre- and post-pandemic scores are sizable. The smallest gap is 3.4 percentage points in fifth grade, while the largest is nearly 9 percentage points in seventh.
Table 4. Percentage of students scoring at least proficient on math state tests pre- and post-pandemic
***
Report cards from the 2025–26 school year demonstrate that Ohio has plenty of work ahead in math. Senate Bill 19 is a step in the right direction, but rigorous implementation will be key. Math proficiency is critical to all students’ future success, whether they pursue higher education or join the workforce. With a reenergized math policy in place, Ohio is poised to see stronger math achievement numbers in the years ahead.

Education systems often fail to challenge our very brightest students. The unfortunate result is that too many high achievers lose their edge and fall short of their potential. The problem is especially acute for high-achieving, low-income students who are commonly overlooked for advancement throughout their K–12 education. The lack of equitable access to more challenging coursework and instruction robs them of downstream opportunities to compete for selective colleges.
To their credit, state lawmakers recently took an important step forward to support Ohio’s high achievers. Enacted earlier this summer, Senate Bill 19 includes “automatic enrollment” provisions that require schools to provide high-achieving math students with advanced learning opportunities the following year. The requirements begin in elementary school and are designed to enable all high-achieving students to complete algebra I by the end of eighth grade. Successful completion of this gateway course in middle school opens doors to advanced math and science courses during high school—the very type of coursework that many four-year colleges expect.
With implementation starting soon—spring 2027 math scores will inform 2027–28 advancements—it’s worth reviewing the policy details. This piece first covers how students qualify for advanced math. It then turns to what advancement looks like in elementary and middle schools.
Student eligibility for advanced math
Students qualify for advanced math based on their state test scores. Those who score “advanced” in math—the highest achievement level on state exams—are automatically enrolled in advanced math the following year. Students who score one notch below—“accomplished”—qualify as well but must also receive an A or B in their math course or earn a satisfactory score on a diagnostic math test.[1] The link to state assessment results is critical: The tests are taken universally, so high-achievers from all backgrounds can be identified. It also means that math advancement decisions are based on objective standards (accomplished and advanced indicate being on-track for college) rather than subjective judgments alone. Because the eligibility criteria are tied to state tests, these provisions cover only fourth through eighth graders.[2]
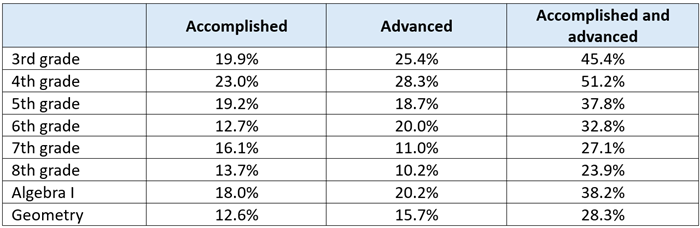
How many students are likely to qualify based on these criteria? As shown in Table 1, approximately half of third and fourth graders would likely score high enough to qualify for automatic advancement if current numbers hold. The number of high achievers in math starts to decline in fifth grade and by sixth grade—a pivotal year for algebra I placement (as discussed below)—just one in three students may qualify for automatic enrollment. This, however, would still represent a substantial increase in the number of students taking algebra I in eighth grade, as only 20 percent of Ohio students completed the course in eighth grade or earlier in 2024.
Table 1. Percent of Ohio students scoring accomplished or advanced on state math exams, 2025–26
Advanced learning opportunities—fourth through sixth grade
If students qualify in fourth through sixth grade, schools must provide “advanced learning opportunities.” These may be either:
Ohio rightly calls for early action, with advancement starting in fourth grade based on third-grade scores. Although the two service options outlined above provide districts with flexibility, they could also result in uneven advancement opportunities for students. Placement in an above-grade-level math course is more likely to ensure that students are challenged daily because the rigor is built into the coursework. The “services or curricula modifications” option, on the other hand, is just vague enough to open the door for lower-quality programs (e.g., sporadic “enrichment” or lackluster online modules). Moving forward, state officials should monitor how elementary schools implement “advanced learning opportunities,” which should include collecting data to help identify gaps in the types of opportunities elementary students receive.
Building to algebra I—seventh and eighth grade
As noted above, sixth grade is pivotal in Ohio’s advanced math framework. Sixth graders who score advanced or accomplished (and also earn an A/B or pass a diagnostic test) are automatically enrolled in a compacted math course that includes both seventh- and eighth-grade content.[3] Seventh graders who complete this accelerated course take the eighth grade state math exam at the end of the year and are automatically enrolled in algebra I if they achieve a score of “proficient” or above.[4] Compacted courses are common in schools that have traditionally offered algebra I in eighth grade. In those schools, only minor programmatic adjustments may be needed. Schools that have not offered compacted math courses, on the other hand, will need to overhaul their middle school programs. To its credit, the Ohio Department of Education and Workforce (DEW) has already developed some resources on advanced middle school math pathways. They’re a good first step, but more will surely be needed to effectively assist middle schools that must revamp their offerings.
* * *
Following in the footsteps of North Carolina and Texas, Ohio is now among the states that have adopted automatic-enrollment math policies. The change is a good one, as it promises to help ensure that all high achievers are challenged to reach their potential. But as with all policy reforms, implementation will be key to delivering on the promise of both expanded opportunities and stronger student outcomes. Ohio lawmakers have established an admirable advanced math framework. Now it’s time to start the work of implementing these policies well.
[1] Schools may also advance any student, regardless of test performance, at their discretion. SB 19 also includes an opt-out provision if parents believe advanced math is not the right placement for their child.
[2] State math assessments are given in grades 3–8 and algebra I and geometry. SB 19 contains no further advancement provisions prior to fourth grade or after algebra I.
[3] At this juncture, schools no longer have an option of providing “services or curricula modifications” to qualifying students; they must enroll students in the compacted seventh grade math course.
[4] “Proficient” is one achievement level below “accomplished.”

In 2023, Ohio policymakers launched a sweeping initiative championing the science of reading, an evidence-based instructional approach that focuses on phonics and knowledge-building. Given that it’s a statewide effort, tracking statewide results is crucial. But state numbers can also mask improvement (or lack thereof) in individual districts. To get the full picture of Ohio’s progress, it’s important to take a closer look at local results.
For the purposes of this blog, we’ll examine data from the early literacy component on state report cards among the Ohio Eight, a group of eight urban districts with a long history of academic struggles. We’ll also include Lorain and East Cleveland, which spent several years under the oversight of now-defanged Academic Distress Commissions (ADCs).[1] Collectively, these ten districts serve over 181,000 students—11 percent of Ohio’s public school population—and are among those most in need of early literacy improvement.
First, let’s take a closer look at one of the component’s three measures: third grade reading proficiency. Table 1 displays the percentage of students who scored proficient on the reading segment of the English language arts (ELA) exam, as well as the statewide third grade proficiency average.[2] The final column identifies improvement between 2025 and 2026 with green shading and a decline with red.
Table 1. Percentage of third graders scoring proficient on the reading segment of state ELA exam in selected districts
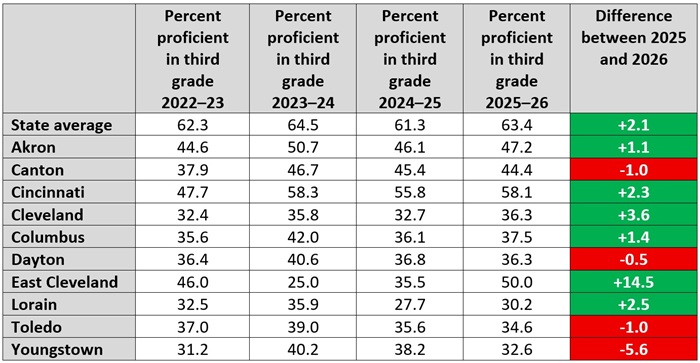
Overall, proficiency rates are pretty grim. No district met or surpassed the statewide average of 63 percent. The closest was Cincinnati, which fell short by more than 5 percentage points. In six districts—Cleveland, Columbus, Dayton, Lorain, Toledo, and Youngstown—just one in three third graders are reading proficiently.
The silver lining is that most districts improved between 2025 and 2026. Cleveland did particularly well with an increase of more than 3 percentage points. But it was East Cleveland that really knocked it out of the park. The district jumped over 14 percentage points in 2026, and that’s after gaining more than 10 percentage points the previous year. In 2024, just one-fourth of East Cleveland third graders were proficient in reading, making it the worst performer among these districts. Two years later, half of its third graders are proficient and it’s clocking in as the second-highest performer behind Cincinnati.
Remember, East Cleveland is one of three districts that were placed under an ADC by the state due to chronic low performance. It’s worth noting that there was a marked difference between the improvement plans put forth by these districts in 2021. East Cleveland’s plan was rigorous, detailed, and user-friendly. Youngstown and Lorain, not so much. Fast forward a few years, and East Cleveland is on the rise while the other two continue to struggle. Not only does Lorain have the lowest third grade reading proficiency (30.2) among the districts included here, it also falls into the bottom five of all districts statewide. Not five percent—five period. There’s only one district in all of Ohio (Mt. Healthy City) that had a lower rate than Lorain. Youngstown, meanwhile, joins Lorain in the bottom five and posted the biggest drop in proficiency among these districts, with a decline of more than 5 percentage points between 2025 and 2026.
The “improving K–3 literacy” measure is another element within the early literacy component that’s worth a closer look. It uses the results from fall diagnostic assessments to determine the percentage of students who move from “not on track” to “on track” in reading from one year to the next. These results indicate how well schools are improving K–3 literacy throughout all the early grades, thereby identifying schools and districts that are making critical progress with struggling readers. Table 2 displays the overall percentage of students each district moved to on-track status over the four most recent school years, as well as the difference between 2025 and 2026 results, with green shading indicating improvement and red a decline.
Table 2. Results for the improving K–3 literacy measure on state report cards in selected districts
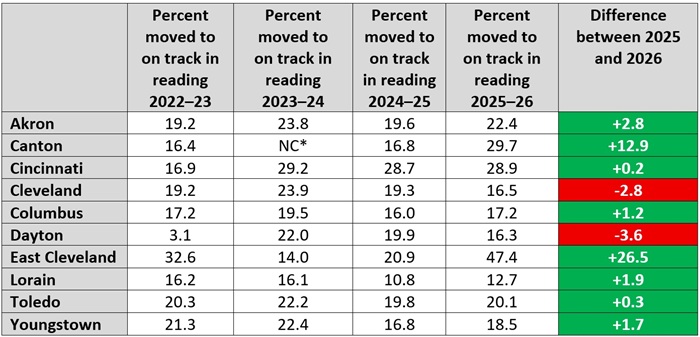
Once again, the numbers themselves aren’t great. The majority of these districts moved fewer than one-fourth of their struggling readers to on-track status in 2026. But there are some signs of improvement. All but two (Cleveland and Dayton) improved on their 2025 results. Canton impressively increased its rate by nearly 13 percentage points. But once again, it’s East Cleveland that steals the show. It moved almost half of its off-track readers to on track, an improvement of more than 26 percentage points.
***
While there are signs of hope among these results—looking at you, East Cleveland—there’s still a long way to go before the science of reading can be declared a success. To ensure the initiative lives up to the hype, state and local leaders need to double down on rigorous implementation efforts like regionally based instructional implementation teams and beefed-up professional development. In the meantime, though, Ohioans can feel cautiously optimistic that some of the state’s lowest-performing districts are already demonstrating improvement.

For more than a quarter century, public charter schools have served Ohio families and students seeking tuition-free educational options in their communities. As independently run public schools, charters are freed from district bureaucracy but in return for the autonomy, charters are expected to deliver improved achievement. Ohio’s accountability structure includes an automatic-closure provision for underperforming charters and a sponsor evaluation system that ensures these entities (of which Fordham is one) take seriously their responsibility to hold charter schools accountable.
As of 2025–26, charter schools served 122,143 Ohio students. About three in five charter students attended a conventional brick-and-mortar school, as opposed to a dropout-recovery or online school.[1] Of the state’s 247 brick-and-mortar charters, 180 are located in Akron, Canton, Cincinnati, Cleveland, Columbus, Dayton, Toledo, and Youngstown (the “Ohio Eight”).
We at the Fordham Institute typically focus on charter performance in the Ohio Eight. It’s where most charters are located and where the need to improve educational outcomes is the most urgent. Results from recent years—via both rigorous evaluations (including a new Fordham report arriving this month) and more basic report-card reviews, such as this piece—point in the same direction: Brick-and-mortar charters are moving the achievement needle in the right direction.
Did this pattern hold for the most recent school year? The short answer is yes, charters continue to outperform comparable districts. But as is typical, the data remind us also of how much work is still ahead.
Student achievement—performance index scores
To understand how charter students perform academically, we turn first to schools’ performance index scores. The index is a measure of achievement on all state exams that is akin to a proficiency rate—the percentage of students who “pass” an exam—but is more refined as it awards additional credit when students achieve marks above proficient. District-level index scores range from 54.1 (Lorain) to 112.9 (Solon), with a state average of 82.8.
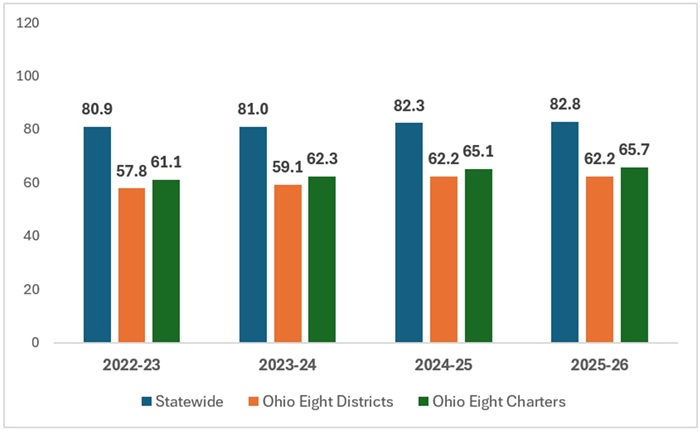
As Figure 1 indicates, the achievement of Ohio Eight charter students falls substantially below the state average, reflecting the large achievement gap between low-income urban students and their statewide peers. However, the charter-to-state achievement gap has narrowed slightly from 2022–23 (19.8-point gap) to 2025–26 (17.1-point gap). And in a more apples-to-apples comparison of pupil achievement, we also find that Ohio Eight charter students outperformed their Ohio Eight district counterparts (index scores of 65.7 versus 62.2, respectively).
Figure 1. Ohio Eight district and charter performance, 2022–23 to 2025–26
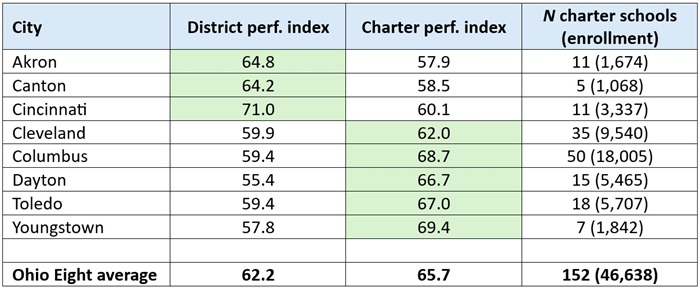
The next table disaggregates performance index scores by Ohio Eight city. Consistent with 2024–25 results, charter students in Cleveland, Columbus, Dayton, Toledo, and Youngstown outperform their district peers on this measure, with the widest margins in Dayton and Youngstown. On the other hand, charter students in Akron, Canton, and Cincinnati lag their district counterparts on the performance index.
Table 1. District versus charter school performance index scores, Ohio Eight cities, 2025–26
Student academic growth—progress ratings
The performance index provides an important point-in-time snapshot of where students stand academically. But it’s also influenced by demographics, which can obscure the true educational impacts of districts and schools. The state’s value-added growth measure (a.k.a., “progress”) helps us understand the effectiveness of schools apart from the demographics of their students. Schools that receive high ratings on the progress component are more effectively moving students up the achievement ranks, while those with poor ratings are allowing students to slip even further behind.
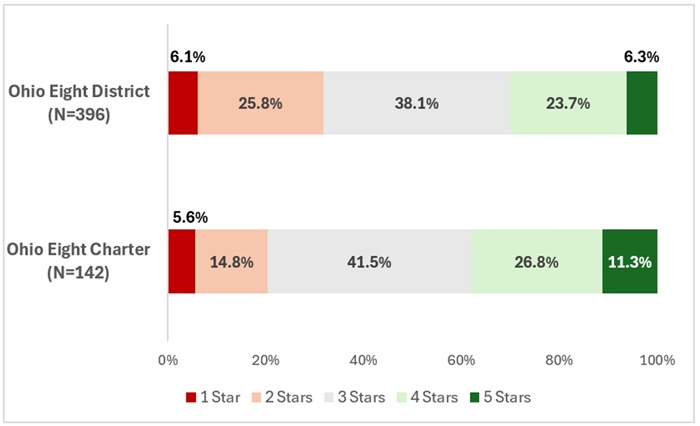
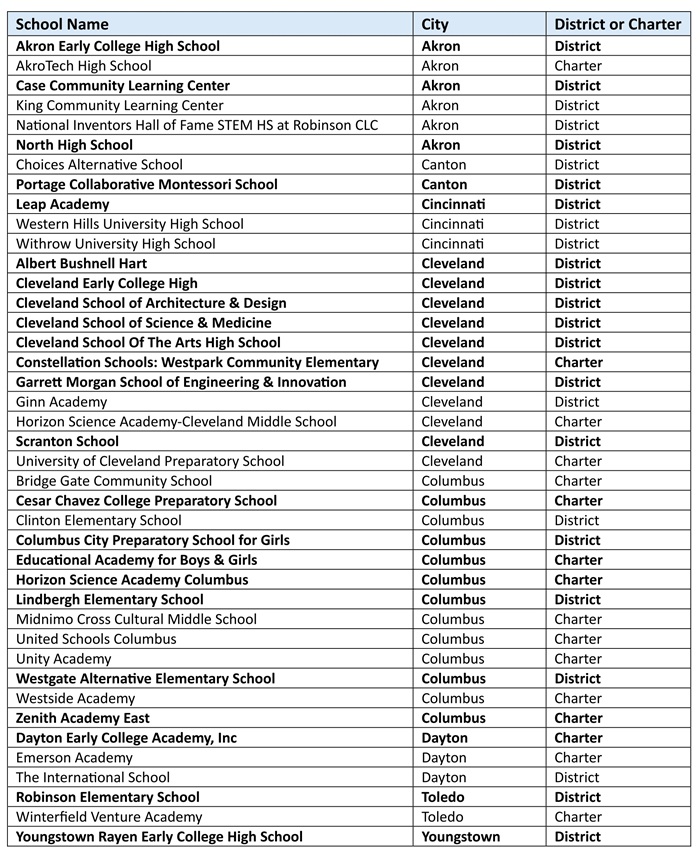
On this measure of academic growth, urban charter schools also outperform their district counterparts. In the Ohio Eight, 11 percent of charters received an impressive five-star progress rating, while just 6 percent of district schools achieved this mark. (Kudos to these standout schools, whose names appear at the end of this piece.) Meanwhile, another 27 percent of charters received four stars compared to 24 percent of district schools. Taken together, 38 percent of urban charters demonstrated evidence of positive academic impacts—receiving four or five stars—while just 30 percent of district schools did so. Stronger charter progress ratings relative to district schools were also visible in 2024–25.
Figure 2. Ohio Eight charter versus district performance, progress ratings, 2025–26
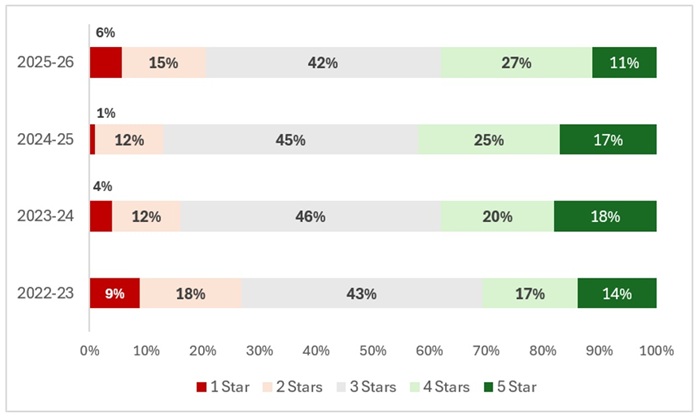
Despite their superior ratings vis-à-vis districts, the Ohio Eight charters suffered a slight setback in progress ratings compared to their own performance in 2024–25. As Figure 3 indicates, 42 percent of Ohio Eight charters earned four- or five-star progress ratings last year, but that number edged down to 38 percent in 2025–26. Conversely, more Ohio Eight charters received unsatisfactory progress ratings (one or two stars) in 2025–26 than the year prior. The most-common progress rating across all four years is three stars. This rating generally indicates that the average student held their position in the achievement distribution.[2] While this means a school met growth standards, it also suggests (in the context of a low-achieving school) that little progress was made to cut the achievement gap.
Figure 3. Ohio Eight charter schools’ progress ratings, 2022–23 to 2025–26
* * *
Public charter schools have become mainstays in Ohio’s urban communities. For some families and students, charters serve as a vital escape hatch from their assigned district school. Others select charter schools to gain access to specialized programs (e.g., arts), services (special education or gifted), or curricula (classical) that align more closely with their educational needs, values, and priorities. Still others choose charters dedicated to preparing first-generation students to attend and complete college. For most families, multiple reasons likely motivate their choice of school.
Thanks to the accountability and funding reforms instituted over the past decade, Ohio better ensures that students attend high-quality charters. This year’s data reinforce the wisdom of these reforms—charters continue to outpace nearby district schools on key measures—yet also signal the importance of building on them, as persistent achievement gaps remain and quality is still uneven across the sector. As discussed in multiple pieces, state and local leaders can and should more aggressively support public charter schools—most notably, through equitable funding and facilities resources—so they can both deepen the quality of their educational programs and widen their reach to serve more Ohio students. The charter sector also needs to uphold its end of the bargain, with sponsors holding schools accountable for results (including closing chronic underperformers) and school leaders rigorously implementing practices that drive higher pupil achievement. A supportive policy environment coupled with strong oversight and school-based leadership are the right ingredients for further advances in charter performance.
Table 2. Ohio Eight district and charter schools receiving five-star progress ratings, 2025–26
[1] In 2025–26, 28,901 students attended a general-education online school, and 22,919 students attended a dropout-recovery school, which can be either online or site-based.
[2] It could also indicate a lack of statistical precision in the value-added estimate. This is more likely to occur when a school has fewer students (as discussed in this piece by Fordham research fellow Stéphane Lavertu).
Dual enrollment (DE) programs allow students to take college courses for credit—usually at no cost—while still in high school. Students must pass the course in order to earn credit. Efforts to increase DE access mean more high schoolers than ever are taking college courses. This has many upsides, but also increases the likelihood that unprepared students will enroll in them and fail. A recent report tries to uncover what happens to students who don’t pass. Could participating in DE still hold value for them?
A group of researchers from WestEd looked at data on more than 1.7 million California public high school students[1] who entered ninth grade between 2015–16 and 2018–19. The current DE framework in the state dates to 2016 and was meant to expand access to college-level coursework—particularly for low-income students, students of color, and first-generation college-goers—by reducing previously identified barriers to DE participation. Features include removing a number of academic prerequisites, focusing on community college coursework, and bringing instruction directly to high schools rather than requiring teenagers to travel to campuses. The majority of the full sample (55 percent) was Hispanic, and 73 percent were from low-income families, reflecting California’s overall student demographics. The researchers broke sample students into one of three groups: those who never enrolled (Never DE), those who enrolled and never failed a course (Passed DE), and those who took and failed at least one course (Ever Failed DE).
Perhaps surprisingly, the vast majority of California high schoolers (1.6 million, or 94 percent) never took a single DE course in that time.[2] Of the remainder, just over 93,000 took and passed their DE courses, while approximately 18,700 (17.1 percent) failed at least one such course. Students in the Passed DE group were demographically similar to the full sample, but students in the Ever Failed DE group were disproportionately Hispanic (65 percent) and from low-income families (83 percent). Students in the Ever Failed DE group were also lower achieving on average than their peers (46th vs 61st percentile in math). While low-income status was a strong predictor of DE course failure, the researchers note that the better prepared a low-income student was before attempting DE—i.e., higher performance on the state’s eighth grade math assessment—the weaker the influence of family income.
Because DE enrollment is not random, the researchers used inverse probability weighting to approximate the impact of failing one or more DE courses on a student’s likelihood of enrolling in college after graduation. They found that students in the Ever Failed DE group are 10–12 percentage points less likely to enroll in college within 18 months of high school graduation compared to their peers in the Passed DE group. The more courses failed, the higher the college enrollment “penalty.” There was no difference in these outcomes between students in different socioeconomic groups. However, the average student in the Ever Failed group was still 6 percentage points more likely to enroll in college than the average student who never attempted DE at all.
All of this is consistent with similar findings around students who take and fail AP tests, with a spokesperson saying that “studying hard, preparing for the exam, following through — can change the way students see themselves and raise their ambitions for college.” The WestEd researchers (and other analysts) conclude from their findings that efforts to remove barriers to DE participation for lower-income students and students of color provide value for those students, regardless of whether they pass their college courses. This appears to be modestly true when college enrollment is the only outcome under scrutiny, but that should not be the end point of the discussion. The more academically prepared DE students are, the likelier they are to pass their courses and accrue credits that will be valuable in persistence and completion and, perhaps, in reducing college costs along the way. In other words, high schools should give more of their students access to DE, but they should also make sure that they are academically ready for the work before they start.
SOURCE: Jenna Howard Terrell, et al., “Course Failure in Dual Enrollment and the Impact on College-Going,” Annenberg Institute at Brown University (July 2026).
[1] The term “district” is used throughout the report and there is no indication whether charter school students are included in the analysis.
[2] There is no formal discussion in the report as to why this number is so high, but Advanced Placement (AP) and International Baccalaureate (IB) participation is longstanding and widespread in California. For comparison, 13 percent of Ohio high school students took at least one DE course in 2022–23.