This is the fourth and last piece in a series that examines elements of Ohio’s school report card that could use refinement (previous articles covered chronic absenteeism, early literacy, and college and career readiness).
A wave of news stories and commentary have raised alarms about the grade inflation plaguing American high schools and universities. Report cards chock-full of easy A’s hide the truth from parents, weaken incentives to learn, create cultures of low expectations, cheapen grades and the diplomas based on them, and may even diminish students’ long-term economic prospects.
Unfortunately, grade inflation has also crept into Ohio’s school report card system (and other states, too), with many of the same consequences accruing to students, parents, and the general public. Peachy school ratings are most apparent and troubling in the “Overall” ratings given to Ohio schools.
The Overall rating and its mechanics
For more than two decades, Ohio has issued an Overall rating to districts and schools. This “summative” mark is supposed to offer a clear and user-friendly picture of academic performance across the various report card measures. Table 1 shows the current framework used to combine results. Each component contributes a certain weight to the Overall calculation, with “Achievement” (student proficiency) and “Progress” (academic growth) receiving the greatest emphasis. Starting in 2023, Ohio began issuing Overall ratings via a 1- to 5-star system.
Table 1: Ohio’s report card components and weights for calculating an Overall rating
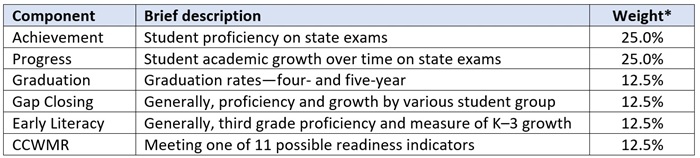
The Overall rating offers an essential bottom-line that helps the general public make sense of the disparate ratings and education data. The weighting system is sensible, too, as it rightly ensures that student proficiency and growth drive the ratings. Stars are transparent and easy to understand, albeit softer-sounding (for mediocre to low performers) than the state’s previous A–F system.
The inflationary problem, however, lies in the technical details. Specifically, the way Ohio translates the points earned on the various components into an Overall rating. Simply put, the method results in higher Overall ratings than what we would expect based on schools’ underlying results.
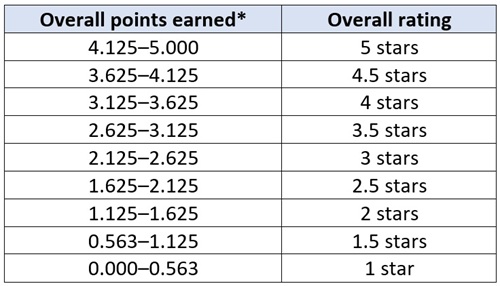
Table 2 displays the grading scale, with the left column representing the total points earned on the components and the corresponding Overall rating on the right. It’s hard to see at first, but upon close inspection, there is a significant misalignment between the points earned (based on the components) and the star rating. For instance, a school receiving 4.125 points receives 5 stars, even though its point total is closer to 4.5 stars. At the bottom of the scale, a school earning 0.75 points receives 1.5 stars, even though the 1-star rating is the nearest mark.
Table 2: Grading scale for the Overall rating
How the grading scale inflates ratings
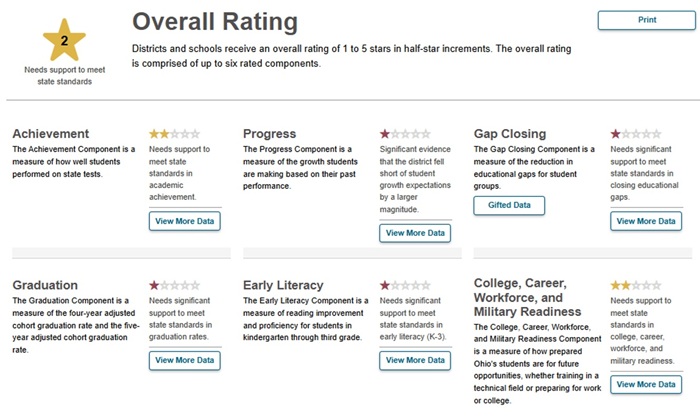
What are the real-world implications of this grading scale? Consider the report card for Valerie Elementary School in Dayton. It receives 1-star ratings on all of its components, yet strangely enough, receives a 1.5-star Overall rating. Another oddball is Lima City Schools. Despite receiving 1-star ratings on four of six components (including a heavier weighted one), the district ended up with a 2-star Overall rating.
Figure 1: Valerie Elementary (top) and Lima City Schools (bottom) report card, 2024–25
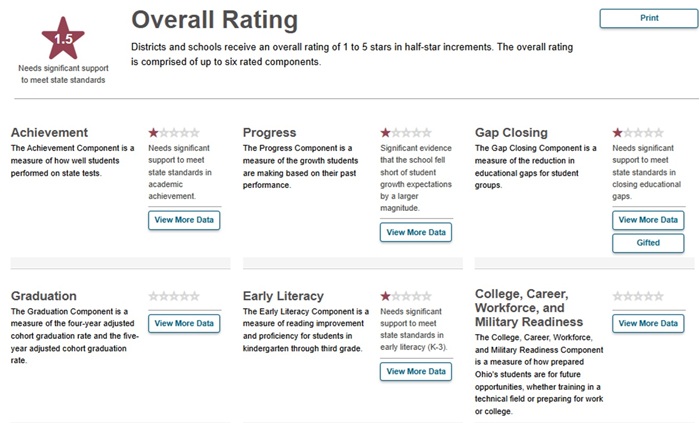
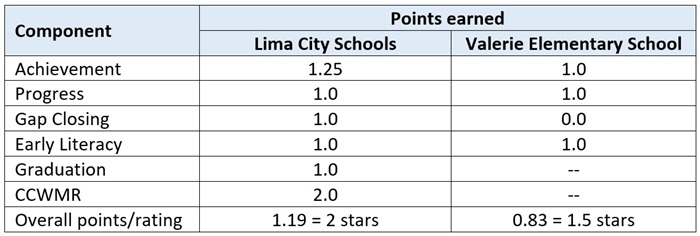
These counterintuitive Overall ratings are the direct result of the grading scale. As Table 3 shows, Lima City Schools earned 1.19 overall points, but that total was generously “rounded up” all the way to 2 stars. Valerie’s 0.83 points generated 1.5 stars, even though the point total was closer to the 1-star mark.
Table 3: Examples of Overall rating calculations
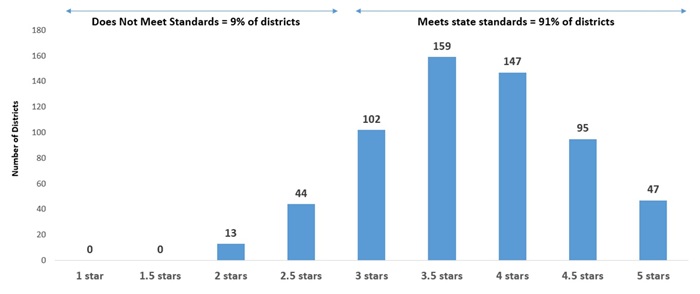
The lenient grading system gives schools statewide a roughly half-star boost. As Figure 2 shows, far more districts received top marks last year than low ratings. In fact, not a single district received 1 or 1.5 stars. The chart also indicates that 91 percent of districts received an Overall rating of 3 stars or above, which state law interprets as “meeting or exceeding state standards,” while just 9 percent of districts received less than 3 stars.
Figure 2: District-level Overall ratings, 2024–25
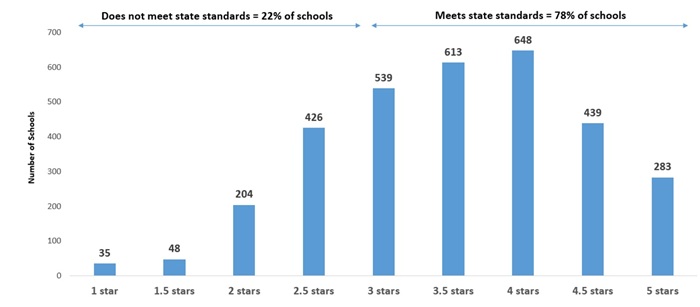
At a school level, Figure 3 shows that 78 percent of Ohio schools received 3 stars or above versus 22 percent below that mark. Just 2.5 percent of schools received an Overall rating of 1 or 1.5 stars. Roughly one third of the low-rated schools were early elementary schools for which the more conventional Achievement and Progress ratings did not apply.
Figure 3: School-level Overall ratings, 2024–25
Raising the bar
Much like inflating student grades is not a “victimless crime,” taking it easy on schools also hides the truth from parents and the public. Ohio’s Overall rating system deems 9 in 10 districts as “meeting state standards,” a rate that is out-of-touch when only 6 in 10 students achieve proficiency on state exams and many have struggled to recover academically post-Covid. Softened ratings also allow low-performing districts and schools to escape public scrutiny and accountability from local communities. For instance, Lorain and Dayton school districts registered abysmal proficiency rates of 25 and 27 percent, respectively, and demonstrated no evidence of academic progress last year. Yet both received 2 stars Overall—a semi-decent rating that papers over students’ academic challenges and the ineffective instruction they receive from their schools. Without a red flag, few community members will likely be stirred to ask questions or push for improvements. Parents may be lulled into thinking their child’s district or school is satisfactory when superior options are at hand.
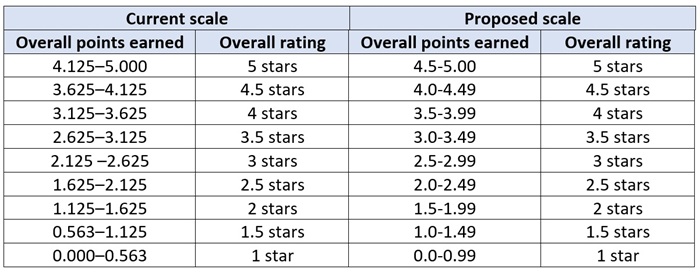
Ohio needs to bring its Overall ratings back to reality. The simplest approach is revising the grading scale, which the Ohio Department of Education and Workforce can modify through administrative rule. Table 4 shows a straightforward option that would raise performance benchmarks and alleviate some inflationary pressure. Under this framework, 4.5 to 5.0 points would be needed to earn an Overall 5-star rating, 4.0 to 4.5 points would generate 4.5 stars, and so forth. This grading scale would more tightly align component ratings with the Overall star ratings, while also removing the artificial bump that schools systematically receive. For instance, under the proposed framework, Valerie would have received 1 star and Lima 1.5 stars Overall—marks that are more consistent with their underlying component ratings.
Table 4: Proposed change to the Overall grading scale
The Overall rating is the most important and visible way that Ohio communicates school quality to parents and the general public. Schools that merit solid Overall ratings should receive them, and failing schools should be clearly identified as needing significant help. Unfortunately, the state’s current method for producing its summative rating misses the mark. Ohio policymakers need to recalibrate the Overall grading scale to give parents and communities an honest bottom-line assessment of school and student performance.