Ohio’s high school graduation requirements have long been subject to intense policy debate. Some argue that standards should align to the expectations of colleges and employers, while others argue for more relaxed standards that make diplomas easier to attain.
This report examines Ohio’s current requirements as well as recent trends in high school graduation and student achievement. It uncovers large discrepancies in graduation and proficiency rates, indicating that many students leave high school without a strong academic preparation. The report concludes by calling on state leaders to ensure that all students graduate well-prepared for their next steps.
Read the report below, or click here to download the full report.
Acronyms and definitions
Ohio Department of Education and Workforce (DEW) is the state agency responsible for overseeing the implementation of K–12 education policies.
An industry-recognized credential (IRC) is a credential or certificate signifying that an individual has acquired certain technical skills. As of August 2025, DEW had approved 693 IRCs that can be used to meet career-tech-based graduation options. Each credential is assigned a point value, ranging from one to twelve, and students must accumulate credentials worth at least twelve points to meet certain graduation requirements.[1]
End-of-course exams (EOCs) are state assessments administered when students complete specific courses. Ohio currently administers five high school EOCs in Algebra I, Geometry, English II, Biology, U.S. History, and U.S. Government. Students must pass the Algebra I and English II exams to graduate, though alternatives are provided for students who fall short of the state’s passing score.
This report focuses on the four-year graduation rate—i.e., the percentage of students in a cohort who graduate “on-time,” or within four years of entering ninth grade for the first time.
The Ohio Graduation Tests (OGTs) were the state’s previous set of high school exams, given prior to introduction of the EOCs in 2014–15. Students in the classes of 2007 to 2017 were required to pass the OGTs to graduate.
Executive summary
High school diplomas—and the graduation rates based on their receipt—have long been held as markers of educational attainment and success. In 2024, Columbus superintendent Angela Chapman touted the district’s 83 percent graduation rate as being “stronger than ever before.” Cleveland school leaders have routinely trumpeted the district’s soaring graduation rate. In Akron, a city councilman recently defended the district superintendent, writing “What you cannot deny is the district’s 88.1 percent graduation rate.”
There is no denying these record-breaking numbers. But do they actually signify that a vast majority of students exit high school ready for success? Or do they simply reflect a low bar—getting ever lower—that underlies today’s diplomas?
This report argues that mediocre standards, not widespread academic success, are behind swelling graduation rates in the Buckeye State. The first section discusses Ohio’s current graduation requirements, and the recent policy debates and shifts that helped shape them. The next section documents just how out-of-sync graduation rates have become with student proficiency on state exams given to high schoolers. Finally, the report examines two factors that explain the large discrepancy between graduation and proficiency rates: (1) the low score needed to “pass” the state’s Algebra I and English II exams, the two key tests that factor into graduation requirement, and which are usually taken in eighth to tenth grade; and (2) the presence of a lower-level career-tech alternative route for students who struggle on these exams.
Here are the key findings.
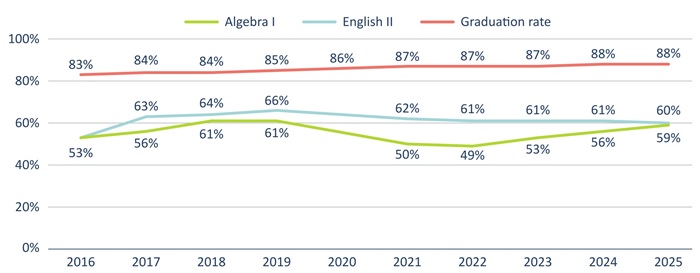
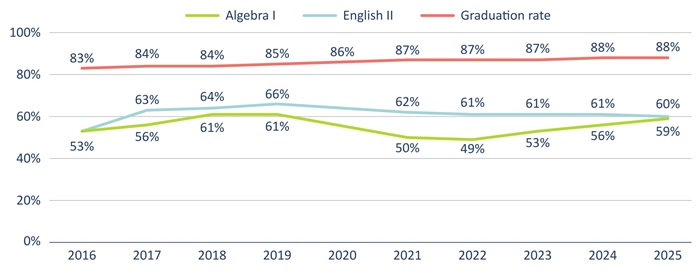
1. Statewide graduation rates continue to increase, and currently exceed state proficiency rates on Algebra I and English II exams by more than 25 percentage points. The figure below demonstrates the steady rise in Ohio’s four-year graduation rate from 83 percent in 2015–16 to 88 percent in 2024–25. That rise has occurred even as high school proficiency rates fell sharply during the pandemic, and remain below the pre-pandemic marks posted in 2018–19. The diverging trends—increasing graduation rates versus slumping proficiency rates—result in a noticeable disparity between the two measures. In 2024–25, Ohio’s graduation rate stood 29 and 28 percentage points above the Algebra I and English II proficiency rates, respectively. This large discrepancy suggests that thousands of Ohio students receive diplomas despite lacking the solid math and reading skills that are essential to college and career success.
Figure ES-1. Statewide graduation versus high-school proficiency rates 
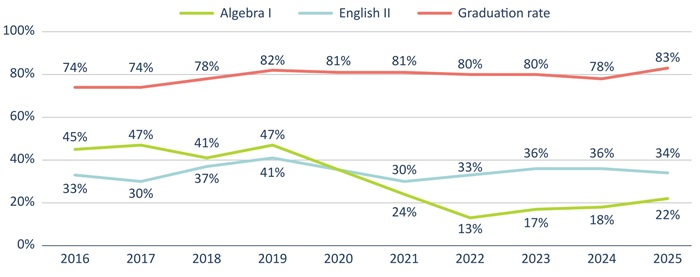
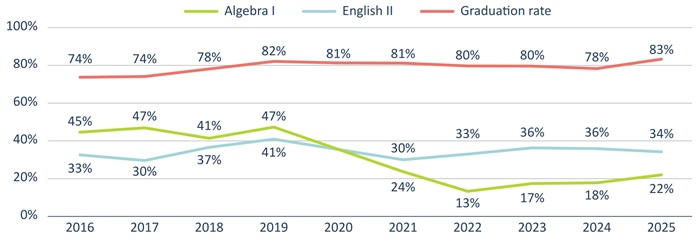
2. The graduation-proficiency gap reaches 40 to 60 percentage points in large urban districts. All but one of the Ohio Eight districts[2] report graduation rates above 70 percent, despite just a quarter to half of their students scoring proficient on high school exams. Columbus City Schools, for example, posts an 83 percent graduation rate, even though just 34 percent of students score proficient in English II and 22 percent achieve that mark in Algebra I. Tables 2 and 3 in the report show similarly large disparities in graduation and proficiency rates in the other Ohio Eight districts, as well as other districts across the state.
Figure ES-2. Graduation versus high school proficiency rates, Columbus City Schools
3. The graduation-proficiency gap can be explained by a low “competency” score needed to meet exam-based requirements, along with the introduction of a weaker career-technical alternative. To graduate, Ohio requires students to achieve a state-defined “competency” score on the Algebra I and English II exam, or to meet an alternative requirement. The competency benchmark is set significantly below the “proficient” standard, and is well beneath a true “college-ready” target (see below for details). A low passing score allows many students to meet graduation requirements even though they have not demonstrated proficiency in high school level English and math.
For students failing to reach the competency bar after a mandatory test retake, the state offers a “career experience and technical skill” pathway. This requires students to acquire industry credentials, pass career-technical course assessments, or meet one of several other measures. Data from school districts with low achievement data suggest that substantial numbers of students now graduate with the help of this less-demanding option (see Table 6 below). In Youngstown, for example, 85 percent of students graduate on-time, despite an Algebra I proficiency rate of just 27 percent. Yet we also discover that 59 percent of the district’s most recent graduating class earned industry credentials during high school—more than twice the state average—and 45 percent passed career-tech assessments, almost double the state average. These numbers suggest that a sizeable number of Youngstown students graduated by virtue of the career-tech alternative.
Permitting students to graduate via career-tech pathways might make sense if those pathways effectively prepare them for careers. But a closer look at the credentials earned reveals troubling patterns. In Akron, students have collected large numbers of retail certificates, while in Columbus and Youngstown, students have racked up credentials in national emergency management. These certificates might have value to students with strong academic skills or to professionals already working in the field, but they are unlikely to open rewarding opportunities for students who have not even demonstrated basic competency in math and English. Unfortunately, what is more likely happening is that schools have discovered ways to work around the academic requirements by funneling students into lower-level career-tech programs just to get them a diploma.[3]
***
Ohio policymakers have consistently talked a good talk about readying students for college and career. But they haven’t always walked the walk. Graduation standards have slid, and diplomas are quickly becoming participation trophies rather than well-earned prizes that signify students’ readiness for post-high-school success.
To state leaders, we ask this: Please strengthen graduation requirements to require “competency”—if not “proficiency”—in Algebra I and English II (at least) as an unwavering condition of earning a diploma. No matter their aspirations, every student must exit high school with solid reading, writing, and math skills. We also know that, with hard work, determination, and the right support, every Ohio student has what it takes to achieve that baseline standard. Rather than giving away counterfeit diplomas that lead nowhere, let’s hold the line on academics and see where a next generation of well-prepared young people take our state.
Ohio’s graduation requirements: Past and present
The value of a high school diploma has long been debated. More than forty years ago, UCLA professor James Popham argued that “U.S. citizens believe that a high school diploma means little today,” and went on to propose minimum competency tests that would “restore meaning to the high school diploma.”[4] About the same time, A Nation at Risk noted that, in many high schools, learning to cook or drive had as much bearing on graduation as math and English. That landmark report proposed minimum course requirements in the academic subjects, and also recommended use of standardized exams that would “certify the student’s credentials.”[5]
To address concerns about graduation standards, states began to implement both course requirements and exit exams during the 1980s and 1990s.[6] Here in Ohio, lawmakers instituted a ninth-grade competency test that required students starting in the class of 1994 to pass its reading, writing, math, and citizenship sections.[7] Yet the earliest competency exams—in Ohio and elsewhere—were criticized as low-level and not aligned to the expectations of colleges and employers.[8] In an effort to raise the bar, Ohio transitioned to the Ohio Graduation Test. Under that system, students, starting with the class of 2007, were required to achieve proficiency on five statewide tests (reading, writing, math, science, and social studies). But with passage rates ranging between 80 and 90 percent by 2011,[9] and with many considering the tests to be roughly eighth-grade level, policymakers sought to increase the rigor yet again.[10]
In a package of reforms passed in 2014, Ohio introduced a next generation of high school graduation standards and assessments.[11] Students in the class of 2018 and beyond were required to achieve a state benchmark on seven end-of-course exams (EOCs) in Algebra I, Geometry, English I and II, U.S. History, U.S. Government, and Biology. The exam-based pathway was envisioned as the route that most students would take to graduation, although lawmakers added two alternate routes to the diploma: (1) Earn a remediation-free ACT/SAT score, or (2) attain industry credentials and pass WorkKeys, a workforce development exam.
The new diploma requirements set off a raucous debate, with education groups complaining that this time lawmakers had set the bar too high—the EOCs were tougher than the softball OGTs—and warning of a “graduation apocalypse.”[12] Amid prolonged debate, the legislature approved stop-gap measures for the classes of 2018 through 2020 that allowed students, in lieu of passing EOCs, to graduate based on extremely weak options such as satisfactory attendance, an acceptable grade point average, or completing an ill-defined “capstone” project.[13][14] Some advocates pushed to make these weak alternatives permanent, but lawmakers declined and settled on “long-term” requirements that were supported by Fordham and others.
Starting with the class of 2023, these requirements aim to preserve an objective, exam-based component but also make significant modifications that softened requirements relative to the original system enacted in 2014. These include a reduced number of exams that factor into graduation: The state’s Geometry, Biology, U.S. History, and U.S. Government EOCs no longer play a serious role in meeting graduation requirements, and the English I exam was simply scrapped. Moreover, the state also relaxed the career-tech alternative by removing the WorkKeys testing requirement and adding several other options.[15] Under current requirements, students must do all of the following to graduate:
Complete course requirements: Following long-standing policy, earn at least twenty credits, with a certain number of credits in specific subjects (e.g., four each in math and English).[16]
Earn two diploma “seals”: Earn at least two seals out of twelve possible options. Due to the relative ease of attaining several of the seals, this requirement is not very challenging. Appendix A lists the seals and includes a brief description of each.
Demonstrate competency: Meet either the exam-based academic pathway or complete one of four alternatives.
To meet the main academic pathway, the one based on exams, students must achieve a “competency” score of 684 or above on the state’s Algebra I and English II EOCs, which are usually taken in eighth to tenth grade. It’s important to understand that this score is beneath the “proficient” cut score of 700, and it falls substantially below the “college- and career-ready” benchmark of 725. While the decision to set the graduation mark below a bona fide college-and-career ready score is sensible—that is a truly ambitious target for most students—the move below proficient represents another form of softening. Today, all students need to do is score in the “basic” range, which indicates only “partial command” of state standards and, as studies indicate, diminishes their likelihood of attending and succeeding in college.[17]
Figure 1. Algebra I scaled scores and corresponding achievement benchmarks

The state provides four alternative pathways for students who fall short of the competency standard on their first try and again on a mandatory retake. Three are reasonable options, as they are more closely tied to an objective measure of achievement. They include: (1) achieving a remediation-free ACT/SAT score,[18] (2) completing a dual enrollment course in the failed subject area,[19] or (3) enlisting in the military.[20]
A fourth alternative—a career-tech-oriented route—requires students to meet two of seven requirements, at least one of which must be a “foundational” option:
- Foundational options: (1) earn a cumulative score of proficient on at least three technical assessments (known as WebXams); (2) earn at least twelve points in the state’s industry credentialing system;[21] (3) complete a pre-apprenticeship or apprenticeship program; or (4) obtain a state-issued professional license.
- Supporting options: (1) complete at least 250 hours of a work-based learning experience; (2) pass the WorkKeys exam; or (3) attain the OhioMeansJobs readiness seal.
Creating a career-technical pathway makes sense, provided that fulfilling it actually signifies career readiness and serves as an acceptable substitute for academic proficiency. These questions hinge on the rigor of the underlying measures. Unlike state assessments and well-known college admissions and military enlistment exams, little information is available about the content and rigor of the WebXam technical assessments.[22] Moreover, as discussed below, some of the industry credentials that students can earn are of dubious rigor and value. By allowing for expansive yet questionable career-tech alternatives, state lawmakers may have also inadvertently lowered the bar for graduation.
Through the years, Ohio has struggled to maintain strict standards for graduation. Current requirements are no different. The “competency” standard is a relatively soft benchmark for academic performance, and the career-technical workaround leaves open the possibility that students graduate with neither the academic nor technical skills needed for success after high school. But how have these changes impacted graduation rates? How do these rates compare with trends in student proficiency? The next section dives into the data.
Soaring graduation rates, stagnant proficiency
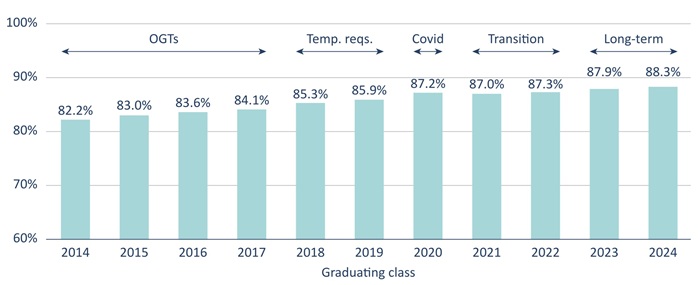
Historically, most Ohio students have graduated “on-time,” i.e. within four years of entering ninth grade. In recent years, however, graduation rates have climbed to unprecedented levels. As the chart below indicates, 82 to 84 percent of students graduated on-time during the last years of the OGT-driven standard. In the post-OGT era, rates rose higher still, topping 85 percent for the first time for the classes of 2018 and 2019, which were the cohorts that graduated under eased temporary requirements. Just over 87 percent of students in the Covid-impacted class of 2020 graduated on-time, and rates continued to climb to a remarkable 88 percent for the classes of 2023 and 2024, the first cohorts subject to the state’s current requirements.
Figure 2. Statewide four-year graduation rates, classes of 2014 to 2024
Graduation rates have marched upward not only statewide but also in most of Ohio’s large urban districts. As Table 1 indicates, graduation rates in the Ohio Eight ranged from 64 to 74 percent for the class of 2014. Since then, they’ve risen substantially in six of the eight districts, ranging from 69 percent in Dayton to 88 percent in Akron for the class of 2024.
Table 1. Four-year graduation rates in the Ohio Eight school districts, classes of 2014 to 2024
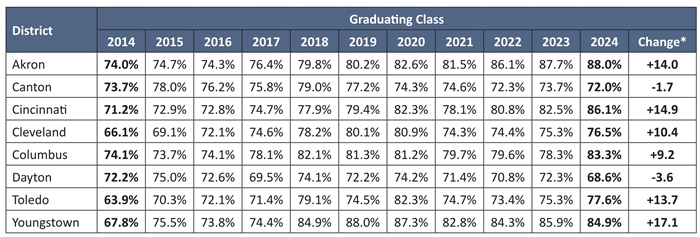
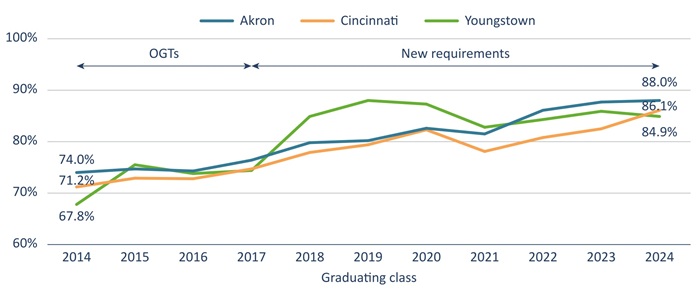
Figure 3 depicts the increases in Akron, Cincinnati, and Youngstown, all of which have posted double-digit gains in graduation rates over the past decade. The increases accelerated starting with the class of 2018—especially apparent in Youngstown—which coincided with the transition from the OGTs to new graduation requirements.
Figure 3. Four-year graduation rates in selected urban districts, classes of 2014 to 2023
Lofty graduation rates would be worthy of praise if they denoted true gains, which we can gauge by comparing those rates with student proficiency—a key measure of preparedness for life after high school, as it predicts performance on college-admissions exams and college-going rates.[23] Employers, too, routinely say that they seek individuals with strong analytical and communication skills, which proficiency in math, reading, and writing underpin.[24]
But here, we see that proficiency on state high school exams continues to lag far behind graduation rates. Figure 4 shows that Algebra I proficiency fell sharply during the pandemic—even as graduation rates continued to rise—though scores have recovered since 2021–22. English II proficiency rates likewise slid during the pandemic and remain virtually unchanged since then. The chart also shows a large disparity in graduation and proficiency rates—a gap of more than 25 percentage points in 2025. Reflecting the diverging trends in graduation and proficiency rates, the gap is wider today than it was in 2018–19.
Figure 4. Statewide graduation versus Algebra I and English II proficiency rates
Larger disparities emerge in the large urban districts. As Table 2 indicates, Algebra I proficiency rates in the Ohio Eight range from 22 to 47 percent, yet all but one of these districts register graduation rates above 70 percent. This results in graduation-proficiency gaps ranging from 28 percentage points in Canton to 61 points in Columbus. The table shows that these large differences are not a one-year phenomenon, as they were clearly evident in 2023–24 as well.
Table 2. Graduation versus Algebra I proficiency for the Ohio Eight districts, 2023–24 and 2024–25
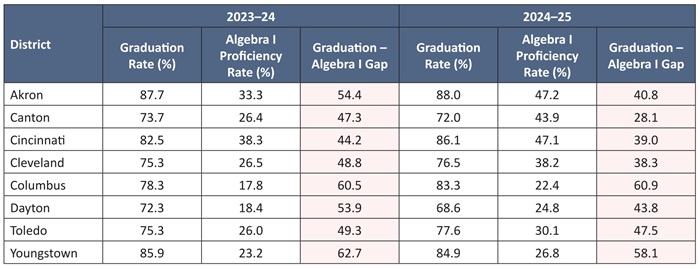
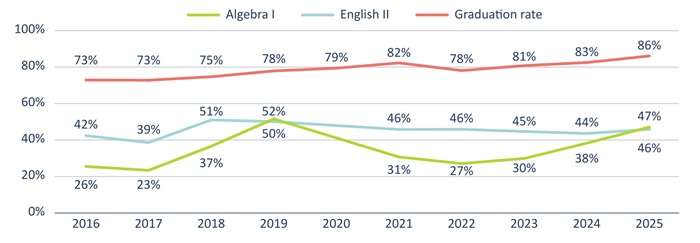
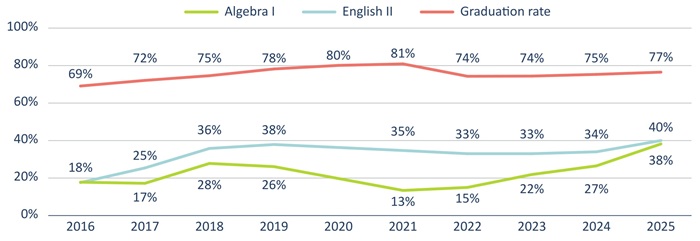
Figure 5 provides a longer-term view of the graduation-proficiency gaps in the three largest Ohio Eight districts. While graduation rates in Cincinnati, Cleveland, and Columbus have consistently topped 70 and 80 percent over the past decade, proficiency rates on the Algebra I and English II exams fall well below those marks.
Figure 5. Graduation versus Algebra I and English II proficiency rates, selected Ohio Eight districts
Cincinnati
Cleveland
Columbus
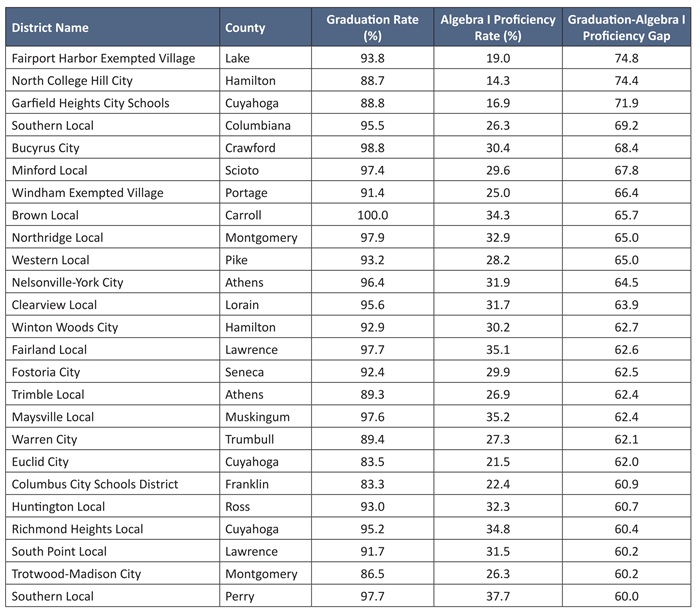
Sizeable differences in graduation and high school proficiency rates are not limited to the big-city districts. Table 3 shows the districts with the largest discrepancies based on Algebra I scores. In some of these districts, 90 to 100 percent of students graduate on-time, despite posting Algebra I proficiency rates below 40 percent, resulting in gaps exceeding 60 percentage points. A list based on the largest differences in English II proficiency and graduation rates appears in Appendix D.
Table 3. Twenty-five districts with the largest differences in graduation versus Algebra I proficiency rates, 2024–25
Overall, this section shows that thousands of Ohio students receive diplomas despite not having demonstrated high-school level proficiency on state English and math exams. The problem is especially acute in (though not limited to) urban districts where graduation rates often exceed 75 and 80 percent, even though roughly half that number achieve proficiency. The large disparity raises questions about how students are graduating—and whether they truly have the knowledge and skills needed for success after high school.
What’s going on?
How can it be that some districts graduate large majorities of students when just a quarter to half score proficient? And that statewide graduation rates have far outstripped proficiency rates? One obvious explanation is that Ohio does not align its academic requirement for graduation to its own “proficient” standard. Rather—as discussed above—it sets the bar considerably lower at “competency,” a mark that is at the very low end of the “basic” achievement level. Despite their shaky academic skills, allowing students scoring in the “basic” category to meet graduation requirements does narrow the graduation-proficiency gap. In Columbus, for instance, 53 percent of students score “basic” or above in Algebra I—more than double its 22 percent proficiency rate—which brings us closer to the district’s graduation rate of 83 percent.[25]
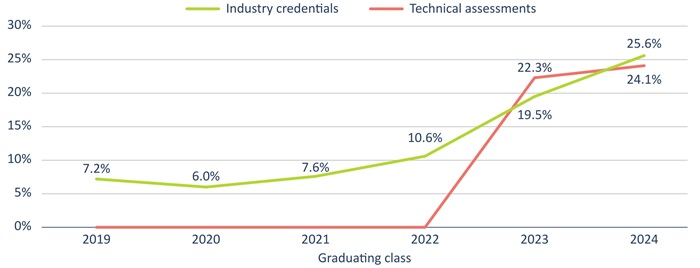
In addition to graduating students thanks to the lower-level competency mark, schools are also taking advantage of the state’s alternative pathways to graduation, most notably the career-technical option. Statewide, we see sharp increases in the number of students attaining industry credentials and passing three or more career-technical assessments, two of the key measures for this pathway. Prior to the class of 2023, roughly one in ten students earned industry credentials (technically, accumulating twelve or more points in the credentialing system). That rate almost doubled with the class of 2023, the first cohort subject to the current graduation requirements, and increased again to 26 percent for the class of 2024. While it does not appear that technical assessment data were being reported prior to 2023, almost a quarter of students in the classes of 2023 and 2024 passed three or more of those exams.
Figure 6. Statewide percentage of students earning industry credentials or passing career-technical assessments
Schools with more students who struggle academically would likely be more apt to encourage use of the career-technical alternative. Indeed, in low-achieving urban districts, we find substantial proportions of students meeting two of the key measures that can be used for this alternative. Table 4 shows that more than two-fifths of the class of 2024 in Akron, Columbus, Dayton, and Youngstown earned industry credentials—rates that are much higher than the statewide average. As for technical assessments, more than one-third of students in Akron and Youngstown met that measure in the class of 2024.
Table 4. Career-technical measures, Ohio Eight districts
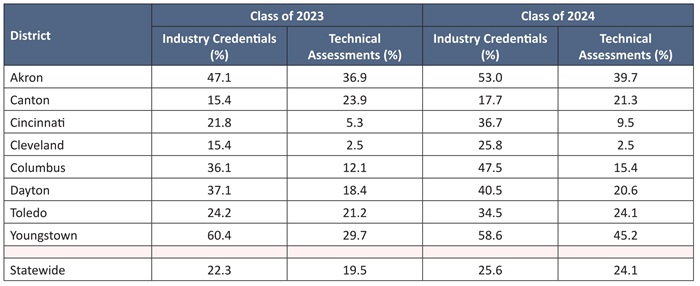
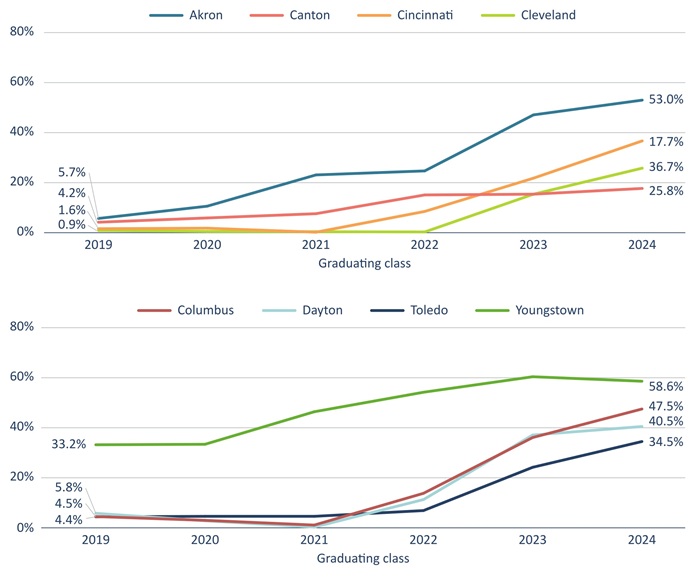
Figure 7 depicts the sharp increase in industry credential attainment across the Ohio Eight, starting with the class of 2023 in most of the districts. This jump in credentialing coincides with the transition to the current graduation requirements that provide students a career-tech pathway when they are unable to demonstrate competency in Algebra or English II.
Figure 7. Percent of graduating classes earning industry credentials, Ohio Eight districts
If the career-technical assessments and industry credentials were high-quality, the upward trends on these measures would be heartening. While little is known about the technical assessments—perhaps because they are relative newcomers to the state accountability system—we do know more about the credentials that students earn statewide and in the Ohio Eight. Table 6 displays the ten most frequently earned credentials for the class of 2024.[26] Several credentials rise to the top—retail certificates, national incident management certificates, and general first aid and job-safety certificates. Under Ohio’s graduation policies, students can “bundle” certain credentials to reach the twelve-point mark for graduation. Bundles that appear to be widely used are shown in Table 5 and highlighted in Table 6.
Table 5. IRC combinations that equal twelve or more graduation points
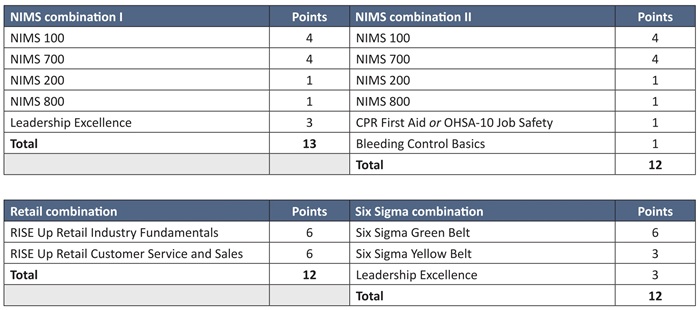
Table 6. Most commonly earned industry-recognized credentials, Ohio Eight districts and statewide, class of 2024
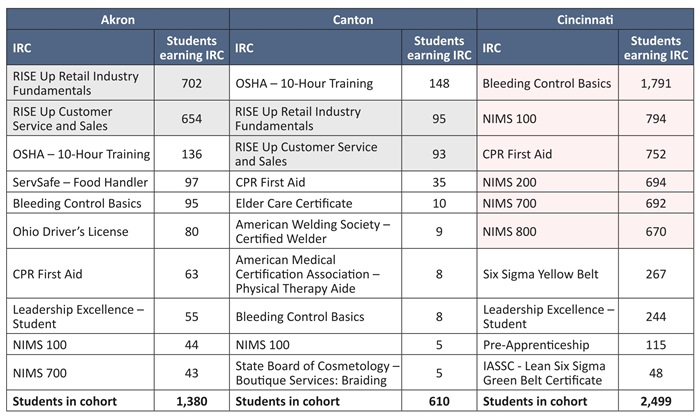
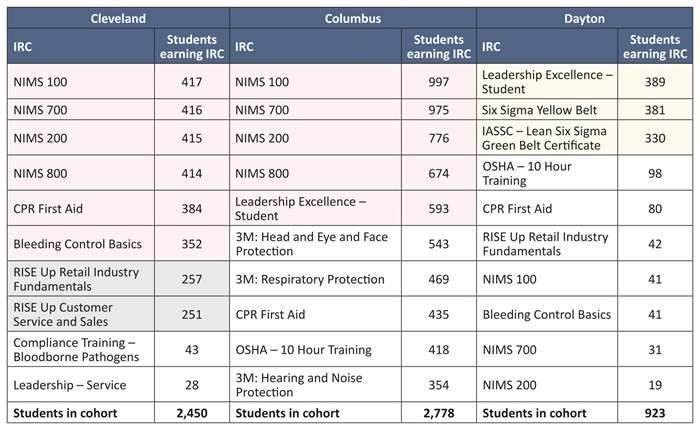
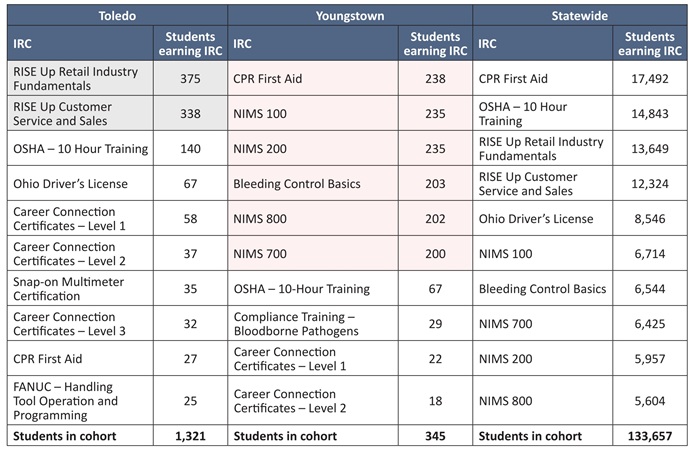
A serious career-technical pathway to graduation does have merit and is worth consideration. Ohio identifies and provides extra funding for high-priority industry credentials through the Innovative Workforce Incentive Program (IWIP)—credentials that would be more useful to students after graduation. Unfortunately, the overwhelming majority of the most-commonly-earned credentials are not on the IWIP list[27] and are of questionable value, particularly for students who have not demonstrated basic academic skills. The retail certificates, for instance, may not even be necessary to obtain entry-level positions, and are unlikely to help graduates advance beyond that, especially given their inadequate math and reading skills. The national incident management certificates are equally troubling. Do large numbers of Cleveland, Columbus, and Youngstown students intend to enter emergency management? What happens if they don’t? Do these specialized certificates have any value in other occupations?
In sum, while there isn’t anything inherently wrong about collecting credentials, the price low-achieving students pay is an opportunity cost. They would have likely been better off shoring up their academic skills—something that is of more certain value across all professions—rather than spending time pursuing credentials that do little to advance their careers or may quickly become obsolete.[28] Ohio policymakers have two options to clean up this mess. One, they could get serious about making sure all students graduate with solid academic skills by eliminating the career-tech alternative. Alternatively, they could keep a career-tech option. But if so, they must significantly tighten the pathway to ensure that meaningless credentials and low-level tests don’t count toward graduation.
Conclusion
Student effort and accomplishment should underpin the high school diploma, which should reflect young people’s striving to master core academic content, persevering when the going gets tough, and demonstrating knowledge and skill on an objective measure of achievement. When diplomas are truly earned—not just handed out—they empower young people and act as a gateway to a brighter future.
Unfortunately, too many students now receive diplomas that lead nowhere. As this report documents, large proportions of Ohio students are allowed to graduate without having achieved proficiency on state math and English exams. Some will argue that giving such students a diploma is the compassionate thing to do. But what happens when that graduate can’t find employment, gets stuck in a dead-end job, or drops out of college with only debt and regret? How is that kind-hearted?
A firmer but better-for-students approach is to require competency, or better yet proficiency (which is still below a true “college- and career-ready” mark), at least in Algebra I and English II, to graduate high school. No matter the direction students choose—whether it’s higher education or employment—they all need a solid academic foundation to succeed over the long-term.
Is that too much to ask of students? Consider the algebra assessment, which is largely taken in eighth and ninth grade. Students falling short should have multiple opportunities to retake the exam—and the underlying course, if necessary—as tenth graders, or even into their junior or senior years. It shouldn’t matter when students pass the Algebra I exam, or how many times they need to take it. What matters most is that they nail down the content before they exit high school. As for English II—a tenth grade-level assessment—three in five Ohio students already achieve proficiency on their first attempt. Is it an impossibility, especially with the state’s Science of Reading initiative underway, to reach four out of five? Or higher?
How about demographics, and equity considerations? Would a strict academic standard withhold diplomas from too many disadvantaged students? There is no doubt that many Ohio students face barriers to academic success. But the answer is not double standards and a lower bar. What they need instead are education leaders willing to hold them to the same standards as their more advantaged peers, while giving them the supports to meet those standards. Some Ohio schools already demonstrate that this can be done. In Steubenville, a district that serves mainly low- to mid-income households, 94 percent of students score proficient or above in Algebra I and 72 percent do so in English II. And in Cleveland, the district’s John Hay high schools serve predominately Black or Hispanic students, and about three quarters achieve proficiency on state exams.
Ohio should build its education policies upon the unwavering belief that every student can and will excel academically. It’ll take the right set of incentives, accountability systems, and supports to reach this ambitious goal. Will state policymakers have the courage to challenge Ohio’s high school students—and their schools—to achieve more? The state’s future hinges on how they answer that question.
Acknowledgments
I wish to thank my Fordham Institute colleagues Michael J. Petrilli, Chester E. Finn, Jr., Chad L. Aldis, Jessica Poiner, and Jeff Murray for their thoughtful feedback during the drafting process. Special thanks also to Alicia Anderson, who copy edited the manuscript, and Dave Williams who created the design.
— Aaron Churchill
Ohio Research Director, Thomas B. Fordham Institute
Endnotes
[1] More information about Ohio’s industry credentialing system is available here. Per legislation passed in July 2025, DEW will overhaul the IRC points system for future graduating classes.
[2] Akron, Canton, Cincinnati, Cleveland, Columbus, Dayton, Toledo, and Youngstown.
[3] For anecdotal evidence, see Patrick O’Donnell, “Credential Chaos: Career certificates boom in high school, but not all have value,” The 74 (September 18, 2025).
[4] W. James Popham, “The Case for Minimum Competency Testing,” The Phi Delta Kappan, Vol. 63, No. 2 (1981).
[5] National Commission on Excellence in Education, A Nation at Risk: The Imperative for Educational Reform (1983).
[6] Richard Coley and Margaret Goertz, “Educational Standards in the 50 States: 1990” in ETS Research Report Series.
[7] Peter Schmidt, “Ohio lawmakers attack four-tiered-diploma system,” Education Week (February 27, 1991).
[8] Achieve, Ready or Not: Creating a High School Diploma That Counts (2004).
[9] Federal policy pressured states to lower graduation standards and (if they adopted them) implement soft exit exams, as graduation rates became a component of school accountability systems. For a summary and analysis, see Doug Harris, “Are America’s rising graduation rates real—or just an accountability-fueled mirage,” Brookings Institution (March 2, 2020).
[10] Tom Gunlock, “Is a 10th-grade education too tough for an Ohio diploma?” Dayton Daily News (March 22, 2017).
[12] Patrick O’Donnell, “A third of high school juniors might not graduate next year, officials warn,” Cleveland Plain Dealer (November 13, 2016).
[13] Temporary requirements for the classes of 2018 to 2020 were enacted via House Bill 49 and House Bill 491 of the 132nd General Assembly. With Covid bearing down on schools, lawmakers further softened requirements for the class of 2020 via House Bill 197 of the 133rd General Assembly.
[14] As passed in House Bill 166 of the 133rd General Assembly, the classes of 2021 and 2022 were initially required to meet transitional requirements, either meeting one of the “original” three options or the new “long-term” requirements. However, with Covid still a concern, the legislature softened those requirements by allowing students in those cohorts to substitute course grades for exam results; see, House Bill 67 of the 134th General Assembly.
[15] House Bill 166 of the 133rd General Assembly established the long-term requirements.
[16] One credit is equivalent to a year-long course of at least 120 hours. For more about the course requirements, see here.
[17] For data showing that students with higher high school state test scores tend to perform better on the ACT, see an Ohio Department of Education analysis (2019). A forthcoming Fordham report will demonstrate correlations between eighth grade and EOC test scores and actual college-going rates.
[18] For more on the college remediation-free scores, which are established by the presidents of Ohio’s public universities, see here.
[19] Eligibility for dual enrollment (a.k.a., College Credit Plus) generally requires students to achieve remediation-free scores on the ACT/SAT or have a satisfactory GPA. For more, see here. To meet this requirement, students also have to pass a college-level course.
[20] Military enlistment requires applicants to pass the Armed Services Vocational Aptitude Battery (ASVAB), which includes reading and math sections. For more, see here.
[21] The twelve-point threshold applied for the classes of 2018 to 2025. The “points” system will be restructured per recently passed provisions in House Bill 96 of the 136th General Assembly. For more about Ohio’s industry credentialing system, see here.
[22] Some information is available online at https://news.webxam.org/. However, no data were located about how many students take the assessments (and which courses they align to) or what passage rates are.
[23] See footnote 17 for sources.
[24] See for example, World Economic Forum, Future of Jobs 2020: Insight Report (May 2023).
[25] Adding students who achieve competency upon a retake the next year—the “basic” and “proficient” numbers reported by the state generally reflect first-time test takers—would also narrow the achievement-graduation gap.
[26] The most commonly earned IRCs for the class of 2023 are available in a prior analysis.
[27] Of the credentials that appear in Table 6, only the welding and physical therapy certificates (Canton); the FANUC handling certificate (Toledo), and Six Sigma Greenbelt (Cincinnati and Dayton) appear on the IWIP credential list, which is available here.
[28] For recent pieces raising concerns about overly specialized training, while stressing the importance of academics; see, Eric Haunshek, “German-Style Apprenticeships Simply Can’t Be Replicated,” Wall Street Journal (June 18, 2017) and Moh Hosseinioun, et. al., “Soft Skills Matter More Than Ever, According to New Research,” Harvard Business Review (August 25, 2025).