For more than a quarter century, public charter schools have served Ohio families and students seeking tuition-free educational options in their communities. As independently run public schools, charters are freed from district bureaucracy but in return for the autonomy, charters are expected to deliver improved achievement. Ohio’s accountability structure includes an automatic-closure provision for underperforming charters and a sponsor evaluation system that ensures these entities (of which Fordham is one) take seriously their responsibility to hold charter schools accountable.
As of 2025–26, charter schools served 122,143 Ohio students. About three in five charter students attended a conventional brick-and-mortar school, as opposed to a dropout-recovery or online school.[1] Of the state’s 247 brick-and-mortar charters, 180 are located in Akron, Canton, Cincinnati, Cleveland, Columbus, Dayton, Toledo, and Youngstown (the “Ohio Eight”).
We at the Fordham Institute typically focus on charter performance in the Ohio Eight. It’s where most charters are located and where the need to improve educational outcomes is the most urgent. Results from recent years—via both rigorous evaluations (including a new Fordham report arriving this month) and more basic report-card reviews, such as this piece—point in the same direction: Brick-and-mortar charters are moving the achievement needle in the right direction.
Did this pattern hold for the most recent school year? The short answer is yes, charters continue to outperform comparable districts. But as is typical, the data remind us also of how much work is still ahead.
Student achievement—performance index scores
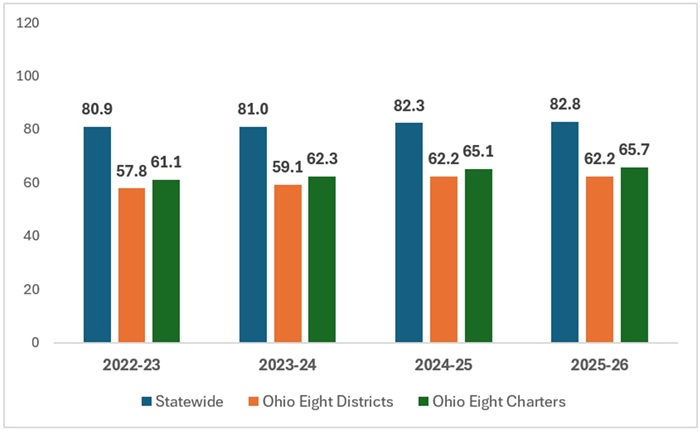
To understand how charter students perform academically, we turn first to schools’ performance index scores. The index is a measure of achievement on all state exams that is akin to a proficiency rate—the percentage of students who “pass” an exam—but is more refined as it awards additional credit when students achieve marks above proficient. District-level index scores range from 54.1 (Lorain) to 112.9 (Solon), with a state average of 82.8.
As Figure 1 indicates, the achievement of Ohio Eight charter students falls substantially below the state average, reflecting the large achievement gap between low-income urban students and their statewide peers. However, the charter-to-state achievement gap has narrowed slightly from 2022–23 (19.8-point gap) to 2025–26 (17.1-point gap). And in a more apples-to-apples comparison of pupil achievement, we also find that Ohio Eight charter students outperformed their Ohio Eight district counterparts (index scores of 65.7 versus 62.2, respectively).
Figure 1. Ohio Eight district and charter performance, 2022–23 to 2025–26
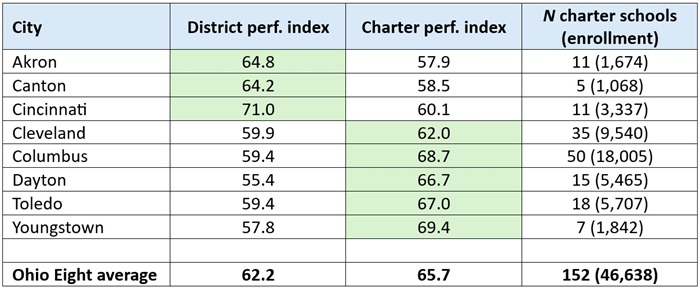
The next table disaggregates performance index scores by Ohio Eight city. Consistent with 2024–25 results, charter students in Cleveland, Columbus, Dayton, Toledo, and Youngstown outperform their district peers on this measure, with the widest margins in Dayton and Youngstown. On the other hand, charter students in Akron, Canton, and Cincinnati lag their district counterparts on the performance index.
Table 1. District versus charter school performance index scores, Ohio Eight cities, 2025–26
Student academic growth—progress ratings
The performance index provides an important point-in-time snapshot of where students stand academically. But it’s also influenced by demographics, which can obscure the true educational impacts of districts and schools. The state’s value-added growth measure (a.k.a., “progress”) helps us understand the effectiveness of schools apart from the demographics of their students. Schools that receive high ratings on the progress component are more effectively moving students up the achievement ranks, while those with poor ratings are allowing students to slip even further behind.
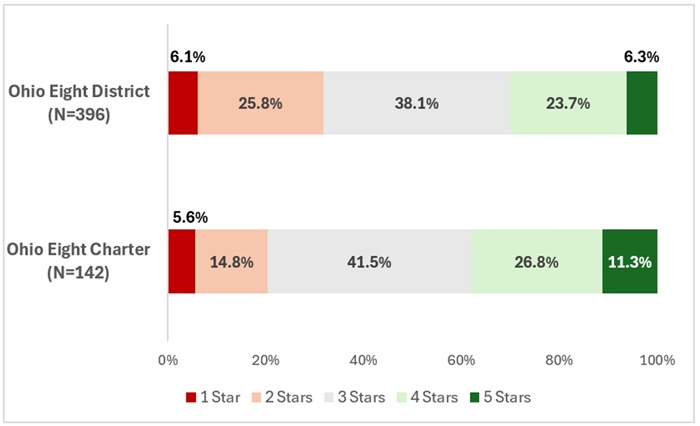
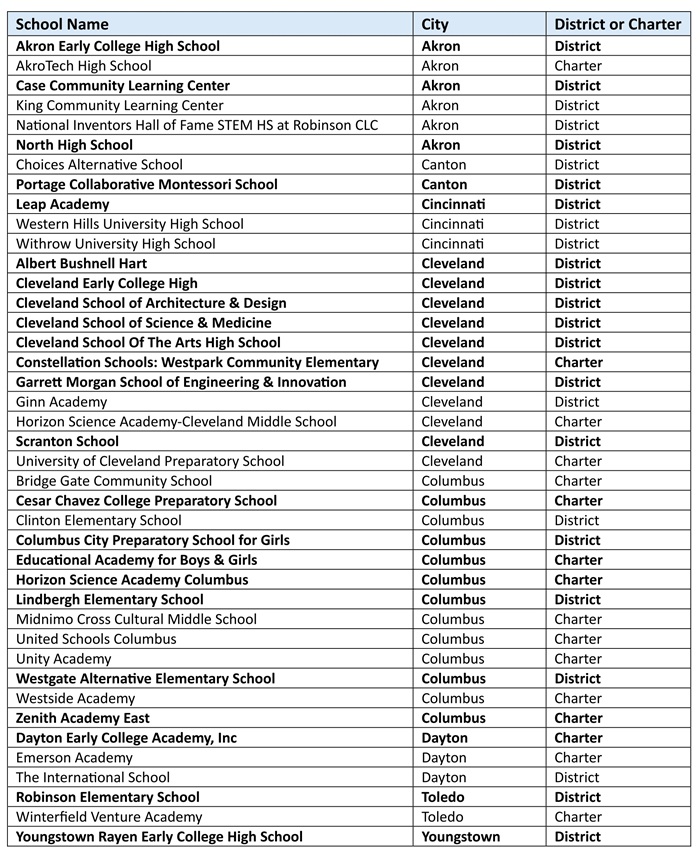
On this measure of academic growth, urban charter schools also outperform their district counterparts. In the Ohio Eight, 11 percent of charters received an impressive five-star progress rating, while just 6 percent of district schools achieved this mark. (Kudos to these standout schools, whose names appear at the end of this piece.) Meanwhile, another 27 percent of charters received four stars compared to 24 percent of district schools. Taken together, 38 percent of urban charters demonstrated evidence of positive academic impacts—receiving four or five stars—while just 30 percent of district schools did so. Stronger charter progress ratings relative to district schools were also visible in 2024–25.
Figure 2. Ohio Eight charter versus district performance, progress ratings, 2025–26
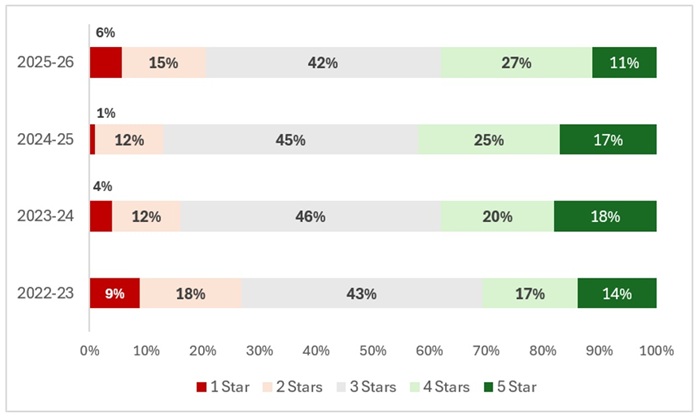
Despite their superior ratings vis-à-vis districts, the Ohio Eight charters suffered a slight setback in progress ratings compared to their own performance in 2024–25. As Figure 3 indicates, 42 percent of Ohio Eight charters earned four- or five-star progress ratings last year, but that number edged down to 38 percent in 2025–26. Conversely, more Ohio Eight charters received unsatisfactory progress ratings (one or two stars) in 2025–26 than the year prior. The most-common progress rating across all four years is three stars. This rating generally indicates that the average student held their position in the achievement distribution.[2] While this means a school met growth standards, it also suggests (in the context of a low-achieving school) that little progress was made to cut the achievement gap.
Figure 3. Ohio Eight charter schools’ progress ratings, 2022–23 to 2025–26
* * *
Public charter schools have become mainstays in Ohio’s urban communities. For some families and students, charters serve as a vital escape hatch from their assigned district school. Others select charter schools to gain access to specialized programs (e.g., arts), services (special education or gifted), or curricula (classical) that align more closely with their educational needs, values, and priorities. Still others choose charters dedicated to preparing first-generation students to attend and complete college. For most families, multiple reasons likely motivate their choice of school.
Thanks to the accountability and funding reforms instituted over the past decade, Ohio better ensures that students attend high-quality charters. This year’s data reinforce the wisdom of these reforms—charters continue to outpace nearby district schools on key measures—yet also signal the importance of building on them, as persistent achievement gaps remain and quality is still uneven across the sector. As discussed in multiple pieces, state and local leaders can and should more aggressively support public charter schools—most notably, through equitable funding and facilities resources—so they can both deepen the quality of their educational programs and widen their reach to serve more Ohio students. The charter sector also needs to uphold its end of the bargain, with sponsors holding schools accountable for results (including closing chronic underperformers) and school leaders rigorously implementing practices that drive higher pupil achievement. A supportive policy environment coupled with strong oversight and school-based leadership are the right ingredients for further advances in charter performance.
Table 2. Ohio Eight district and charter schools receiving five-star progress ratings, 2025–26
[1] In 2025–26, 28,901 students attended a general-education online school, and 22,919 students attended a dropout-recovery school, which can be either online or site-based.
[2] It could also indicate a lack of statistical precision in the value-added estimate. This is more likely to occur when a school has fewer students (as discussed in this piece by Fordham research fellow Stéphane Lavertu).