
In June, lawmakers passed long-awaited and comprehensive math legislation in the form of Senate Bill 19. The new law aims to improve Ohio’s lackluster math achievement in several ways: the Department of Education and Workforce (DEW) will establish a list of high-quality core curriculum and instructional materials for math; the State Board of Education will ensure all new educators have sufficient math knowledge before teaching math; districts will be required to provide advanced math opportunities to high achievers and evidence-based intervention services to those who are struggling; and schools will be required to submit math improvement plans to the state if fewer than half their students score proficient in third grade math.
Some of the provisions included in Senate Bill 19 will be implemented beginning this year. That makes recently released report cards from last year (2025–26) an important baseline for tracking improvement. Let’s take a look at four data points in particular that policymakers and the public should keep a close eye on.
1. Statewide proficiency on math exams.
The clearest sign that Ohio is improving math achievement would be an increase in the percentage of students who score proficient on state math exams. Table 1 identifies those shares for the three most recent school years. In 2026, just above half of students in all grades across Ohio were proficient in math. Only three grades—third, fourth, and Algebra I—posted rates above 60 percent. Proficiency percentages were lowest in seventh grade (48.6) and Geometry (43.3).
Table 1. Percentage of students scoring at least proficient on math state tests
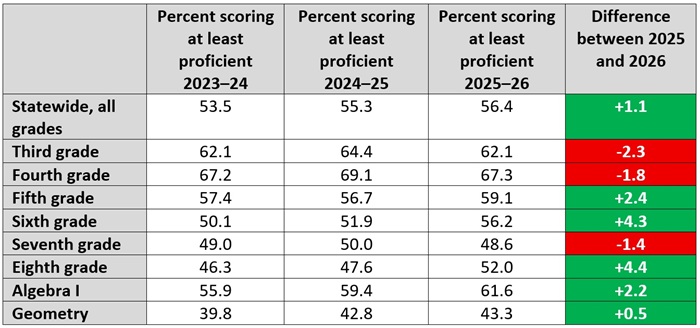
The final column of Table 1 identifies the difference between 2025 and 2026 results, with green shading indicating improvement and red signaling a decline. It’s good news that the percentage of students who scored proficient rose across five grade levels. Results are especially positive in sixth and eighth grade, where proficiency jumped by more than 4 percentage points. It’s bad news, however, that there are three grade levels where proficiency rates declined. Particularly worrisome is the fact that two of the three are third and fourth grade.
2. Statewide proficiency among selected groups of students.
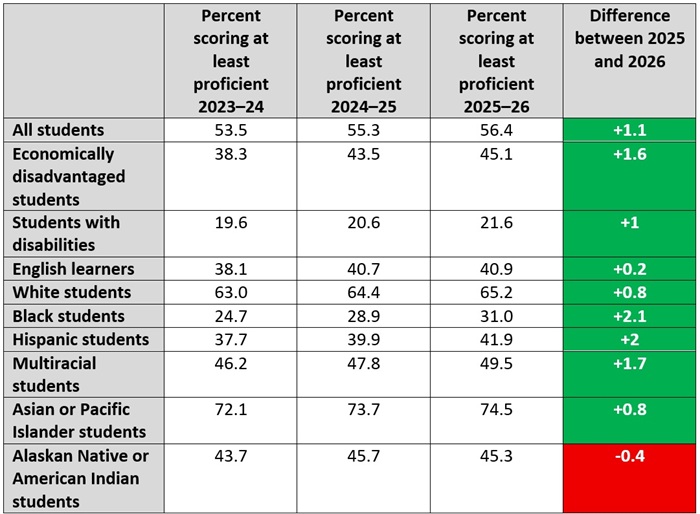
Another way to examine statewide proficiency data is by looking at how demographic groups perform. If Ohio can boost the percentage of traditionally underserved students who are proficient in math, that would be worthy of celebration. Table 2 shows the share of students who scored proficient or above on the state’s math exams during the three most recent school years. Green shading in the final column indicates improvement between 2025 and 2026, while red signals a decline.
As was the case with grade-level data, student-group results are a mixed bag. Proficiency rates are worryingly low for several groups. In 2026, just one-fifth of students with disabilities, less than one-third of Black students, and fewer than half of economically disadvantaged students were proficient in math. Only two groups—White students and Asian or Pacific Islander students—surpassed the statewide mark of 56 percent. The silver lining is that nearly every group improved between 2025 and 2026. But only two of those increases were by 2 percentage points or more (Black and Hispanic students improved by 2.1 and 2 percentage points, respectively). Ohio will have to do much better if it wants to close stubborn achievement gaps sooner rather than later.
Table 2. Percentage of students scoring at least proficient on math state tests
3. Percentage of students scoring limited.
It’s crucial to identify how many students are reaching proficiency each year. But the other end of the spectrum matters, too. If fewer students are scoring at the lowest performance level (limited), then that means schools are pushing more students toward proficiency—even if students haven’t yet reached that level.
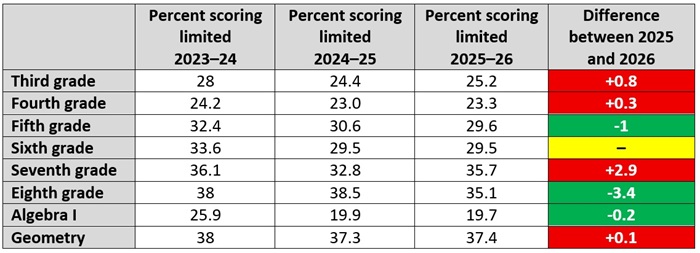
Table 3 identifies the percentage of students who scored limited during the last three academic years by grade. The final column identifies the difference between 2025 and 2026 results, with green shading indicating improvement (fewer students scoring limited), red shading indicating a regression (more students scoring limited), and yellow signaling no change.
Unfortunately, the results are pretty grim. In elementary school, roughly one-fourth of third and fourth graders are scoring limited. The percentage in both grades increased between 2025 and 2026. In middle school, even larger percentages of students are scoring limited—29 percent in fifth and sixth grade, and 35 percent in seventh and eighth—although both fifth and eighth grade improved this year. Meanwhile, in high school, it’s a tale of two subjects: Geometry posted the largest percentage of students scoring limited (more than 37 percent) while Algebra I posted the smallest (just under 20 percent).
Table 3. Percentage of students scoring limited on math state tests
4. Statewide pandemic recovery.
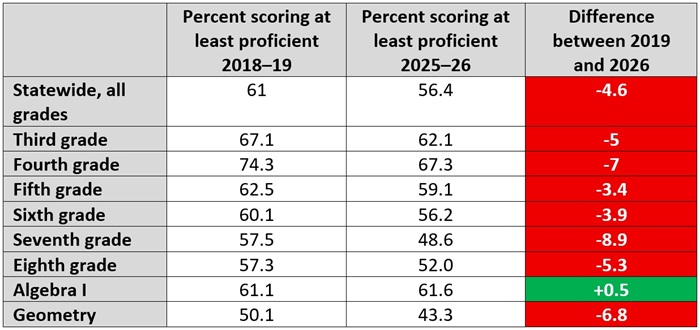
The final data that policymakers and advocates should closely monitor is whether Ohio students have recovered from pandemic-era learning losses. Table 4 identifies the number of students who scored proficient or above on the state’s math exams during the 2018–19 school year, the last before the pandemic, and the most recent 2025–26 school year. The final column identifies the difference between the two, with red shading indicating that proficiency hasn’t returned to pre-pandemic levels.
Algebra I is the lone bright spot. It’s the only state math assessment that’s successfully recovered, likely because the end-of-course exam that students take is part of Ohio’s graduation requirements and thus has higher stakes attached. Math achievement in every other grade has failed to rebound. Not only that, the discrepancies between pre- and post-pandemic scores are sizable. The smallest gap is 3.4 percentage points in fifth grade, while the largest is nearly 9 percentage points in seventh.
Table 4. Percentage of students scoring at least proficient on math state tests pre- and post-pandemic
***
Report cards from the 2025–26 school year demonstrate that Ohio has plenty of work ahead in math. Senate Bill 19 is a step in the right direction, but rigorous implementation will be key. Math proficiency is critical to all students’ future success, whether they pursue higher education or join the workforce. With a reenergized math policy in place, Ohio is poised to see stronger math achievement numbers in the years ahead.