In 2023, Ohio policymakers launched a sweeping initiative championing the science of reading, an evidence-based instructional approach that focuses on phonics and knowledge-building. Given that it’s a statewide effort, tracking statewide results is crucial. But state numbers can also mask improvement (or lack thereof) in individual districts. To get the full picture of Ohio’s progress, it’s important to take a closer look at local results.
For the purposes of this blog, we’ll examine data from the early literacy component on state report cards among the Ohio Eight, a group of eight urban districts with a long history of academic struggles. We’ll also include Lorain and East Cleveland, which spent several years under the oversight of now-defanged Academic Distress Commissions (ADCs).[1] Collectively, these ten districts serve over 181,000 students—11 percent of Ohio’s public school population—and are among those most in need of early literacy improvement.
First, let’s take a closer look at one of the component’s three measures: third grade reading proficiency. Table 1 displays the percentage of students who scored proficient on the reading segment of the English language arts (ELA) exam, as well as the statewide third grade proficiency average.[2] The final column identifies improvement between 2025 and 2026 with green shading and a decline with red.
Table 1. Percentage of third graders scoring proficient on the reading segment of state ELA exam in selected districts
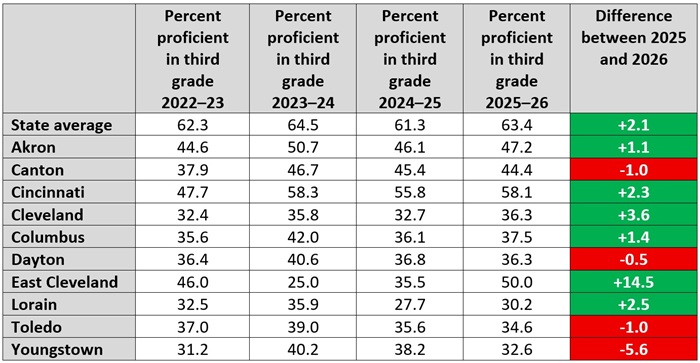
Overall, proficiency rates are pretty grim. No district met or surpassed the statewide average of 63 percent. The closest was Cincinnati, which fell short by more than 5 percentage points. In six districts—Cleveland, Columbus, Dayton, Lorain, Toledo, and Youngstown—just one in three third graders are reading proficiently.
The silver lining is that most districts improved between 2025 and 2026. Cleveland did particularly well with an increase of more than 3 percentage points. But it was East Cleveland that really knocked it out of the park. The district jumped over 14 percentage points in 2026, and that’s after gaining more than 10 percentage points the previous year. In 2024, just one-fourth of East Cleveland third graders were proficient in reading, making it the worst performer among these districts. Two years later, half of its third graders are proficient and it’s clocking in as the second-highest performer behind Cincinnati.
Remember, East Cleveland is one of three districts that were placed under an ADC by the state due to chronic low performance. It’s worth noting that there was a marked difference between the improvement plans put forth by these districts in 2021. East Cleveland’s plan was rigorous, detailed, and user-friendly. Youngstown and Lorain, not so much. Fast forward a few years, and East Cleveland is on the rise while the other two continue to struggle. Not only does Lorain have the lowest third grade reading proficiency (30.2) among the districts included here, it also falls into the bottom five of all districts statewide. Not five percent—five period. There’s only one district in all of Ohio (Mt. Healthy City) that had a lower rate than Lorain. Youngstown, meanwhile, joins Lorain in the bottom five and posted the biggest drop in proficiency among these districts, with a decline of more than 5 percentage points between 2025 and 2026.
The “improving K–3 literacy” measure is another element within the early literacy component that’s worth a closer look. It uses the results from fall diagnostic assessments to determine the percentage of students who move from “not on track” to “on track” in reading from one year to the next. These results indicate how well schools are improving K–3 literacy throughout all the early grades, thereby identifying schools and districts that are making critical progress with struggling readers. Table 2 displays the overall percentage of students each district moved to on-track status over the four most recent school years, as well as the difference between 2025 and 2026 results, with green shading indicating improvement and red a decline.
Table 2. Results for the improving K–3 literacy measure on state report cards in selected districts
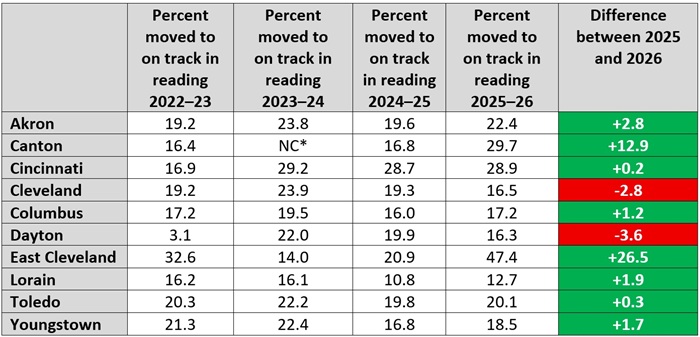
Once again, the numbers themselves aren’t great. The majority of these districts moved fewer than one-fourth of their struggling readers to on-track status in 2026. But there are some signs of improvement. All but two (Cleveland and Dayton) improved on their 2025 results. Canton impressively increased its rate by nearly 13 percentage points. But once again, it’s East Cleveland that steals the show. It moved almost half of its off-track readers to on track, an improvement of more than 26 percentage points.
***
While there are signs of hope among these results—looking at you, East Cleveland—there’s still a long way to go before the science of reading can be declared a success. To ensure the initiative lives up to the hype, state and local leaders need to double down on rigorous implementation efforts like regionally based instructional implementation teams and beefed-up professional development. In the meantime, though, Ohioans can feel cautiously optimistic that some of the state’s lowest-performing districts are already demonstrating improvement.