Last Friday, the Ohio Department of Education and Workforce released the state’s annual school report cards for the 2023–24 school year. As usual, they reveal areas of progress and challenges requiring attention. This year, we see encouraging upticks in statewide proficiency in third grade reading and high school algebra. But math achievement overall remains a sore spot—still well below pre-pandemic levels—and chronic absenteeism continues to be widespread.
Beyond these high-level results, we at Fordham have regularly taken deeper dives into the report cards from the Ohio Eight cities (listed below in table 1). The quality of these schools matters greatly, as they are more likely to serve disadvantaged students who most need an excellent education to reach their potential. Their districts and charter schools serve disproportionate numbers of low-income[1] and Black students (57 percent in the Ohio Eight versus 10 percent in non-Ohio Eight districts). Highly effective schools can and do help students make up significant ground, while low-performing schools allow students to fall even further behind. It’s also true that most of Ohio’s public charter schools are located in these cities, and given our commitment to quality charters, we’ve long sought to gauge their performance by comparing their results to nearby district schools.
What does this year’s report card tell us about the Ohio Eight? In a nutshell, we continue to find troubling achievement gaps that require urgent attention and a strong focus on academics. But there’s positive news, too: Urban charter schools are posting stronger pupil academic growth numbers than their district counterparts, suggesting that charter quality continues to improve.
Student achievement
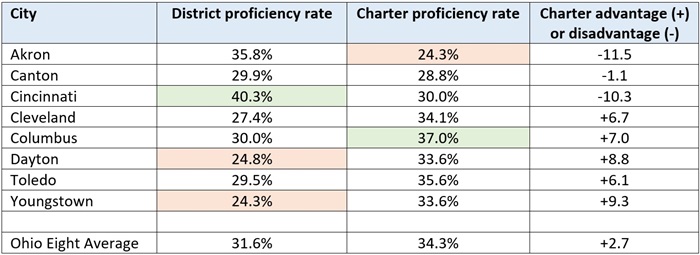
Reflecting persistent achievement gaps, table 1 shows that just one in three Ohio Eight students achieve proficiency on all state exams[2]—a rate that lags far behind the statewide proficiency rate of 58 percent. Relative to the Ohio Eight districts, charters have a slight edge in terms of proficiency (34 to 32 percent), with Columbus charters registering the highest proficiency rates on the charter school side. Among the Ohio Eight districts, proficiency rates are highest in Cincinnati but fall below 30 percent in five other districts. Less than a quarter of students are proficient in Dayton and Youngstown school districts, as well as in Akron’s charter schools.
Table 1: Proficiency rates (all tests) in the Ohio Eight cities, district and charter, 2023–24
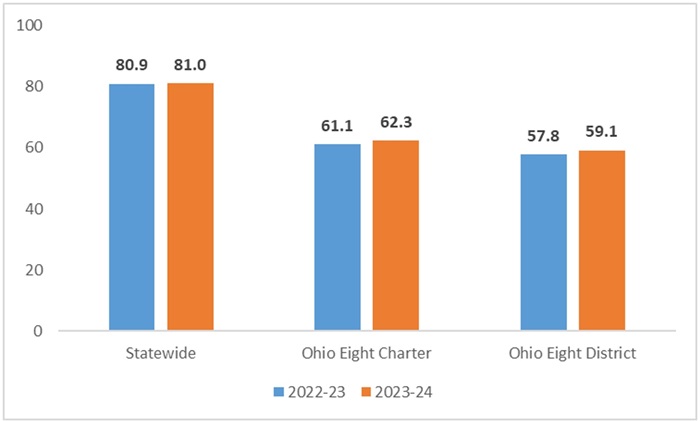
Another way of looking at achievement is through the performance index, a measure that awards additional credit to schools when students score at higher levels on state exams. In contrast to proficiency rates, which focus more narrowly on clearing the proficiency bar, the performance index provides a broader picture of pupil achievement across the entire spectrum. Consistent with the proficiency data, we see that Ohio Eight districts and charters lag significantly behind the state average on the performance index, yet charters again outperform their urban district counterparts (with a weighted average index score of 62.3 versus 59.1). As for changes in scores year over year, both Ohio Eight charters and districts register improvements of similar magnitudes (+1.2 and +1.3 points, respectively).
Figure 1: Performance index scores in the Ohio Eight cities, district and charter, 2022–23 and 2023–24
Value-added progress ratings
Proficiency rates and performance index scores shine much-needed light on achievement gaps and help the public understand where students currently stand academically. But out-of-school factors also influence these results. To provide a clearer picture of schools’ contributions to student learning separate from demographics, Ohio and other states have implemented growth measures that track learning trajectories over time. Ohio relies on a value-added methodology that controls for students’ prior achievement on state exams. This allows for a more poverty-neutral look at performance and serves as evidence about the educational effectiveness of districts and schools. District- and school-wide value-added results are the basis of Ohio’s Progress ratings, one of five rated components of the report card.[3]
Figure 2 shows the distribution of Progress ratings both statewide and in the Ohio Eight. On this measure, Ohio Eight charter schools outperform their Ohio Eight district counterparts: 38 percent of urban charters receive four- or five-star ratings, while just 30 percent of urban district schools do so. Conversely, fewer urban charters receive poor ratings compared to their district counterparts.[4] Ohio Eight charters also perform favorably compared to public schools statewide (38 versus 34 percent rated four or five stars on Progress).
Figure 2: Progress ratings of Ohio Eight district and charter schools, 2023–24
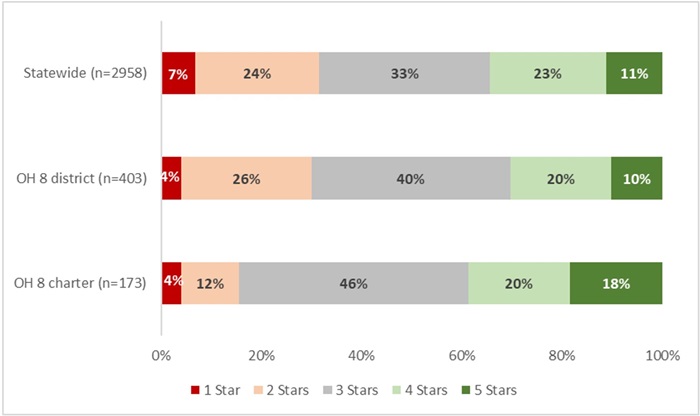
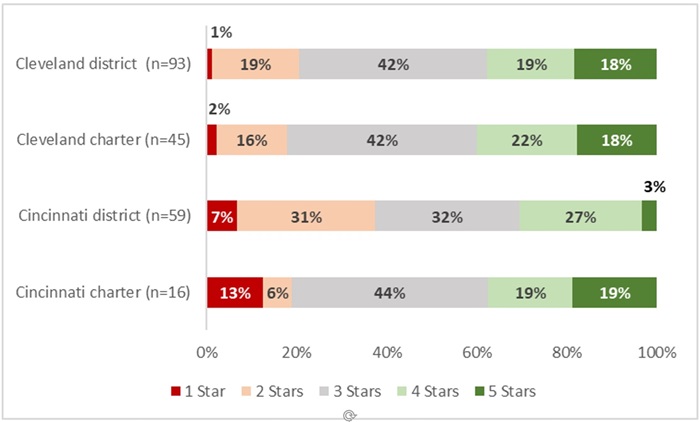
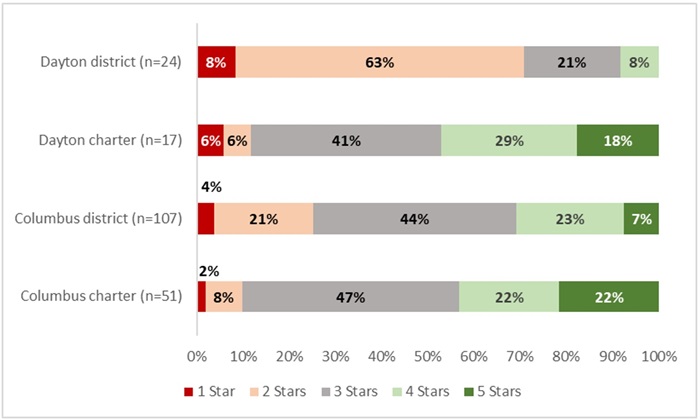
Figure 3 displays a breakdown of Progress ratings in four of the Ohio Eight cities where charters have a larger presence. In Cleveland, charter and district school ratings are nearly identical, but in the other three cities, a higher percentage of charters receive four- and five-star Progress ratings. Dayton charters are noticeably ahead of the city’s district schools, while Cincinnati and Columbus charters hold a more modest edge over district schools. Charters shine particularly brightly when it comes to the proportion of schools receiving five stars for Progress.
Figure 3: Progress ratings of district and charter schools in four of the Ohio Eight cities, 2023–24
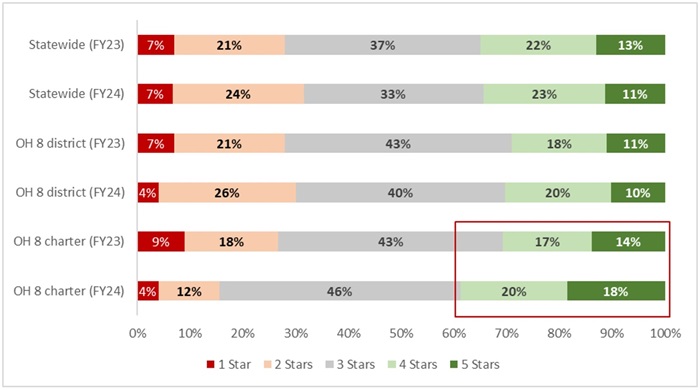
We last present the Progress ratings from the past two years. The rating distributions are consistent statewide and for the Ohio Eight district schools. But—as indicated by the red box—Ohio Eight charters improved on this rating, moving from 31 to 38 percent of schools rated four or five stars on Progress between 2022–23 and 2023–24. Conversely, a smaller percentage of Ohio Eight charters received low ratings last year compared to the year prior.
Figure 4: Progress ratings of Ohio Eight district and charter schools, 2022–23 and 2023–24
* * *
Urban education in Ohio and elsewhere continues to be a complicated and oftentimes discouraging story. With this year’s report cards, we are once again reminded of the urgent work needed to prepare more of Ohio’s urban students for success. No one should be satisfied when two in three students from these communities fall short of grade-level standards.
Yet we also see promising signs of quality, particularly in the charter sector. Report card results suggest that charter performance is on the rise—just as it was prior to Covid—after slumping during and right after the pandemic. Though more analysis is needed, these results may also be an early indication that recent funding improvements are helping to boost charter performance across the board. Of course, more needs to be done to improve charters, and two years of data do not make for a long-term trend. But if Ohio can continue to make headway toward equitable charter funding and maintain strong charter accountability, more students from our urban communities will finally get the education they need to succeed in school and life.
[1] Due to the Community Eligibility Provision, Ohio no longer reports accurate “economically disadvantaged” enrollments and valid numbers cannot be reported. We can infer from Census data and pre-CEP economically disadvantaged enrollments that more low-income students attend Ohio Eight schools than an average Ohio school.
[2] Ohio administers state exams in grades 3–8 in math and reading; grades five and eight in science; and five high school end-of-course exams (algebra I, geometry, English, biology, U.S. government, and U.S. history).
[3] Value-added results of specific student groups (e.g., students with disabilities) are also used in the Gap Closing component.
[4] While not the focus of these charts, the underlying value-added data also point to a charter school advantage. In 2023–24, the average value-added “effect size” of Ohio Eight charter schools was +0.07 versus +0.01 for Ohio Eight district schools.