In 2023, through an amendment tucked into the biennial budget, Ohio lawmakers threw in the towel on state efforts to improve Lorain City Schools. They did so by dissolving the academic distress commission (ADC) that had overseen the 6,000-student district since 2013. The commission, along with its appointed chief executive officer, had been tasked with leading a districtwide turnaround. But after relentless complaints from district officials and unending drama between the ADC and the school board, lawmakers decided to walk back the accountability measure and return Lorain to local control.
The move set off celebrations among officials who had bristled under state oversight. Mark Ballard, a Lorain school board member, compared it to a national holiday: “It’s Independence Day. It’s the Fourth of July, but it’s independence for Lorain City Schools.” Superintendent Jeff Graham told the press that getting out of state supervision had been a “long road” and vowed that the district would “continue improving.”
Has the district improved in the wake of ADC dissolution? The short answer: An emphatic “no.” But don’t just take my word for it, take a look at Lorain’s 2024–25 report card.
Student achievement
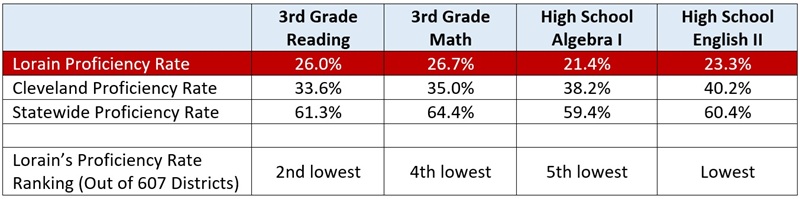
Starting with measures of achievement on state exams, we discover that just a quarter of Lorain students currently achieve proficiency in reading or math. These rates lag far behind the statewide average, and even fall noticeably short of proficiency rates in Cleveland, another nearby district that has struggled with low pupil achievement. In third grade reading, for instance, just 26 percent of Lorain students achieved proficiency, while 34 percent of Cleveland students reached this mark (and 61 percent did so statewide). As indicated in Table 1, Lorain’s proficiency rates in third grade and high school math and reading fall near, or at the very bottom, among all 607 of Ohio’s school districts.
Table 1: Lorain proficiency rates on selected state exams, 2024–25
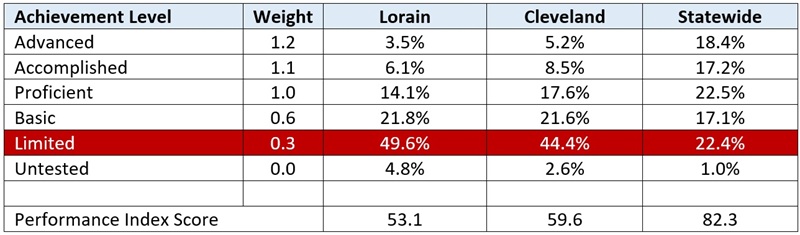
To gauge overall achievement, we turn to the state’s performance index, a composite measure across all state exams and one that awards more credit when students score at higher levels. Table 2 shows Lorain’s performance index score and the data underlying it. Here, we observe that a staggering half of Lorain students score at the lowest possible achievement level known as “limited.” On the other side of the spectrum, just one in ten Lorain students score in the advanced or accomplished categories, signifying they are on pace for college and career readiness. We also notice a somewhat large portion of untested students in Lorain (4.8 percent) compared to Cleveland and the state overall. This suggests problems with student engagement, an issue we’ll come back to in a moment. In total, Lorain’s performance index score was 53.1, more than six points below Cleveland and almost 30 points below the statewide average.
Table 2: Lorain’s performance index versus Cleveland and statewide, 2024–25
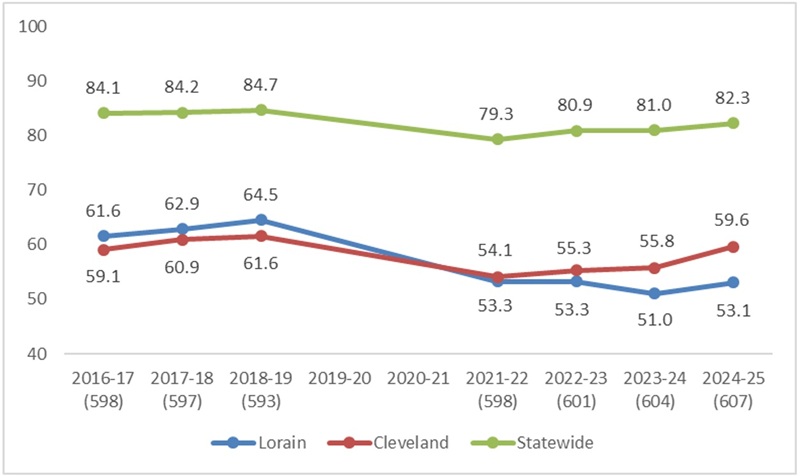
Perhaps these grim point-in-time statistics mask improving student achievement, albeit against an extremely low baseline. Yet Figure 1 reveals virtually no improvement over the past few years. Just prior to the pandemic—when Lorain was under ADC oversight—district scores were ticking upward, and its statewide ranking on the performance index was trending in the right direction. The pandemic took an immense toll on achievement statewide and in Lorain. But while performance index scores have recovered somewhat statewide and in Cleveland, they remain depressed in Lorain. In 2024–25, the district’s performance index score was no better than it was in 2021–22, and Lorain’s score now ranks dead last among all Ohio districts.
Figure 1: Performance index trend, Lorain versus statewide
Student academic growth
A more precise look at student learning over time comes via the state’s “value-added” measure (a.k.a. Progress ratings). This measure tracks pupil achievement gains (or losses) relative to similarly scoring peers, a statistical methodology that helps control for the influence of demographics on test scores and zeroes in on schools’ effectiveness.
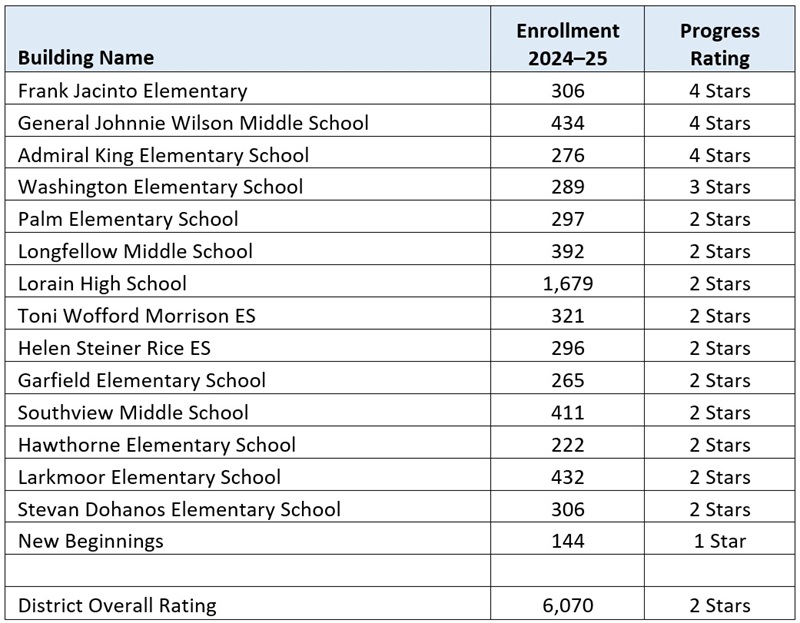
On this measure, Lorain lagged, as well. As Table 3 shows, only three Lorain schools received a four-star Progress rating, and none received five stars. Instead, a large majority of Lorain students are stuck in mediocre two-star schools where students are falling even further behind their peers. The districtwide two-star rating confirms the sluggish overall student growth across most of its schools.
Table 3: Lorain school districts’ Progress ratings, 2024–25
Student attendance
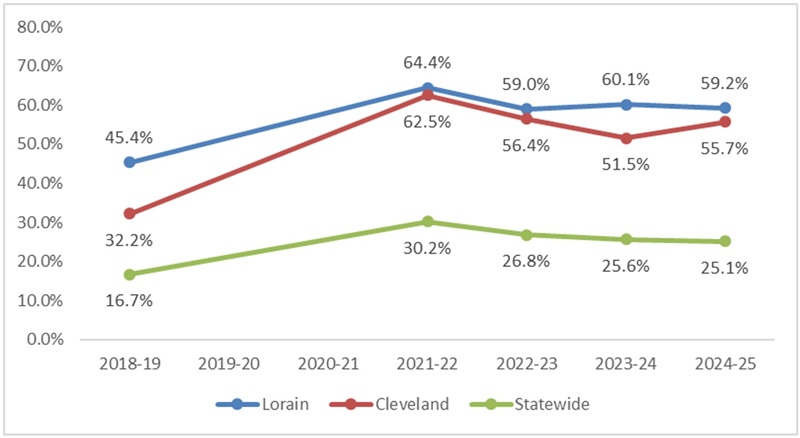
While not a direct measure of achievement, attendance correlates to improved learning outcomes and is an important proxy for student engagement. Given Lorain’s abysmal proficiency rates, one might expect the district to be aggressively promoting attendance to drive achievement. Is that happening? If it is, it’s not showing up in the data. Figure 2 reveals staggering rates of chronic absenteeism in Lorain, which are more than double the state average and exceed Cleveland’s rate. In fact, Lorain’s 59 percent chronic absenteeism rate is the highest of all districts statewide. Yikes.
Figure 2: Chronic absenteeism in Loran versus Cleveland and statewide
Graduation and post-secondary readiness
Consistent with ballooning graduation rates statewide, Lorain posted a seemingly impressive 80 percent four-year graduation rate, the highest number on record over the past decade. The district also received a three-star rating for readying graduates for college and career. But what does post-secondary readiness really look like in Lorain? Digging deeper into the data, we discover few students meeting college-ready targets, a consequence of the abysmal math and reading proficiency rates seen well before twelfth grade. Just 3 percent of Lorain’s class of 2024 reach the college-remediation free standard on the ACT/SAT. No students passed an AP exam, or even took a course, though 13 percent did earn dual-enrollment credits.
How did Lorain graduate four in five students and earn that three-star rating? Mostly through career-tech indicators: 39 percent of students in Lorain’s class of 2024 earned industry credentials and 32 percent passed career-tech assessments. These numbers—up significantly from the year prior—mirror those from other low-achieving districts, such as Cleveland and Youngstown, that have reported rapidly increasing numbers of students completing these measures. The rise comes in response to new graduation requirements that provide struggling students with a career-tech alternative, as well as the report card rating.[1]
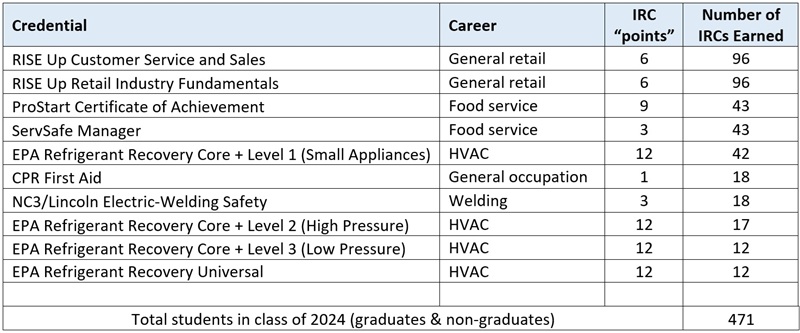
But are the industry credentials that Lorain students attain any good? Table 4 shows the most commonly earned credentials for its class of 2024. At the top of the list are a pair of retail and food-service certificates, which are unlikely to open doors to higher-paying occupations. More promising news comes further down the list, where we find some Lorain students earning refrigerant certifications, which could lead to more solid-paying, technically-skilled HVAC jobs.
Table 4: Industry credentials earned in Lorain City Schools, class of 2024
In sum, the post-secondary readiness of Lorain students is less rosy than its graduation rate or three-star college-and-career-ready rating might suggest. By my estimation, roughly one in four Lorain students in the class of 2024 graduated ready for life after high school by achieving college-ready indicators or earning high-value credentials. Lacking solid academic preparation or valuable technical credentials, what will happen to the remaining Lorain students?
***
Ohio lawmakers solved a political problem by abolishing the ADC and letting Lorain City Schools off the accountability hook. Yet by backing down when the going got tough, they did nothing to help solve the real problems plaguing the district, including woeful academic performance, rampant absenteeism, and graduates who are unprepared for the real world. Instead, the available data suggest that the district has gone in the wrong direction ever since the state cut and ran. Maybe Lorain administrators will get it together and turn the district around all on their own. Or, more likely, that’s just wishful thinking, and lawmakers—perhaps under leadership from a new governor—will have to find the courage to help the students of Lorain get on the right track.
[1] Schools receive credit toward their college and career readiness rating when students meet one of eleven indicators of readiness (including credentials and technical exams). Lorain received a one-star bump (from two to three stars) for its college-and-career-ready rating based on increasing numbers of students meeting the career-tech measures.