
In the wake of the September release of school report cards, education groups were in a celebratory mood. In an exuberant press release, Columbus City Schools feted its 46 schools that notched three or more stars on their report card. Cincinnati Public Schools boasted its districtwide three-star rating. Even the teachers union—a longstanding report card critic—touted the high ratings received by Ohio schools. “With 94 percent of school districts meeting or exceeding state standards, there is much to celebrate in this year's report card results,” said Ohio Education Association president Jeff Wensing.
It’s true: Lots of districts and schools got an attaboy on their report card this year—and even more than the year prior. But these rosy ratings belie chronic achievement gaps, persistent learning losses post-Covid, and the sluggish improvements students have made to recover academic ground.
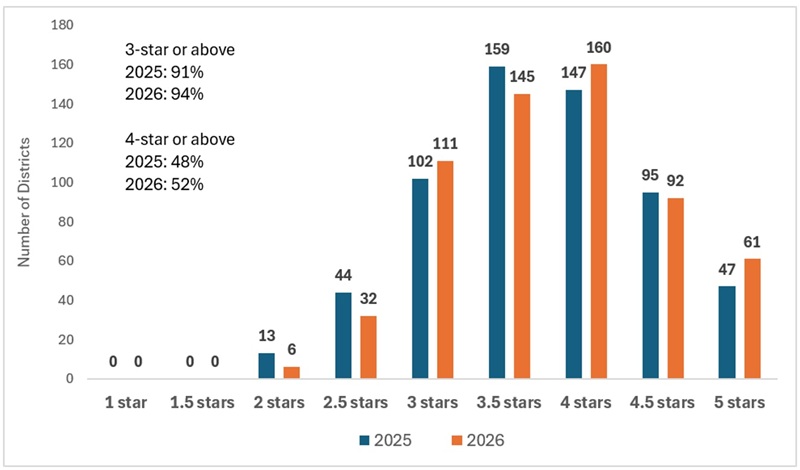
Let us first look at how the 2025–26 overall ratings shook out. As the figure below indicates, more than nine in ten districts statewide did indeed receive three stars or above (three stars indicate “meeting state standards”). Just over half of districts received four stars and above (“exceeding standards”). By contrast, no district—not a single one—received a one-star or 1.5-star overall rating. As shown in the figure, the ratings from 2025–26 outpace the already sky-high marks registered the prior year.
Figure 1. District-level overall ratings, 2024–25 and 2025–26
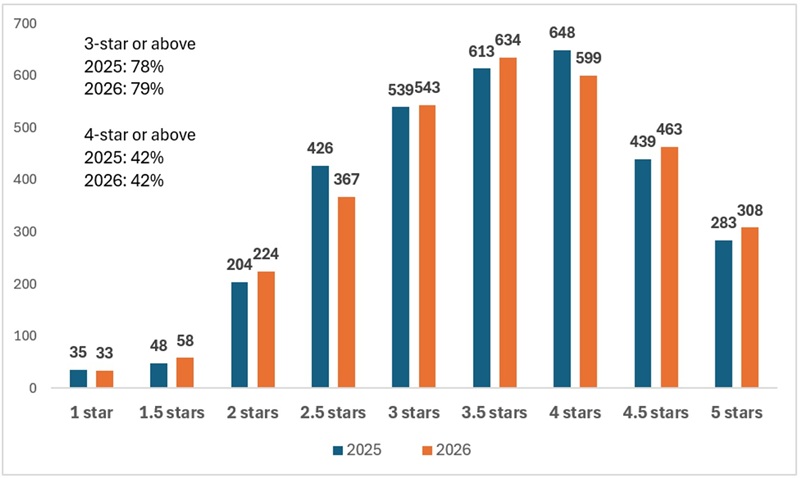
Though not quite as extreme, a similar story unfolds at the individual school level. As Figure 2 indicates, 79 percent of Ohio schools were awarded three stars or above, while 42 percent received at least four. Just 3 percent of schools statewide received one of the two bottom ratings.
Figure 2. School-level overall ratings, 2024–25 and 2025–26
These feel-good ratings obscure the more sobering data about how students fare academically. Two in five Ohio students fell short of math and reading proficiency in 2025–26, with most students still struggling to catch up after the pandemic train wreck. In Columbus, 46 percent of students scored “limited”—the rock-bottom mark on state assessments—while 36 percent in Cincinnati recorded such scores. The state’s elevated chronic absenteeism rates barely budged. The share of students meeting college-ready targets on the ACT or SAT continued their downward slide. Just 18 percent of the class of 2025 met the readiness bar on these entrance exams, down from 27 percent for the class of 2018.
What gives? Why are so many schools getting high ratings when so many students are struggling?
The answer lies in Ohio’s soft report card standards. Based on 2024–25 report card results, I previously examined several areas where policymakers have implemented low performance standards. Left uncorrected over the past year, the problems have only gotten worse and produce inflated ratings. To recap briefly:
- The overall rating’s grading scale is set too low and contributes to the skewed ratings shown in Figures 1 and 2. The grading scale also produces nonsensical overall ratings at odds with schools’ underlying component ratings (see, e.g., the report cards for Dayton and Canton school districts).
- Schools with unacceptable absenteeism rates can receive full credit for meeting the chronic absenteeism indicator via a weak improvement alternative. To offer an example from the 2025–26 report card, Youngstown City Schools received full credit for chronic absenteeism, despite a staggering 57 percent of students being chronically absent (more than double the state average).
- Based on weak diploma standards, graduation rates have soared to unseen heights (88.8 percent in 2025–26). This has caused ratings to balloon on the graduation element of the report card: 61 percent of districts received perfect five-star graduation ratings in 2025–26, while 52 percent of high schools received that mark.[1]
- The grading scale for the gap closing component is soft and papers over serious achievement gaps. Lorain City Schools, for example, met only 22 of 65 gap closing indicators and none based on specific student groups meeting the state’s math and reading proficiency targets. Despite these abysmal results, the district still received a three-star—“meets state standards”—gap closing rating.
- Weak “career-ready” measures inside the college, career, workforce, and military readiness component allow districts to receive good ratings even when most students are unprepared for what comes next. Akron and Youngstown, for instance, received four-star readiness ratings in 2025–26 despite other data indicating that a large majority of graduates struggle after high school.[2]
In 2021, Ohio lawmakers made significant reforms—many supported by the Fordham Institute—to the school report card. The bones of the system align with best practices, including an emphasis on student proficiency (“achievement”) and academic growth (“progress”) as measured objectively via state assessments. It also features a user-friendly overall rating and a star system to communicate results.
But the cancer of low expectations has infected the otherwise healthy bones of the report card. The result is ratings that offer parents and communities an increasingly dishonest picture of how students fare academically. Curing report-card inflation through raised standards is bound to pain some adults, but it’s also the right thing to do. Honesty, after all, is the best policy.
[1] These ratings are noncompliant with a provision in state law prohibiting more than half of districts or schools from receiving the same rating. This should be addressed in advance of next year’s report card.
[2] Just 16 and 9 percent of Akron and Youngstown graduates, respectively, earn an associate degree or above by their mid-twenties. The median incomes of Akron and Youngstown graduates are $26,130 and $18,486, respectively, five years after high school.