Mobile Navigation

  • National
    • Policy
      • High Expectations
      • Quality Choices
      • Personalized Pathways
    • Research
    • Commentary
      • Gadfly Newsletter
      • Flypaper Blog
    • Events
    • Scholars Program
  • Ohio
    • Policy
      • Priorities
      • Media & Testimony
    • Research
    • Commentary
      • Ohio Education Gadfly Biweekly
      • Ohio Gadfly Daily
  • Charter Authorizing
    • Application
    • Sponsored Schools
    • Resources
  • About
    • Mission
    • Board
    • Staff
    • Career
Home
Home
Advancing Educational Excellence

Main Navigation

  • National
  • Ohio
  • Charter Authorizing
  • About

The Education Gadfly
4.10.2026
Gadfly Guy
Listen to this article
Loading the Elevenlabs Text to Speech AudioNative Player...

WHAT WE’RE READING

“New data showing a stagnating percentage of parents redshirting their would-be kindergartners surprised even the researchers who analyzed the data.... So, why aren’t more parents redshirting their children? Multiple factors may be at play. Evolving age requirements for kindergarten entry, tougher district restrictions around redshirting, and costs of childcare could be keeping kindergarten redshirting from escalating.” —Elizabeth Heubeck, EdWeek

—

Like many districts across the country, Atlanta Public Schools will shut down several schools in the coming years to right-size facility use amid declining enrollment and tight budgets. Linda Jacobson reports on efforts to convert some of the city’s schools into affordable housing, giving teachers first choice when apartments become available. —The 74

—

Hiring is down and unemployment among young adults is up due to persistent economic uncertainty and a labor supply-and-demand problem that pre-dates recent rapid advancement in AI. In The Atlantic, Harvard economist David Deming tells Rogé Karma that “the number of graduates competing for jobs has increased at the same time that the skill level of the average graduate has fallen. ‘This is the same thing that happened with high school 50, 60 years ago…A high-school diploma used to confer huge advantages, but then it became so ubiquitous that the advantages went away.’” Karma notes that “the percentage of young people with a bachelor’s degree has risen by about a third since 2008, and most of that increase has stemmed from expanded enrollment at less selective universities.” And in The New York Times, Noam Scheiber traces how the “college for all” push created a generation of disaffected, underemployed young people.

—

Jenny Anderson shares the story of one tech-forward middle school math teacher who, after years of lost learning time “futzing over lost chargers and bad links,” decided to ditch Chromebooks in his classroom. He realized the screens “offered students cover, a way to appear engaged without any actual sustained effort,” and found himself more aware and responsive to student needs without the screens. —The Atlantic


Editor's note: This was first published on Mike Petrilli's Substack, SCHOOLED, a twice-weekly free Substack and email newsletter restarting the education-reform conversation.

Click here to subscribe for:

  • Sharp analysis of the week’s biggest K–12 debates

  • Curated commentary from across the ed-policy world

  • Lively discussion—including reader reactions and pushback

The Education Gadfly
4.10.2026
Gadfly Guy
Listen to this article
Loading the Elevenlabs Text to Speech AudioNative Player...

CHEERS

Schools are finally pulling back on Chromebooks and other ed tech in the classroom. Natasha Singer shows how one Kansas middle school shifted to “intentional tech use” and reports on the growing push to limit screen time in schools nationwide. —The New York Times

—

“The Georgia Early Literacy Act approved by the General Assembly Tuesday would hire more teachers and overhaul curricula and training, with a focus on the phonics-based teaching methods credited with accelerating reading apprehension in other Southern states.” —Ty Tagami, RoughDraft Atlanta

—

Dan Fitzpatrick interviews Google’s Head of Learning, who tells him that the most important problem in learning is motivation and that AI is no silver bullet. Still, he’s excited about ways ed tech can improve the teaching profession: “It can save time, translate languages in real time, turn curricula into podcasts, and let a special education teacher build a music app for a student who communicates through blinks. What it cannot do is make a student feel like they matter.” That, according to Ben Gomes, “remains the work of people.” —Forbes

JEERS

New York handed $10 million to the teachers union to retrain teachers on the science of reading, yet “the course doesn’t reflect the latest research and in fact promotes a teaching strategy that’s been found ineffective and could actually impede students’ progress,” reports Steven Yoder. —Hechinger Report

—

“Columbus City Schools has spent over $20 million in improvements since 2020 on four buildings it plans to demolish.” This despite a state law requiring districts to sell unused buildings to charter schools. —Cole Behrens, Columbus Dispatch

—

No surprise: AI makes cheating easier. Kyla Scanlon breaks down the implications of a new Pew survey showing that 59 percent of U.S. teens believe students at their schools cheat at least somewhat often. “The impulse to cheat hasn’t changed—students have always wanted easier paths. But now, for nearly every type of assignment, cheating is almost always easier.” —The Argument


Editor's note: This was first published on Mike Petrilli's Substack, SCHOOLED, a twice-weekly free Substack and email newsletter restarting the education-reform conversation.

Click here to subscribe for:

  • Sharp analysis of the week’s biggest K–12 debates

  • Curated commentary from across the ed-policy world

  • Lively discussion—including reader reactions and pushback

Vladimir Kogan
4.9.2026
Vlad Kogan blog on CCS finances blog image
Getty Images/phakphum patjangkata
Listen to this article
Loading the Elevenlabs Text to Speech AudioNative Player...

Twice each year, Ohio school districts must submit medium-term financial forecasts to the state, and the most recent updates released in early March paint a bleak picture.

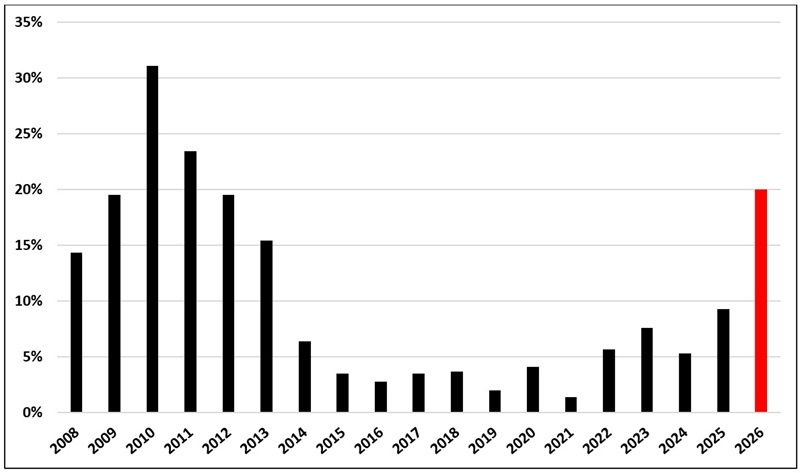
Four out of ten districts expect their expenditures to exceed revenues at the end of this fiscal year. By 2029, 85 percent project operating in the red. Absent revenue increases or spending cuts, one in five school districts could end that year with a negative cash balance—effectively bankrupt.

This represents a sharp deterioration from last year, and indeed the worst financial stress to confront Ohio school districts since the depths of the Great Recession (see Figure 1).

Figure 1. Percent of Ohio districts projecting negative cash balance in three years

Vlad Kogan blog on CCS finances figure 1 revised

Columbus City Schools, the largest district in the state, is among those currently on a course for insolvency. The district serves as a cautionary tale for many of the governance challenges facing public education in Ohio. It illustrates both how political pressures can push districts to make irresponsible, short-term hiring and spending decisions and the extent to which their leaders will go to pass the buck when the bill eventually comes due.

This is the story about how Columbus went broke, and what others should learn from it.

No, state “underfunding” is not to blame

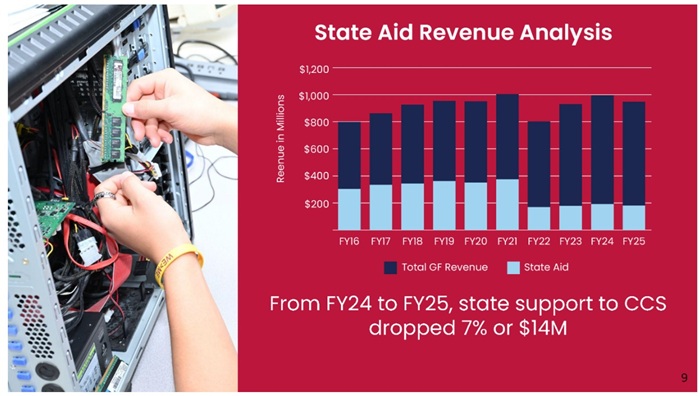
At a special board meeting called to deal with the district’s projected $100 million budget crisis last November, Columbus Superintendent Angela Chapman’s presentation included a shocking graph. A slide titled “State Aid Revenue Analysis” (reproduced in Figure 2 below) appeared to show a sharp reduction in state funding, from nearly $400 million in 2021 to below $200 million in recent years.

Figure 2. Slide from Columbus superintendent board presentation on November 13, 2025

Vlad Kogan blog on CCS finances figure 2

“The state used to be a big player in education,” Chapman explained to the board. “In 2022, they provided more than 30 percent of our budget in CCS [Columbus City Schools]. Today, that is closer to 15 percent. And it will be 10 percent in 2027.”[1]

“We know right now we’re in this budget situation not because we did this, but because our state house did this, because our federal government is doing this,” board member Jen Adair emphasized later in the meeting, lest anyone miss the implication.

Adair would go on to include the same figure in a social media post a few days later. Structured as a Q & A, the post asked why the district faced a massive budget deficit and went on to answer with this: “Great question! The main reason is because the State has not fully funded public education for the next two years.”

The slide and comments are misleading, to say the least. They misrepresent what was a purely accounting change—one that actually benefited Columbus financially—and create the false impression that the state has reduced its financial support for the district.

Some background: Before 2022, Ohio utilized a “pass-through” funding model that sent dollars ultimately destined for charter schools and to pay for EdChoice vouchers through students’ district of residence. In Columbus, millions of state dollars were recorded as revenue, but then immediately left the door as payments to charter schools and parents using private school vouchers.

Due to a quirk in the school funding formula at the time, which capped state payments to the district, Columbus officials blamed the “pass-through” approach for “bleeding” the district. They complained, quite reasonably, that payments Columbus was required to make to charter and private schools exceeded the amount of state funding provided for these students.

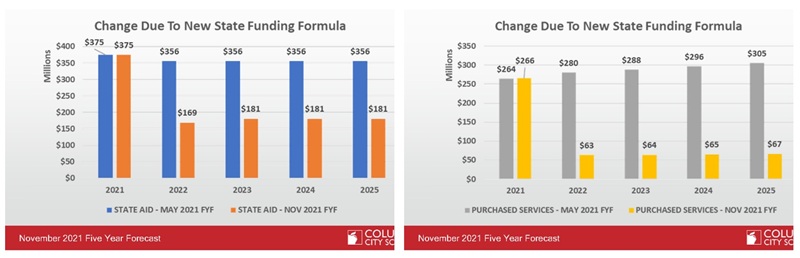
The district lobbied lawmakers to replace this flawed pass-through approach with a “direct” funding model, in which the state would write checks to charter schools and for vouchers itself, without funneling the dollars through Columbus’s bank accounts. As noted in a presentation to the Columbus school board in November 2021, this reform had the effect of reducing state revenue by nearly $200 million (left panel of Figure 3), although this represented a paper loss because it was money the district never expected to keep. The same accounting change reduced expenditures even more (right panel of Figure 3), with the district ultimately coming out at least $30 million ahead each year.[2]

Figure 3. Slides from November 2021 Columbus board presentation, showing that shift from “pass-through” to “direct” state funding of charter and voucher students caused the district to come out at least $30 million ahead per year

Vlad Kogan blog on CCS finances figure 3

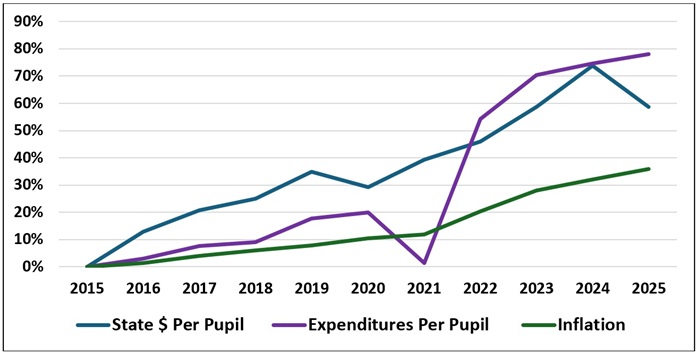
To be sure, the state legislature delayed phasing in a new funding formula adopted the same year and hasn’t regularly updated it to reflect higher costs, the complaints implied in Adair’s statement. However, as Figure 4 shows, net per-pupil state funding after accounting for the charter and scholarship deductions in Columbus has increased by nearly 60 percent over the past ten years, far outpacing inflation.[3] Since the transition to the new state formula in 2022, state dollars have continued to grow faster than inflation. In recent years, some of this increase has been offset by a state penalty Columbus has had to pay for its failure to meet its legal obligation to transport charter and non-public school students, a mess of its own making.

The bottom line is that Adair is wrong. State funding—or lack of it—is clearly not the underlying cause of the district’s fiscal stress.

Figure 4. Change in state funding and expenditures in Columbus City Schools since 2015

Vlad Kogan blog on CCS finances figure 4

Declining enrollment, increased hiring

If lack of revenue is not responsible for Columbus’s budget crisis, the problem must be on the other side of ledger—excessive expenditures. Figure 4 confirms that this is the case, with spending per pupil far outpacing the rate of inflation.[4] Before the pandemic, expenditures grew somewhat slower than state funding. Spending dipped during the pandemic year, as schools remained closed, but have exploded since then.

No doubt the $450 million in federal pandemic aid that Columbus received contributed to this recent spending spree, but the district seems to have committed the cardinal sin of using one-time dollars to pay for permanent, ongoing expenses. The former Columbus treasurer, Stan Bahorek, explicitly counseled district leaders that this was a bad idea in the early days of the pandemic, reminding them of the “fiscal cliff” that came when the post–Great Recession federal aid ran out a decade ago.

In 2023, district disclosures noted that temporary federal dollars were covering the cost of 430 district staffing positions. “This represents a significant risk … and will impact the scope and magnitude of budget reductions needed to offset the cost of these positions,” the document warned ominously.

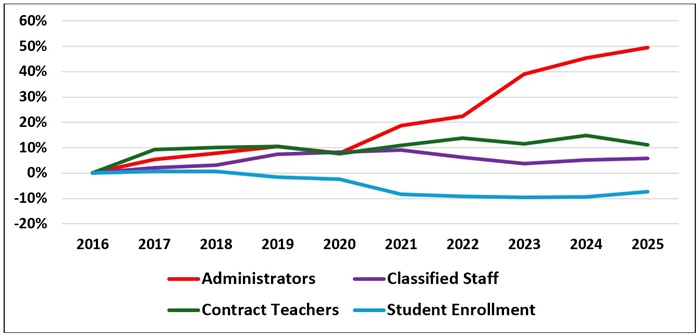
As Figure 5 shows, some of spending splurge has indeed paid for increased staffing levels, despite declining student enrollment.[5] The district has lost 7 percent of its students over the past decade. During the same period, the number of teachers increased by more than 10 percent and classified staff went up 6 percent. The number of administrators has jumped by nearly half.

The timing of these changes is important. Most of the enrollment losses came after the pandemic, in part due to the district’s prolonged closures. Like the transportation penalty, this is a self-inflicted wound.

Columbus public health officials insisted that schools could and should reopen as early as October 2020, yet the district stayed remote for months longer due to intransigence from the district’s teachers union. It would take the threat of Governor Mike DeWine not putting teachers at the front of the Covid-19 vaccine line for in-person instruction to resume, in spring 2021. But by then, the damage had already been done.

Most of the increase in teacher and classified hiring took place before the pandemic, while the sharp increase in the ranks of administrators occurred after 2021.

Figure 5. Changes in enrollment and staffing in Columbus over time

Vlad Kogan blog on CCS finances figure 5

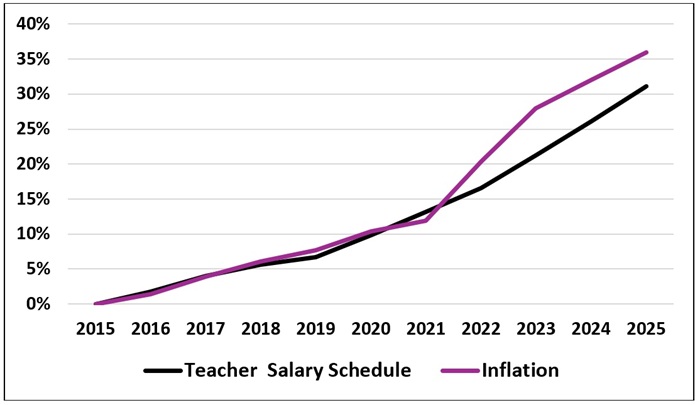
Importantly, increased hiring has not come at the expense of compensation. Until the pandemic, teacher salaries at each level of education and experience in the Columbus pay schedule rose roughly in line with inflation (see Figure 6). Salaries fell somewhat behind in subsequent years—increasing by a total of 31 percent over the course of the decade, about 5 percentage points slower than cumulative inflation over the same period. But the pay of individual teachers rose even more than the salary schedules indicate, as they gained experience and moved to higher “steps” in the salary schedule.

Figure 6. Change in Columbus teacher salary schedule

Vlad Kogan blog on CCS finances figure 6

Academic outcomes have declined

District leaders have claimed that increased hiring reflects a strategic effort to move the needle on student achievement and warned that pending layoffs required to close the deficit will undo some of those gains. But on this point, the district is again distorting the evidence.

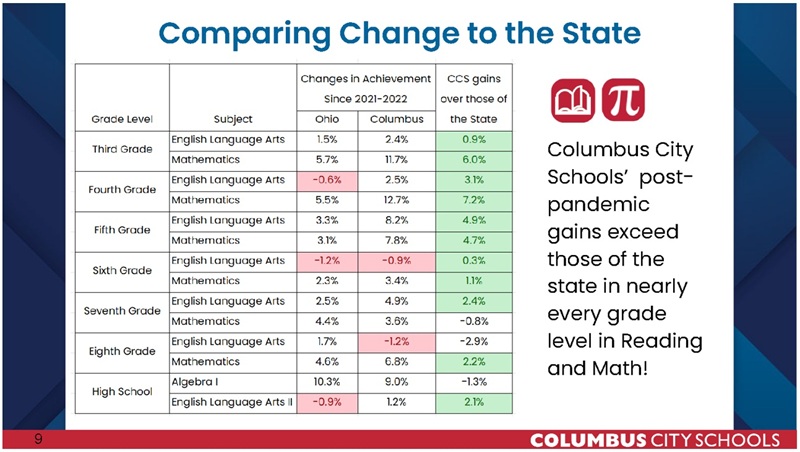
A presentation to the school board last fall (Figure 7), shortly after the release of the annual state report cards, triumphantly claimed that “Columbus City Schools’ post-pandemic gains exceed those of the state in nearly every grade level in Reading and Math!”

Figure 7. Slide from Columbus school board presentation on September 16, 2025

Vlad Kogan blog on CCS finances figure 7

But this comparison intentionally focused only on the post-pandemic period—starting at the nadir, after Columbus suffered some of the largest academic declines in Ohio least in part due to its extended closures. And the recovery in the years since also reflects changes in student composition, with gains concentrated in the youngest grades, where performance of incoming cohorts unaffected by pandemic disruptions is compared to students who were enrolled when schools were closed.

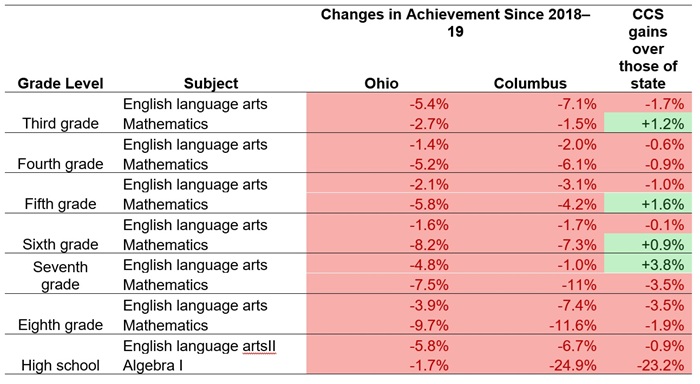
Figure 8 recreates the same analysis but instead uses 2018–19, the last year before the pandemic, as the starting point. It paints a very different picture. Not only is achievement of Columbus students still below the levels seen prior to the pandemic, including among younger grades who started school afterward, but the district has fallen further behind the rest of the state in most grades and subjects.[6]

The sharp increase in spending and increase in staffing has not produced an academic miracle. Instead, student outcomes have moved in the wrong direction.

Figure 8. Comparison of proficiency rate changes in Columbus vs. Ohio Statewide since 2018–19

Vlad Kogan blog on CCS finances figure 8

Misplaced focus, priorities

Given robust evidence that more money typically does produce better academic outcomes, one should wonder why the massive increase in spending in Columbus in recent years has not moved the academic needle more.

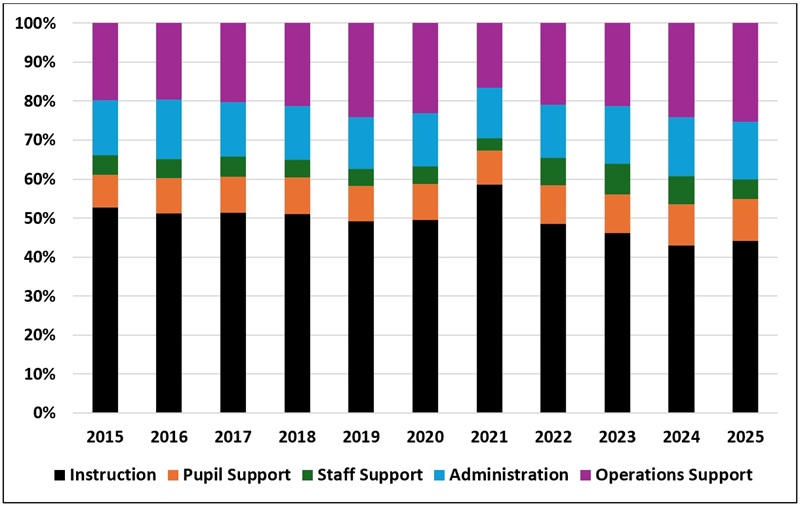
Part of the story is that a smaller slice of that growing pie is reaching the classroom. A decade ago, more than 60 percent of Columbus expenditures went toward student-facing services, paying for instruction and pupil support (see Figure 9). This peaked at nearly 70 percent during the pandemic, as shuttered buildings produced savings on operations and transportation. By last year, however, only 55 cents of every dollar spent by the district was going into the classroom.

The share of total expenditure on operations—including building maintenance, student transportation, and food services—has risen from 20 percent in 2015 to 25 percent a decade later. Since overall spending has grown sharply during this period, the absolute dollar amount spent per student on operations has increased by an astronomical 230 percent over this period. The refusal of the school board (until recently) to close underutilized buildings, even as enrollment declined, has contributed to these growing costs.

Increasingly, Columbus seems to operate primarily as an adult employment agency, where academic instruction and student learning are merely incidental and of secondary importance.

Figure 9. Share of Columbus expenditures by service category

Vlad Kogan blog on CCS finances figure 9

Dark path ahead

The Columbus story—irresponsible spending of one-time pandemic aid, failure to match staffing to enrollment trends, diverting money from core academic functions, and blaming the state without taking responsibility for imprudent decisions—likely applies to many other Ohio districts facing budget challenges today.

Unfortunately, the news will probably get worse. The two simplest solutions from the point of view of district leaders—more state aid and local property tax increases—are unlikely to materialize in the current environment.

Medicaid costs already account for half of the state budget, and recent changes in federal law that push more of these and other social program costs to the states will create significant pressure on the Ohio budget. If the economy tips in to recession, state revenues will decline sharply, and policymakers facing massive deficits will be in no position to increase K–12 spending.

Similarly, the backlash to rising property values have fueled an effort to abolish property taxes, and recent state reforms designed to alleviate these demands have removed many of the tricks districts previously used to passively increase revenues without voter approval. In many communities, convincing voters to increase their taxes will be an uphill battle.

Districts around the states will have to make hard decisions, including prioritizing academics. This means implementing layoffs wisely—based on teacher quality, not seniority—and finding efficiencies that both reduce costs and help students, such as shuttering failing and underenrolled schools.

Columbus offers a critical test case for whether local officials will actually make the necessary but politically unpopular decisions. The district’s recent track record, unfortunately, is not encouraging. 

Vladimir Kogan is a senior research fellow at the Thomas B. Fordham Institute and a professor of political science at the Ohio State University. He is the author of the 2025 book No Adult Left Behind: How Politics Hijacks Education Policy and Hurts Kids (Cambridge University Press).


[1] In addition to being highly misleading, for the reasons I describe in this article, it’s unclear where the numbers in Chapman’s comments are coming from. She may have misspoken, referencing 2022 instead of 2021 as the high point in state funding. But the other figures don’t match those in the district’s five-year financial forecast.

[2] In their enthusiasm in lobbying in favor of the direct-funding reform, Columbus leaders apparently failed to anticipate an unintended consequence that reduced some of the financial upside. Previously, charter and voucher-receiving private school students counted as part of total Columbus enrollment, making the district look poorer. When these students were removed from the denominator after the shift to direct-funding, Columbus became much wealthier on paper—with assessed property values per pupil rising from just below $173,000 in 2021 to $290,000 in 2022—thereby reducing the district’s eligibility for state funding, which is allocated on a need basis.

[3] My calculations use the state foundation formula settlement reports and subtracts transfers made for charter schools, open-enrollment students, and voucher students and payments to education services centers. I also don’t include state funding related to preschool special education. This provides the cleanest “apples-to-apples” over-time analysis, but does not account for other state sources of revenue that are not allocated through the statutory funding formula, including casino revenues and money to compensate for certain property tax exemptions.

[4] Some might reasonably object to using official consumer price measures to adjust costs over time, since school districts don’t purchase the same “basket” of goods used for this calculation and instead spend over 80 percent of the dollars on salaries and benefits. As it turns out, the Employment Cost Index for professional employees during this period grew slower than overall inflation, so using that alternative deflator would actually make the Columbus spending increase look even more striking.

[5] Figure 5 uses data from personnel reports provided to the school board at every meeting and reflects filled, not budgeted, positions. I use counts from the first regular board meeting of each school year. If I instead take staffing data from January of each year, the changes in staffing over time remain similar, although the increase in teacher numbers is somewhat smaller. Note that the staffing data begin starting in the 2015–16 school year because the format of the report changed that year and is not directly comparable to earlier periods.

[6] Comparing changes in proficiency rates in Columbus to trends only in the other large, urban districts rather than the entire state paints a mixed picture, at best. Columbus has fallen behind the other Ohio urban systems in half of the tested grades and subjects during the same period.

Policy Priority:
School Funding
Topics:
School Finance
Robert Pondiscio
4.9.2026
Empty classroom desk
Listen to this article
Loading the Elevenlabs Text to Speech AudioNative Player...

The school district in the upstate New York town where I live and pay taxes—and where I ran unsuccessfully for the local school board a few years ago—is beginning a search for a new superintendent. I’m not on the board, and the voters made clear they preferred it that way. But the changing of the guard has me thinking about what I would do if I were in the board members’ position.

Hiring a superintendent is the single most important decision a school board makes. The chief executive officer of a school district, the supe is responsible for overseeing operations, managing personnel and budgets, implementing board policies, and ensuring the effective administration of schools. He or she shapes not just policy but the daily experience of students and teachers for years to come. And given how frequently superintendents come and go—often before their ideas have time to take root (or get revealed as ineffective)—the real challenge is not simply choosing the right person, but creating the conditions for durable success.

In my recent writing on durable school success, I’ve argued that the rare school systems that improve and remain high-performing share a few common traits: coherence, focus, and the ability to resist the constant pressure of change for change’s sake. Thus, leadership churn is one of the greatest threats to durability. The onus is on school boards to ask not just, “Who should we hire?” but “How do we create conditions for the new superintendent to create or sustain success?”

A good place to start is by asking better questions.

Hire for the job you actually need done

Most superintendent searches begin with a generic profile: visionary leadership, strong communication skills, commitment to equity. A better approach is to begin with the district’s actual problems:

What are the three or four issues that must be solved in the next five years? What would success look like by the end of the new superintendent’s contract? Improving early literacy? Stabilizing staff turnover? Bringing coherence to curriculum and instruction? Superintendents should be hired to solve specific problems, not simply to “lead.”

Ask about execution, not vision

Education rewards charismatic figures who can talk compellingly about change. School districts need people who have actually delivered it. Ask candidates: What initiative did you lead that measurably improved student outcomes? What did you stop doing when it wasn’t working (and how did you know)?

The gap between announcing a reform and implementing it is vast, and the classroom is where ideas—good, bad, and mediocre—go to die. These questions force candidates to move beyond bromides and homilies and into the mechanics of implementation.

Rage against the initiative machine

One of the most common, yet least discussed, features of school systems is initiative churn. Programs appear, disappear, and reappear either rebranded or in slightly different forms. Teachers adapt to one set of expectations only to be told shortly thereafter that the district is moving in a new direction.

Ask candidates: What did you say “no” to in your last district? How do you prevent mission creep or initiative overload? Stability rarely comes from discovering the perfect new program; it comes from protecting the ones that already work.

Test their understanding of teaching

A simple but revealing question: What does a strong lesson look like? Follow-ups might include: What is the hardest part of teaching well today? What professional development have you led, seen, or approved that actually helps teachers improve?

A candidate who cannot answer these questions concretely is unlikely to improve classroom practice in the district.

Focus on the instructional core

Raising student achievement is not one priority among many. It is the work of a school system and defines a quality district. Everything else—operations, facilities, communications, politics—is in service of that goal or a distraction from it.

Superintendents are not just the district’s CEO. They are (or ought to be) the de facto chief academic officer, responsible for setting the instructional direction of the system: establishing priorities, selecting and implementing curriculum, ensuring coherence across schools and grade levels, and aligning resources—time, money, and people—around improving teaching and learning. That level of granularity might sound unnecessary, even naïve. It’s worth keeping in mind that, while our education debates are often framed around large urban districts, they are statistical outliers: The typical district is far smaller—one reason governance and leadership look or should look very different in most of the country. Even in small to medium-sized districts, the superintendent’s role is unavoidably political. But politics is not the purpose of the job. Improving teaching and learning is—and even in the largest systems, instructional savvy is indispensable to getting it done. So boards should press candidates directly:

  • What role should a superintendent play in selecting curriculum?
  • How do you ensure that adopted materials are actually used well in classrooms?
  • How do you balance teacher autonomy with the need for instructional coherence?
  • What evidence do you rely on when evaluating instructional practices?

And perhaps most revealing:

  • What would you do if you discovered that classroom instruction across your district was inconsistent or ineffective?

In a well-run district, everything points back to the classroom. And the superintendent is ultimately responsible for making sure it does. A candidate who sees curriculum as merely a procurement exercise or instruction as something best delegated to teachers is unlikely to move the needle on student outcomes. He or she understands that, while they do not teach children directly, they shape the conditions under which teaching happens.

In part, that means protecting teachers’ time. Dylan Wiliam often observes that when teachers are asked to identify something that they will stop doing or do less of to create time and space to improve their teaching, they fail miserably, concluding that everything they do contributes to student learning. “The essence of effective leadership is stopping people from doing good things to give them time to do even better things,” he wrote.

Probe governance and temperament

Even capable superintendents fail when the relationship with the school board breaks down. Boards should ask: How do you handle disagreement with a school board? How do you manage political pressure from the community?

The job is inherently public and often contentious. Temperament—calm under pressure, intellectual humility, and a willingness to play the long game—matters more than many boards realize.

Why this job?

Finally, I’d ask “Why do you want to lead this district?”

A serious candidate will demonstrate familiarity with the community and its challenges. As with any job, a weak candidate will offer a generic answer that could apply anywhere.

Hiring a superintendent is the most important decision a school board makes. But it is not a one-time event. It is the beginning of a relationship that will either enable or undermine long-term success.

The lesson of durable success is not that schools need better ideas. It’s that they need the discipline to stick with good ones long enough to matter.

Policy Priority:
High Expectations
Topics:
Governance
Teachers & School Leaders
Aaron Churchill
4.9.2026
Path arrows
Listen to this article
Loading the Elevenlabs Text to Speech AudioNative Player...

It’s not often that a conservative education secretary and a progressive teachers union boss see eye to eye. But such a convergence occurred last year, when Secretary Linda McMahon told a congressional committee that a “four-year college is not for everyone” and, a few months later, President Randi Weingarten of the American Federation of Teachers said almost the same thing in The New York Times. Rather than continuing to push a “college for all” approach, both voiced support for stronger career and technical education to help more young people transition from high school to the workforce.

With bipartisan support from many governors and legislators, career and technical education has also risen on state policy agendas. Leaders have promoted industry-recognized credentials as a tool to validate students’ technical skills and to aid transitions into the workforce. In Ohio, such credentials are used in three principal ways: (1) Students can use them to meet alternative high-school graduation requirements; (2) schools receive credit on the state report card when students earn them; and (3) schools receive extra state funding (currently up to $725 per credential) through the Innovative Workforce Incentive Program (IWIP).

For graduation and report-card purposes, Ohio has approved an expansive list of 693 credentials tied to jobs in 13 career clusters (e.g., agriculture, business, and healthcare). These credentials include anything from basic CPR and job-safety certificates to full occupational licenses. The state’s IWIP credentials are more selective—focusing on fields like IT and advanced manufacturing. Today, just 210 credentials qualify for these funds. Due to this trio of policies encouraging credentials, student participation and attainment have soared: 26 percent of Ohio’s class of 2024 earned credentials during high school, whereas just 2 percent of the class of 2014 did so.[1]

But how beneficial are such industry credentials for those obtaining them in high school? This is a critical question that state policymakers are wrestling with, though few studies have shed light on their value. A prior Fordham Institute report found that credential earning in Texas was associated with modest wage increases in the year immediately after high school; another study, from Florida, linked credentials to college attendance.

Fordham’s new study, College or Career Readiness? Postsecondary and Labor Market Outcomes for Ohio High School Students Earning Industry-Recognized Credentials, is the first from Ohio to examine industry credentials, and alongside a recently published report from Texas, is one of the first nationally to study how they relate to students’ longer-term outcomes. Author Jay Plasman of Ohio State University focuses on postsecondary education and labor market outcomes for students in the high school classes of 2016 to 2022, a span of time that covers cohorts affected by the state’s early rollout of credential policies.

Here are Dr. Plasman’s main findings:

1. Credentials typically provide students with an income boost right after high school, but wage returns weaken over time. In the year immediately after high school, students who earn an industry credential have an average annual income that is 21 percent higher than their non-credential-earning peers of similar demographic and academic backgrounds. However, the wage return on a credential falls to just 5 percent by the time (former) students reach their mid-twenties. That diminution may be partly due to students (without credentials) earning college degrees. It’s also possible that some credentials help young people get their foot in the employment door but don’t help them climb the ladder after that.

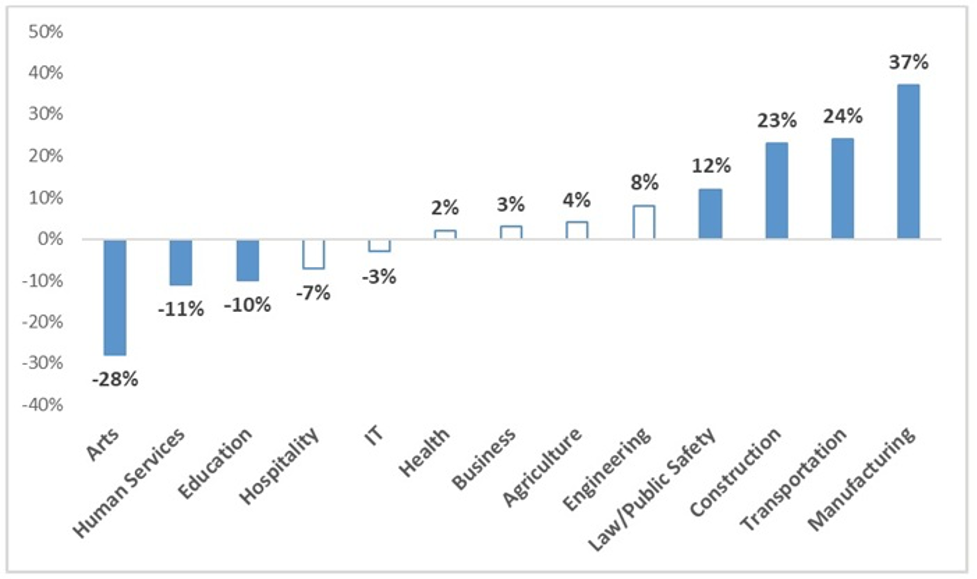
2. Some credentials hold value as students reach their mid-twenties—but others do not. As figure A shows, credentials in construction, transportation, and manufacturing are associated with stronger and more enduring wage returns. For instance, the average student attaining a manufacturing credential—e.g., a welding or mill-operating certificate—earned wages at age 25 that were 37 percent higher than a peer who did not attain a credential during high school. Credentials in other career clusters have less certain long-term economic value by the time students reach their mid-twenties.

Figure A: Credentials’ wage returns seven years after high school, by career cluster

1

Note: Solid bars indicate statistically significant wage gains or losses. Information about which specific credentials are tied to each career cluster is available here.

3. Young men benefit more from credentials. By their mid-twenties, male credential-earners have annual incomes 23 percent higher than students who have not earned credentials, while female credential-earners enjoy no wage advantage at all (their returns are actually negative). This reflects the fact that males attain far more of the high-value credentials in such industries as construction, manufacturing, and transportation.

4. Credentials are associated with higher wage returns when paired with career and technical education course completion. Students do not necessarily need to complete formal coursework to earn a credential; some credentials can be earned through self-paced learning modules and passing a skills assessment. But those students who combine structured coursework and an industry credential earn higher wages than those who only earn a credential: 18 percent more by their mid-twenties, versus 4 percent for students with only a credential.

5. Earning industry credentials is, on average, negatively associated with college attendance and degree completion. While this finding isn’t entirely surprising, it does contrast with prior studies suggesting that career and technical education might increase college-going. It’s not entirely clear what is behind the negative relationship. Although the analysis includes a rich set of control variables, the results may reflect unobserved characteristics (e.g., less motivation to pursue higher education) that contribute to credential earners’ lower college attendance rates. Credential earning could also be “nudging” students toward the workforce and away from college.[2] There may also be variation in post-secondary outcomes by the type of credential-earned, an issue not examined here but one that warrants further study.

What are the real-world implications of this analysis? Industry credentials should remain an integral part of a robust career-and-technical education system that also includes rigorous coursework and work-based learning. Yet not all credentials hold equal value. With that in mind, the study offers the following recommendations for state policymakers, both in Ohio and elsewhere.[3]

  • Be selective about which credentials are approved. Some industry credentials unlock value for students—and Ohio has done a respectable job of identifying those types for IWIP. But many others do not, including some that Ohio has approved for graduation. State leaders should be wary of approving low-value credentials, lest they inadvertently push students away from college or into jobs with little durable payoff.

  • Gauge credentials’ economic value based on longer-term outcomes. The study shows the importance of examining credentials over a longer timeframe. To wit, the cosmetology credential is associated with a modest income return immediately after high school, but its value disappears six years after high school. States should prioritize credentials that offer enduring value to students, not just a short-term boost.

  • Create high-value credential opportunities for disadvantaged students. The study indicates that economically disadvantaged pupils tend to earn lower-value credentials, a finding that mirrors data presented elsewhere showing that students in urban areas are racking up a great many questionable credentials en route to their high school graduation. In Ohio, we need more programs such as Toledo Public Schools’ new commercial driver’s license program and fewer programs that add little value to students’ career prospects.

  • Don’t substitute credentials for academic competence. For graduation purposes, Ohio permits students to substitute credentials for math and reading competency as measured by a state test. This is misguided policy, especially as the state has struggled to evaluate credentials and ensure quality control. Today, thousands of Ohio students exit high school with weak academic skills and credentials whose value will likely evaporate quickly. It’s important to encourage students to develop specialized technical skills and pursue individualized pathways, but not at the expense of basic English and math competency.

Young people should have opportunities to do something they love and to secure jobs that pay enough to support a family—and do all this without having to spend four years in college. That’s a tall order, but rigorous career and technical education can help many students get on the right path. Industry credentials can and should continue to play a key role in the future of career-tech in America. Let’s make sure that they are being used wisely and that they truly pay off for students who earn them.

Policy Priority:
Personalized Pathways
Topics:
Career & Technical Education
Curriculum & Instruction
Governance
Teachers & School Leaders
Andy Smarick
4.9.2026
Kids boarding a school bus
Listen to this article
Loading the Elevenlabs Text to Speech AudioNative Player...

I’m a longtime zealot for school choice. I think students, families, schools, and communities benefit when we have a variety of education options and parents get to match their kids to learning environments.

But that doesn’t mean the longstanding America system of residentially assigned public schools has nothing going for it. In fact, I think choice advocates have hurt their own cause by failing to appreciate the virtues of neighborhood schools. Always, but especially in this era of alienation and polarization, we need to take advantage of the institutions that connect us to others—and traditional public schools are one of those institutions.

There are two types of “community,” and both are valuable.

School choice prioritizes the voluntary understanding of community. This has particular resonance in America because of our enormous diversity and our unusual capacity for forming groups without government direction. School choice is built on the conviction that families can have very different preferences and that those differences deserve respect. This is made possible by the fact that lots of community-based groups and educators want to create and run schools that reflect their own visions of the good life. If policy supports an expansive, diverse educational landscape, we enable more families to find the right fit, and we give power to kids, parents, educators, and local nonprofits.

The types of communities that emerge are the result of voluntary choices—people choose to start schools, people choose to teach in these schools, people choose to enroll their kids in these schools. This elevates the “pluribus” part of e pluribus unum—out of many, one. School choice recognizes that we are many.

Neighborhood public schools are built on a geographic understanding of community. People live in a place and are part of that society because of proximity. They shop at the same stores, eat at the same restaurants, walk in the same parks. And their kids go to the same schools. Because of this familiarity, they build bonds, sympathies, networks of mutual support, and shared experiences that are good for collective life.

Because geographic areas can be diverse in terms of background, income, and more, neighborhood schools help bridge our differences. We meet, work with, and learn with others. These schools are part of a democratically controlled system, meaning the geographic community—parents and nonparents alike—shares responsibility for its schools. The community builds solidarity through collective power and collective duty.

Neighborhood schools can pass along to the next generation a geography’s customs and sensibilities. These schools can be entwined—after years of collaboration—with the local library, local charities, local health clinics. They can have longstanding relationships with close-to-home employers and colleges. They are the place where people vote and watch basketball games. They are an actual, physical representation of an area’s investment in the future.

Of course, school boundaries can appear arbitrary. Sometimes they cut down the middle of a street or split a town in two. But that’s because central-office administrators need to think about bus routes and classroom capacity. Yes, the lines a superintendent’s team draws can serve the purposes of the bureaucracy better than the community’s families.

And yes, school boundaries have sometimes been drawn to divide people by race and class. That’s awful. And yes, the very nature of school boundaries and the residence-based assignments they support can force some families into schools that are ineffective or unsafe. That is unjust.

All of these things should be addressed by policymakers and administrators. They can undermine the health of an education system and the satisfaction of families.

But those things don’t erase the value of neighborhood schools. The virtues of geographic-based communities should not be ignored, even if we decide, in particular circumstances, the school-choice side of the scale is weightier.

Editor’s note: This first appeared as a comment in Mike Petrilli’s Substack, SCHOOLED.

Policy Priority:
High Expectations
Topics:
Governance
Jeff Murray
4.9.2026
Chalkboard arrow
Getty Images/Rytis Bernotas
Listen to this article
Loading the Elevenlabs Text to Speech AudioNative Player...

Hot on the heels of a recent report that postulated a lower-than-commonly-believed economic benefit of formal schooling comes a brand new analysis that offers more proof of high marginal returns to education. Who is winning the battle of the impact estimates?

The earlier report (which we will call Clark, the name of its lead author) was a meta-analysis of 79 previous studies that the authors concluded showed evidence of two types of publication bias. These combined to suppress findings of small or null impacts of an additional year of education on individuals’ future earnings, leading to an overestimation of positive benefits. If those biases were not in place, Clark says, typical income boosts would be in the range of 0 to 3 percent. At least two of the papers cited in Clark were co-authored by Harry Anthony Patrinos and George Psacharopoulos, researchers from the University of Arkansas and the London School of Economics, respectively. Now Patrinos and Psacharopoulos have published a brand-new report that once again supports the more-commonly-found positive impacts in the 8 to 10 percent range…and more besides.

Their new paper is also a meta-analysis, comprising 191 impact estimates from 145 studies across 54 countries, including 45 of the studies also analyzed in the Clark paper. Cognizant of the findings in Clark, Patrinos and Psacharopoulos look to overcome the publication bias questions by compiling the “most comprehensive” collection of studies that report both ordinary least squares (OLS) regressions and other credibly causal estimates of economic impact to allow for comparison—especially estimates using instrumental variables (or IV) regressions. They also document and discuss the changing geographic and temporal composition of the evidence base (that is, increasing evidence from low-income and low-educational-attainment contexts) and why that matters to outcomes. Their paper, they write, “does not provide new causal estimates of the return to schooling; instead, it analyzes how different identification strategies shape the magnitude and interpretation of reported returns, documenting systematic patterns across credible designs and clarifying their economic meaning.”

By comparing the impact findings in the two types of regressions, they observe three widely-documented empirical findings in their meta-analysis. First, estimated returns to schooling are consistently positive under both OLS and causal identification strategies. Second, IV-based estimates of impact exceed OLS estimates in the majority (78 percent) of cases reviewed. Third, the magnitude of the IV–OLS gap shows systematic variation driven by income levels. Specifically, the gap is substantially larger in lower- and middle-income economies than in high-income contexts. This pattern is not driven by a small number of outliers but reflects a broad regularity across studies, instruments, and study locations. Patrinos and Psacharopoulos interpret these findings as reflecting high marginal returns in low-educational-attainment environments and the fact that IV analysis identifies local average treatment effects of specific policy changes.

If true, these findings would serve to refute the idea that publication bias is driving up impact estimates, as the Clark paper argues. Instead, they indicate that causal estimates are specifically identifying very high returns to education for first-generation secondary or post-primary completion, which is more prevalent in lower- and middle-income economies. And while other returns may be lower—some even near zero despite being in similar low-income contexts, as Clark argues—the average income gains for an additional year of formal education would still settle out in the typical 8 to 10 percent range due to the very high impacts in those specific contexts.

Patrinos and Psacharopoulos conclude that their findings not only refute Clark, but actually make an even stronger case for the value of education for disadvantaged and lower-income populations. “Well-designed education policies,” they conclude, “that expand access to high-quality schooling remain a central instrument for promoting individual prosperity and supporting long-run economic development.” They recommend future research to quantify the relative contributions of specific contextual factors such as national income level and local test score variations and expanded investigations in using credible causal designs in low-income country settings where data are currently scarce.

SOURCE: Harry Anthony Patrinos, and George Psacharopoulos, “Causal returns to education,” International Journal of Educational Development (March 2026).

Policy Priority:
High Expectations
Topics:
Evidence-Based Learning
Jessica Poiner
4.8.2026
Next frontier SoR blog image
Getty Images/Pressmaster
Listen to this article
Loading the Elevenlabs Text to Speech AudioNative Player...

In 2023, Ohio lawmakers established a statewide initiative grounded in the science of reading, an evidence-based instructional approach that focuses on phonics and knowledge-building. The ultimate goal of the initiative is to boost Ohio’s troublingly low reading scores. And since studies show that teachers matter more than any other element of schooling, Ohio will need a teacher workforce that’s well-trained in reading science to make meaningful progress.

To their credit, policymakers attempted to beef up training for reading teachers well before they established a statewide initiative. State law has long required teacher candidates to complete a certain number of college coursework hours covering topics like phonics and reading instruction. Candidates are also required to pass a Foundations of Reading exam to determine whether they have mastered the requisite knowledge.

But these policies—both of which remain in effect—weren’t enough on their own to ensure that teachers were entering the classroom with a strong foundation. In fact, a 2023 NCTQ report found that just a third of Ohio’s elementary teacher preparation programs were providing adequate coverage of all five components of reading science.[1] Even worse, more than half were promoting approaches contrary to research-based methods—things like three-cueing, which encourages students to use pictures or context clues to guess at words instead of using phonics-based word recognition skills.

To address this issue, policymakers took a two-pronged approach. First, they focused on future educators by requiring the Ohio Department of Higher Education to conduct audits of the state’s teacher preparation programs to ensure their alignment with reading science. (Findings from the first round of audits were published in December.) Second, they focused on current educators by requiring all teachers and administrators to complete a professional development (PD) course in the science of reading. Going forward, DEW will maintain this introductory course and develop a new, competency-based one that licensed teachers must complete every five years.

In short, Ohio has made a lot of progress. But while introductory courses and five-year refreshers are helpful, they shouldn’t be the only PD opportunities available in a subject that can have such a massive impact on students’ futures. Teachers—and kids—deserve more.

One way to give it to them is by providing curriculum-based professional learning (CBPL), or development that’s grounded in the specific curriculum and instructional materials that teachers use in their classrooms. CBPL pairs high-quality curriculum and materials with regular training and consistent coaching that gives teachers individualized feedback on how they’re using the materials they interact with on a daily basis. Compared to traditional PD, CBPL is “active, ongoing, and focused on improving the rigor and impact of teachers’ lessons.” When done right, it aligns with the elements of effective professional development.

Teachers regularly participate in PD that covers a broad range of issues, from student safety and classroom management to AI and ed-tech. CBPL, however, is harder to come by. According to a RAND report, just 40 percent of Ohio teachers reported in 2021 that they engaged in collaborative learning on English language arts materials at least four times a year. Only 13 percent said they engaged in workshops or trainings on materials. A measly 8 percent said they received coaching on materials.[2]

State policymakers should ensure that more teachers have access to CBPL, especially in reading. A quick look at Ohio’s list of approved reading curricula reveals that all of the providers claim to offer some form of curriculum-based PD. But the quality and depth of these offerings is unclear. Are they seminars or videos that require teachers to just sit and listen? Or are they collaborative experiences that permit teachers to ask questions, engage with peers, and receive guidance from experts and mentors? Do they provide teachers with opportunities to practice what they’ve learned, receive feedback, and try again? Or are they one-and-done experiences that simply check a box?

To be clear, evaluating the curriculum-based PD that providers offer was not on the original agenda for DEW. The department was charged with identifying high-quality curricula and materials and creating an entry-level reading science course. It accomplished both. Now it’s time to take the next step, and that means providing teachers with ongoing, in-depth development that’s aligned to reading science and the specific curricula and materials they’re using.

Other states have proven this is possible. The Rhode Island Department of Education, for example, publishes a list of approved CBPL providers, all of whom hold statewide contracts through Rhode Island’s master price agreement and were selected through a statewide RFP. For districts interested in partnering with external vendors, the department provides a link to the professional learning partner guide offered by Rivet Education, a consulting group that’s already done the work of vetting providers. Rivet’s recommended partners for the science of reading or curricula that appear on Ohio’s approved list include well-respected organizations like Amplify, Education First, Relay Graduate School of Education, and TNTP.

Ohio policymakers should follow Rhode Island’s lead. They could start by calling on DEW to send out an RFP for CBPL providers that specialize in the reading curriculum and materials that appear on the state’s approved list. DEW (or a chosen contractor) could then vet applicants and establish an approved list like the one in Rhode Island. From there, Ohio policymakers could incentivize districts to offer CBPL by covering the cost if they choose to work with a provider on the state’s list.

Some lawmakers might balk at the idea of spending more money on early literacy. After all, Ohio has already invested roughly $200 million via its last two state budgets. But incentivizing districts and schools to offer CBPL is a win for everyone. Teachers would receive in-depth and ongoing training that’s customized to the materials they use every day. Administrators would have teachers and staff that not only feel better-supported but actually are better-supported, freeing up time, attention, and funds to spend elsewhere. Students would benefit from teachers who are beefing up their knowledge and improving their instructional practice. And policymakers who are eager to boost reading achievement would be one step closer to doing so.

Ohio leaders deserve kudos for how far the state has come with the science of reading. But now that the foundation is in place, it’s time to start building. Governor DeWine’s plan for instructional implementation teams and additional reading coaches is a good one. Adding CBPL to the mix would be even better.


[1] The five components are phonemic awareness, phonics, fluency, vocabulary, and comprehension.

[2] The report found similar numbers for math.

Policy Priority:
Standards & Accountability
Topics:
Curriculum & Instruction
Jeff Murray
4.8.2026
Gadfly Bites logo
Listen to this article
Loading the Elevenlabs Text to Speech AudioNative Player...

News stories featured in Gadfly Bites may require a paid subscription to read in full. You have been warned.

  1. It’s an all-voucher edition of the Bites today. First up: Another look at House Bill 715, designed to “provide parents and the public with more information about the performance of private schools” that accept students using EdChoice and Ohio’s other voucher programs. You can take a look at the details on what is and isn’t in the bill (specifically as compared to an earlier version of the legislation) for yourself. But the most important thing we learn here is that one of the co-sponsors has a tickler on his schedule to call the House Education Committee Chair at the end of April so that the bill can have its first hearing when the General Assembly returns after the May primary election break. I personally love getting that kind of insider detail on the operations of our representative government. How about you? (Cleveland.com, 4/7/26)

  2. However, none of the above effort to “preserve the awesome educational benefits of Ed Choice, Autism, and Peterson Special Needs scholarships for private school students and their parents” may even be necessary since the next hearing date for the voucher groucher lawsuit is scheduled for May 12 in the 10th District Court of Appeals, at which point every one of those programs—and their awesomeness—could be eliminated. (Spectrum News 1 Ohio, 4/8/26)

Did you know you can have every edition of Gadfly Bites sent directly to your Inbox? Subscribe by clicking here.

Policy Priority:
School Funding
Topics:
Governance
Renu Mukherjee
4.7.2026
Walter Payton College Prep High School
Steven Vance/Flickr
Listen to this article
Loading the Elevenlabs Text to Speech AudioNative Player...

2026 is a watershed moment for Chicago Public Schools (CPS). For the first time in history, the Windy City will, come November, move from a fully appointed or partially appointed school board to one that is entirely elected. This transition—set in motion by a 2021 law championed by the Chicago Teachers Union (CTU)—marks the end of a 30-year period wherein the city’s mayor had unilateral power to appoint both the Board of Education and district leader. And it may mark the end of Chicago’s selective enrollment high schools.

Progressive politicians and their teachers union allies have framed Chicago’s shift away from mayoral control of schools as a win for local democracy. In reality, it may jeopardize the district’s “open enrollment” or “choice” system, which has long been treasured by CPS families. Under this system, students aren’t required to attend their zoned neighborhood schools. Rather, they can apply to schools that have open seats in other neighborhoods, schools with International Baccalaureate (IB) programs, charter schools, or selective enrollment schools, which use standardized tests and grades to determine student admissions. During the 2022–23 academic year, 44.5 percent of elementary school students and 76.2 percent of high school students chose to attend a school other than the one assigned to them by CPS.

CPS families unequivocally support school choice, but that has not stopped some lawmakers and the CTU from trying to replace the open enrollment system with one that confines students to their neighborhood schools. These efforts came to a head in December 2023, when the Board of Education approved a resolution encouraging CPS to “transition away from privatization and admissions/enrollment policies and approaches that further stratification and inequity in CPS and drive student enrollment away from neighborhood schools.” Nine months later, the board officially passed a five-year plan to eliminate Chicago’s open enrollment system.

Progressive lawmakers and the CTU have directed particular ire toward the city’s 11 selective enrollment high schools, eight of which rank among Illinois’s top 25 schools. Admission to these schools is determined by a student’s final seventh-grade report card and score on an entrance exam. Each CPS household is assigned a socioeconomic tier from 1 to 4, with 1 representing lower-income neighborhoods and 4 representing higher-income neighborhoods. Applicants compete for a seat against other students in their tier. The city awards 30 percent of seats based on citywide academic performance, while the remaining 70 percent of seats are distributed among tiers.

Allocation of school resources in CPS is based, in part, on enrollment numbers. Any plan that requires greater enrollment at neighborhood schools will, then, result in fewer resources—or even closure—for these schools. With no laws currently in place to protect these institutions, the 2026 school board election has become a final line of defense. If voters elect a board hostile to competition and merit, then that may spell the end of educational choice in Chicago.

Critics of the selective enrollment high schools claim that they contain few, if any, so-called underrepresented minorities or low-income students, take resources away from neighborhood schools, and further educational inequities between White and Asian American students, on the one hand, and Black and Hispanic students, on the other. Let’s consider the validity of these claims and others.

To start, the history of Chicago’s selective enrollment high schools disproves the myth that these institutions encourage educational segregation. Lane Tech College Prep, the city’s first selective enrollment high school, was established in 1958 to train “budding scientists” amidst widespread concern that the U.S. was not producing enough scientists and engineers. In 1962, a second selective enrollment high school—Whitney M. Young Magnet High School—was founded as part of then-Superintendent James Redmond’s plan to get CPS families to voluntarily desegregate by opening magnet schools. Several more selective enrollment schools were founded under Paul Vallas, appointed the first-ever CEO of CPS by Mayor Richard M. Daley; Vallas viewed them as a way to keep high-performing students of all racial, ethnic, and socioeconomic backgrounds from leaving CPS for the suburbs or private school. Two additional selective enrollment high schools opened in 2009 and 2011 at the request of Black and Hispanic Chicagoans. In 2015, then-Mayor Rahm Emanuel opened the city’s 11th selective enrollment high school.

What’s more, data from the Illinois Board of Education show that selective enrollment high schools benefit academically advanced CPS students, including those who are Black, Hispanic, or low-income. The same cannot be said for the district as a whole.

Indeed, at the five selective enrollment high schools that rank among Illinois’s top 25 schools and had the requisite data available, the Black-White achievement gaps in ACT English and math were, in 2025, considerably smaller than CPS. The average 11th-grade Black-White achievement gap in ACT English for these schools was -17.8 percentage points (versus -51.3 for CPS), while that in ACT math was -29.2 percentage points (versus -53.1 for CPS).

The Hispanic-White achievement gaps at Chicago’s selective enrollment high schools tell a similar story. At the six such schools that rank among the state’s top 25 schools and had the requisite data available, the average 11th-grade achievement gap in ACT English was -9.0 percentage points (versus 37.3 for CPS), while that in ACT math was -18.0 percentage points (versus -42.7 for CPS).

And contrary to what progressives and the CTU allege, Black and Hispanic students, in 2025, constituted a majority at three of the city’s top eight selective enrollment high schools and a plurality at four others.

Likewise, at least 33 percent of students at each of these specialized schools were classified as low-income last year, meaning that they received free or reduced-price lunch, lived in substitute care, or were from families that received public aid. In CPS, the achievement gap between low-income and non-low-income students in ACT English was -31.6 percentage points, and in ACT math, -30.5 percentage points. By contrast, the average gaps in selective enrollment high schools were only -7.0 (English) and -10.9 (math).

Did Black, Hispanic, and low-income students at Chicago’s top eight selective enrollment high schools outperform the district averages for their groups on the ACT because these schools spend more per student? No.

In fact, the opposite was true. In 2025, CPS spent, on average, $3,285 more per student than its top eight selective enrollment high schools—only to achieve markedly worse results.

Selective enrollment high schools in the U.S. offer academically advanced, public school students a rigorous education and opportunities typically only available in private schools. They are, in this way, a great equalizer in American secondary education. Data from the Illinois Board of Education show that Chicago’s selective enrollment high schools and the open enrollment system in which they operate have succeeded in this mission. These institutions—that are treasured by, and represent a lifeline to, talented students trapped in a failing district—ought to be celebrated, not eliminated.

Policy Priority:
High Expectations
Topics:
Evidence-Based Learning
Curriculum & Instruction
Governance
Advanced Education

Pagination

  • First page « First
  • Previous page ‹ Previous
  • Page 43
  • Page 44
  • Page 45
  • Page 46
  • Current page 47
  • Page 48
  • Page 49
  • Page 50
  • Page 51
  • Next page Next ›
  • Last page Last »
Fordham Logo

© 2026 The Thomas B. Fordham Institute
Privacy Policy
Usage Agreement

National

P.O. Box 110
Burke, VA 22009

202.223.5452

[email protected]

Ohio

P.O. Box 82291
Columbus, OH 43202

614.223.1580

[email protected]

Sponsorship

130 West Second Street, Suite 410
Dayton, Ohio 45402

937.227.3368

[email protected]