Mobile Navigation

  • National
    • Policy
      • High Expectations
      • Quality Choices
      • Personalized Pathways
    • Research
    • Commentary
      • Gadfly Newsletter
      • Flypaper Blog
    • Events
    • Scholars Program
  • Ohio
    • Policy
      • Priorities
      • Media & Testimony
    • Research
    • Commentary
      • Ohio Education Gadfly Biweekly
      • Ohio Gadfly Daily
  • Charter Authorizing
    • Application
    • Sponsored Schools
    • Resources
  • About
    • Mission
    • Board
    • Staff
    • Career
Home
Home
Advancing Educational Excellence

Main Navigation

  • National
  • Ohio
  • Charter Authorizing
  • About

Aaron Churchill
4.28.2026
School calendar blog image
Getty Images/thomas-bethge
Listen to this article
Loading the Elevenlabs Text to Speech AudioNative Player...

Discussions about the “resources” needed to educate students usually revolve around money. Yet cold hard cash isn’t the sole “input” bearing on educational success. Time—both the length of school year and day as well as how those hours are spent—also makes a big difference. As a literature review by Matthew Kraft and Sarah Novicoff found, adding instructional time improves student achievement. Conversely, decreasing time (e.g., through four-day weeks) reduces achievement. Though not in their analysis, the disastrous pandemic-era experience made abundantly clear the massive negative impacts of diminished and disrupted learning time.  

Long before this research or Covid existed, the commonsense notion that time matters was stressed in the landmark Nation at Risk report (1983). There, the authors wrote:

We recommend that significantly more time be devoted to learning the New Basics. ... School districts and state legislatures should strongly consider 7-hour school days, as well as a 200 to 220-day school year.

The U.S. has never moved toward 200-day school year, at least not at scale. The historical standard at the time of a Nation at Risk, and still largely in place, is a 180-day school year. As the Pew Research Center reports, thirty-four states had a 180-day minimum in 1989, and thirty-one states required at least 180 days as of 2023.

Until 2014, Ohio had been one of the states requiring at least 180 days of pupil instruction. This standard, however, was abandoned amid a shift toward a minimum hour requirement. Today, district schools must be “open for instruction” each year for at least 910 hours in grades K-6 and 1,001 hours in grades 7-12.[1]

The move to hours was probably an effort to provide schools more flexibility around scheduling. But it’s also led to noticeably fewer days of pupil instruction and significant reductions in the amount of instructional time students receive each year—a problem that Ohio Representative Adam Bird pointed out in committee testimony last year.

To illustrate the reductions, consider the district where I live, Dalton Local. The board-approved calendar for 2025–26 included 176 days of pupil instruction, excluding a few staff PD days. The district cancelled seven days for weather and made up none of them. As a result, students will receive 169 days of instruction this year, provided the year concludes as planned. Given that the district hasn’t implemented a longer school day,[2] students will receive approximately a week to two weeks less instructional time this year than under Ohio’s 180-day requirement.[3]

A more startling example comes from Columbus. Its 2025-26 calendar starts with just 167 days of planned pupil instruction. The district likewise cancelled seven days for weather, resulting in just 160 days this year. The district operates the same daily bell schedule as it did in 2010 under the 180-day requirement. Without an extended school day, the significantly fewer days in session—as many as twenty (!) days less—indicates that Columbus students receive far less instructional time than their peers attending the district before the change to minimum hours.

America—Ohio included—is still very much a “nation at risk.” Student proficiency in math and reading sunk during the pandemic and recovery has been exceedingly slow. Longstanding achievement gaps remain unacceptably wide. As indicated by sky-high chronic absenteeism, too many students are MIA and ruining their chances of long-term success.

An abbreviated school year of 160 to 170 days simply won’t cut it. Lopping days off the calendar robs students of valuable learning time. Generous holiday breaks, disruptive cancellations, and the rise of professional learning days result in stop-and-go instruction that is surely less effective than consistent five-day-per-week instruction. Longer summer vacations only worsen “summer slide.” And a lower minimum opens the door to widespread use of four-day weeks—something a few Ohio schools have moved toward—which are terrible for students and burdensome to working families.

Ohio must restore a baseline expectation that its schools are open for in-person instruction at least 180 days per year, 7 hours per day. Time matters for students—and it’s past time for Ohio lawmakers to get schools back to a standard annual calendar. Clock’s ticking.


[1] Public charter schools must be open for 920 hours per year, though they are not allowed to count certain hours (e.g., recess) toward that minimum as districts may do. Neither district nor charter schools may count breakfast and lunch or extracurriculars toward the minimum.

[2] The bell schedules today are comparable to those described in the district’s 2008–11 teacher contract.

[3] Under prior law, districts were allowed three to five “calamity days” that were not required to be made up. In practice, then, districts would operate 175 to 180 days each year.


Policy Priority:
School Funding
Topics:
Governance
Jeff Murray
4.28.2026
CALDER teacher principal diversity SR image
Getty Images/IUshakovsky
Listen to this article
Loading the Elevenlabs Text to Speech AudioNative Player...

Efforts to broaden the demographics of the U.S. teaching force have yielded change, but more remains to be done to better reflect the diversity of the student body. A group of researchers led by Dan Goldhaber from the American Institutes for Research and the University of Washington suspect that multi-layered hiring processes may introduce heretofore unstudied points of friction. Their recent working paper digs into the question.

The researchers’ main data source is a company called Nimble Hiring, which provides recruitment, candidate screening, job offers, contracting, and onboarding services for dozens of education providers in several U.S. states. These include preschools and private schools, but the present study utilizes only data from public K-12 education providers (18 traditional districts and 24 charter school networks) that contract with Nimble. No geographic data is provided on where these are located, although Nimble’s website only lists five states in which they work.

Goldhaber and team combine these data with publicly-available organizational and demographic characteristics via the Common Core of Data. Their records cover job postings and applications for both teachers and principals from January 2019 through September 2024. They standardize the hiring process into four stages: (1) initial screening by central HR, (2) application made visible to school-level personnel, (3) engagement with school-level personnel (e.g., interviews), and (4) job offer. They then track all applicants through these stages, looking to see how the racial composition of applicants changes as candidates advance (or not) and how those advancement patterns vary across organizations with different characteristics (e.g., student demographics).

The findings start with applicant demographics. Sixty-three percent of teacher applicants were female, and female applicants were hired at significantly higher rates than males. The teacher applicant pool was more racially diverse than the teacher workforce in general, with 35.6 percent identifying as one of several underrepresented groups (specifically, Black, Hispanic, or Native American). However, White applicants were significantly overrepresented among applicants with offers (41 percent of all applicants, but 52 percent of applicants with job offers) and Asian applicants were significantly underrepresented (13.7 percent of all applicants, but only 5.7 percent of those with offers). Black applicants are slightly underrepresented among candidates with offers and Hispanic applicants are slightly overrepresented.

While the demographics of principal applicants were similar to those of teachers—also more diverse than the principal workforce in general—hiring patterns for principal positions were somewhat different. Black applicants maintained roughly proportional representation (34.2 percent of offers versus 33.6 percent of applicants), White applicants were slightly underrepresented among those receiving offers, Asian applicants were significantly overrepresented (only 2.7 of all applicants, but 5.6 percent of offers), and Hispanic applicants were slightly overrepresented.

For the most part, with respect to teacher hiring, the early screening stages appeared to be responsible for the majority of these job offer disparities. Black and other non-White applicants were significantly less likely to advance through each of the first three stages of the hiring process than their White peers. However, once they did so and were engaged at the school level (such as being invited for an interview), White and non-White applicants were equally likely to receive a job offer. Hispanic applicants appeared to be particularly disadvantaged at the second stage of the hiring process (when applications were made visible to school-level personnel), while Asian applicants were significantly less likely than their peers to advance at all four stages. Female applicants were more likely to advance at each of the first three stages than their male peers, but were equally likely to get job offers once engaged by school personnel.

The researchers saw no statistically significant relationship between non-White and White principal applicants and their overall likelihood of receiving a job offer at any stage. However, the analytical sample of jobs is far smaller than for teachers, so these findings need to be taken with a grain of salt. Female principal applicants showed a small but statistically-significant higher likelihood of receiving a job offer than their male peers.

Finally, Goldhaber and his team also found that organizations with higher proportions of underrepresented minority students were more likely to hire Black and Hispanic applicants overall—both teachers and principals. Charter schools particularly were more likely to hire non-White teacher applicants.

The researchers explain that the mechanisms at work are nuanced. Nimble’s recruiting system does not require racial/ethnic demographic information from any applicant, and any such detail voluntarily provided (say, via a personal essay) is not revealed to non-HR personnel until stage three. They conclude, then, that disparities observed in the first stage are likely driven by a mix of candidate preferences or actions (such as withdrawing an application after submission) and what they term “coarse” screening methods used to winnow down a large number of submissions. In the second stage, nearly all decisions—and the disparities that result—are driven by HR screening processes which likely include a mix of electronic and human-centric reviews. “At this point,” they write, “either screening instruments [the schools] use are biased, implicit or overt human bias operates, or job-relevant factors excluded from our analysis but correlated with race differ.”

That’s the bad news. The good news is that the final stages, when candidates interact with non-HR school personnel, show minimal disparities. All of which means that schools looking to diversify their teacher and principal workforce must focus on refining their earliest screening processes to make sure that no particular racial or ethnic group is being disproportionately caught up in the machine.

SOURCE: Dan Goldhaber et al., “School System Selection Processes and Workforce Diversity in Schools,” CALDER Working Paper (February 2026).

Policy Priority:
School Funding
Topics:
Governance
Bruno V. Manno
4.27.2026
Apprenticeship
Getty Images/Amorn Suriyan
Listen to this article
Loading the Elevenlabs Text to Speech AudioNative Player...

For all the talk about preparing students for college and career, American education still struggles with one of its most important jobs: helping young people make a confident first move into adult life. We ask students to make big decisions about college, work, and training, but give them weak maps for what comes next.

High schools are often better at steering top students to a four-year college than helping the broad middle find a clear path into work, further education, and advancement. Apprenticeship stands out because it offers one of the few routes that connect school to work in a direct, structured way.

National Apprenticeship Week, from April 26 to May 2, is a good time to remember that. But this year’s remembrance should put a tough question in front of policymakers. Will the new Workforce Pell program strengthen apprenticeship, or sideline one of the best models we have for linking education to work?

The U.S. Department of Education’s proposed rules say Workforce Pell would begin on July 1 and allow eligible students to use Pell Grants for qualifying short-term workforce programs, some as short as eight weeks.

That question matters not only for workforce policy, but for K–12 education. American schools talk constantly about college and career readiness. But too often that phrase ends at graduation. Too many young people leave high school with a diploma but without a clear next step, a visible route into a career, or much confidence that the system has prepared them for what comes next.

A stronger K–12 system would treat career development as a progression, not a one-time event. It would begin with career awareness, deepen into exploration, and culminate in real experience before graduation.

Colorado offers a useful framework that moves from learning about work to learning through work to learning at work, and it ties that continuum to a longer process of preparation for adult life.

That’s the missing link in much of the national conversation. Career readiness often means a slogan, a checklist, or a single elective.

A better model spans the full spectrum: classroom exposure to occupations and industries, advising that helps students understand the difference between jobs and careers, job shadows and internships, dual enrollment, pre-apprenticeship, youth apprenticeship, and then, for some students, full apprenticeship or other work-connected postsecondary pathways.

Colorado’s work-based learning guidance makes the same point in practical terms. Students should move developmentally from exposure to experience, not be asked to leap from vague awareness into adult decisions.

That’s why apprenticeships should matter to K–12 reformers. They’re not just a workforce program for adults. They’re one of the clearest answers we have to a question high schools have struggled with for years.

What does a credible transition from adolescence to adulthood actually look like for students who are not headed straight into a bachelor’s degree program, or who want another route that combines learning, work, and advancement?

Apprenticeship makes “career readiness” real. It attaches learning to wages, skill-building, mentorship, and a recognized credential.

This is also why Workforce Pell matters. Starting in July 2026, individuals will be able to use Pell Grants for eligible short-term workforce programs. That matters because it could help make apprenticeship a more visible and viable next step after high school. Apprenticeships are a strong fit for Workforce Pell. They are tied to employer demand, lead to portable or stackable credentials, and can connect directly to postsecondary credit and further learning.

Of course, some implementation details still need work. Workforce Pell was not designed exclusively around apprenticeships, and some rules fit awkwardly. But those technical questions should not obscure the larger point.

If policymakers want short-term aid to support programs with clear labor-market value, apprenticeships should be near the top of the list. They are employer-connected by design, produce visible outcomes, and can serve as the next step in a broader pathway that begins in K–12 with career awareness, exploration, and hands-on experience.

That’s also why results and incentives matter. Pell can help learners afford instruction, but it cannot, by itself, create more apprenticeship opportunities. Growth also requires stronger employer participation, sponsor capacity, and incentives to expand high-quality programs.

The U.S. Department of Labor announced a Pay-for-Performance Incentive Payments Program with about $145 million for the performance-based expansion of registered apprenticeship. The funding notice says the program is meant to stimulate innovation and reduce barriers that keep sponsors from developing or scaling programs. If policymakers want more apprenticeships, they have to reward measurable progress, not just promise-making.

So what should policymakers do?

First, K–12 leaders should treat apprenticeship as part of the school-to-adulthood pathway, not as something that begins after education is over. If Workforce Pell is meant to support strong first steps after high school, apprenticeships should be one of the clearest pathways students hear about before they graduate.

Second, states and districts should build career preparation as a progression from awareness to exploration to real work-based experience. Students need more than a one-time career day or a vague readiness slogan. They need a sequence that starts with learning about occupations, moves into advising and exploration, and leads to internships, dual enrollment, pre-apprenticeship, youth apprenticeship, or other hands-on experiences before graduation. 

Third, states should use Workforce Pell to connect high school pathways more tightly to postsecondary opportunities. Governors, state education agencies, higher education systems, and workforce boards should make sure that students can move more easily from high-school-based career preparation into apprenticeship-related postsecondary learning. The goal is a clearer bridge from secondary school into work and further education, not separate systems that barely talk to one another.

Fourth, accountability should reflect the outcomes K–12 reformers say they want for graduates. If young people move from high school into paid work, complete related instruction, gain recognized skills, and stay employed or move ahead, public policy should recognize that as a successful transition into adulthood.

Fifth, Workforce Pell should be paired with incentives that help schools, colleges, employers, and intermediaries create more high-quality opportunities for young people. If Washington wants more apprenticeships, it has to support the institutions that make apprenticeship possible, not just the students who enroll.

National Apprenticeship Week should not just celebrate a worthy model. It should remind K–12 and postsecondary policymakers alike that the transition from high school to adulthood is one of the weakest parts of our education system. Apprenticeship is not the only answer to that problem. But it is one of the best answers we have. And if Workforce Pell is going to strengthen opportunity, it should strengthen apprenticeships too.

Policy Priority:
Quality Choices
Topics:
Career & Technical Education
Governance
Jessica Poiner
4.27.2026
Attendance dashboard overview blog image
Getty Images/peshkov
Listen to this article
Loading the Elevenlabs Text to Speech AudioNative Player...

In his state of the state address on March 10, Governor DeWine shined a spotlight on chronic absenteeism. He noted that students with good attendance are “three times more likely to be proficient readers, nearly four times more likely to be proficient at math, [and] almost twelve times more likely to graduate on time.” It’s worrisome, then, that one out of every four Ohio students was chronically absent last year.[1]

Traditionally, Ohio only publishes attendance data once a year, when it releases state report cards in September. When those data are released, chronic absenteeism rates make headlines. But then the numbers get stale. They’re viewed as last year’s issue, not a current one. And that makes it easy for local officials, district and school leaders, and families to let their guard down and overlook the importance of daily attendance.

Access to real-time data could help. That’s why DeWine announced in his address that the Department of Education and Workforce (DEW) would be launching a new statewide attendance dashboard. The tool, he said, would provide administrators, educators, parents, and the public with “simple, fast, and transparent attendance data each week.” This information could then be used to take “actionable steps to improve attendance.”

The dashboard went live on April 15. As promised, it allows the public to track statewide attendance trends and chronic absenteeism rates by district, school building, and grade level. It offers a chart that displays absence trends over time via a line graph, as well as a table that displays results for the most recent week. Data can be disaggregated into four categories of students: Satisfactory (those missing less than 5 percent of class time); At risk (missing 5–10 percent); Moderate (10–20 percent); and Severe (more than 20 percent). Users can also compare results across districts. A leaderboard identifies top-performing districts and those trending in the right direction.

Right now, schools must choose to participate. Unfortunately, some are refusing. During the launch announcement, DEW Director Steve Dackin said that roughly 24 percent of districts hadn’t yet uploaded their data to the dashboard. Among them are two of Ohio’s largest: Columbus City Schools and Cleveland Municipal. They also happen to be districts where significant numbers of students—52.6 and 55.7 percent, respectively—were chronically absent last year.

Dackin noted that many districts haven’t uploaded their data because of technical difficulties. DEW is working with them to resolve those issues. But DeWine added that there are “a few schools who don’t seem to have a technical problem. They just have not gotten on.” Jocelyn Rhynard, a board member from Dayton Public Schools (DPS), told the Dayton Daily News that her district is “considering” participating. But she also “expressed trepidation with a system that she said leaves out a great deal of information about why some districts might have higher absenteeism rates than others, like a higher proportion of homeless youth or students in group homes.”

This is disappointing to hear from a district official for two reasons.

First, because it prioritizes adults over kids. Instead of viewing the dashboard as an opportunity to be transparent with the families who trust DPS with their kids, and the taxpayers who trust DPS with their hard-earned dollars, district officials are choosing to conceal data. It seems they’d rather avoid difficult questions than acknowledge a problem and provide evidence of their efforts to address it. They appear more interested in how the dashboard might make them look than what the numbers mean for kids’ futures. Remember, the dashboard is information-only. It has no ties to the state accountability system. Districts and schools that refuse to participate aren’t sidestepping state-leveled sanctions. They’re just shielding their attendance numbers from public view.

Second, because it’s a huge missed opportunity. The dashboard provides real-time data that district and school officials can use to identify issues as they occur and address them before they snowball into a bigger problem. Does a nearby district or charter school have better attendance numbers among its at-risk youth? Then schedule a visit, identify what’s working, and implement it. The dashboard makes it possible to learn from other schools. And since it’s updated weekly, district officials will have immediate feedback about whether their efforts are working. Moreover, as was the case in Rhode Island, real-time data can help mobilize not only educators and families but also lawmakers, hospitals, businesses, and other stakeholders who can offer additional support.

The hundreds of schools that have already submitted data deserve credit for putting students and transparency first. But if some districts continue to prioritize adult interests over those of kids, lawmakers should consider making the dashboard mandatory. Years of taskforce recommendations, attendance guides, and pledges have yet to move the needle. Real-time data could help—but only if everyone gets on board.


[1] Chronic absenteeism is defined as missing at least 10 percent of instructional time for any reason.

Policy Priority:
Standards & Accountability
Topics:
Governance
Jeff Murray
4.24.2026
Ohio charter news logo
Listen to this article
Loading the Elevenlabs Text to Speech AudioNative Player...

Stories featured in Ohio Charter News Weekly may require a paid subscription to read in full.

Arts weekend

Toledo School of the Arts is hosting a Teen Book Festival this weekend, which coincides with a community-wide arts weekend and includes a self-guided tour of the numerous murals in the Uptown neighborhood (which is anchored by TSA). Should be a great one!

Award winner

Kudos to Ohio Connections Academy superintendent Marie Hanna, who was honored with a Lifetime Achievement Award from the Ohio Council of Community Schools earlier this month. She is currently serving her 22nd year with the OCA, one of the state’s largest online charter schools, and that’s just the latest portion of her distinguished career in education.

Illustrious visitor

Here’s some new coverage of a recent visit by U.S. Senator Bernie Moreno to Northeast Ohio Classical Academy. Sen. Moreno observed some excellent examples of NEOCA’s education model including student recitations of the preamble to the Constitution and the poem “George Washington” by Rosemary and Stephen Vincent Benet.

Rhode Island legislation

A bill in the Rhode Island General Assembly proposes a moratorium on new or expanded charter schools in the state through 2029. Meanwhile a recent poll conducted by the Rhode Island League of Public Charter Schools indicates school choice is popular in Rhode Island, with 88 percent of respondents agreeing that families should have the option to choose among types of schools, and 78 percent saying they support giving children more access to charters. Hopefully, that’s why the moratorium bill has had no formal hearings as yet and is currently on hold “for further study”.  

The news from Washington State

Washington State’s 2026 supplemental budget recently cut charter schools’ enrichment funding by $7.5 million. The money had been used to pay for counselors, nurses, and special education supports, among other things. The state’s Charter School Commission says schools will likely need to dip into their general operations funds if they want to keep providing these services to their students.

From hope to reality

The establishment of five Success Academy campuses was overwhelmingly approved by a vote of the Miami-Dade County school board this week. All will be co-located in underutilized district buildings thanks to Florida’s Schools of Hope program. Success Academy will pay the district $700 per student to cover shared costs like custodial services and cafeteria use, a requirement for all co-located charters in the revised Schools of Hope framework. All five are scheduled to begin operation in fall 2027. In a statement, Success Academy CEO Eva Moskowitz said, “We are honored to partner with Miami-Dade to ensure that every child — especially those from economically disadvantaged backgrounds — has access to an exceptional public education.”

*****

Did you know you can have every edition of the Ohio Charter News Weekly sent directly to your Inbox? Subscribe by clicking here.

Policy Priority:
School Choice
Topics:
Charter Schools
Jeff Murray
4.24.2026
Gadfly Bites logo
Listen to this article
Loading the Elevenlabs Text to Speech AudioNative Player...

News stories featured in Gadfly Bites may require a paid subscription to read in full. You have been warned.

  1. As was noted prominently in last Friday’s Bites, not every school district in Ohio is submitting its chronic student absenteeism data to the state’s new live dashboard. Columbus City Schools is one of those yet to opt in, but the Dispatch is able to bring us their data anyway (based on a recent public presentation before the elected school board), along with the laudable trends. Columbus is currently on track for a 49.6 percent chronic absenteeism rate this year. Despite that very large number, this is their best showing since pre-pandemic times, down from 52.6 percent in 2024-2025. Like everyone else, their peak was in 2020-2021 (75.6 percent), but all of this is still well above their 2019-2020 rate of 33 percent. District supe says, “This is a celebration that we’ve made significant progress,” but the numbers are “still a concern.” I’d say so, yes. (Columbus Dispatch, 4/23/26)

  2. This national piece on the topic of dwindling student attention spans is datelined from Toledo, Ohio, and includes numerous examples from a district elementary school. (Think jumping jacks, walking in circles, wiggly chairs, affirmations, deep breathing, etc.) The bottom line, per a teacher from Arizona: “Teachers are going to have to be more engaging for students.” (Washington Post, 4/24/26)

  3. Let’s end the week with some good news. First up, Ohio Connections Academy superintendent Marie Hanna was honored with a Lifetime Achievement Award from the Ohio Council of Community Schools earlier this month. She is currently serving her 22nd year with the OCA, the state’s largest online charter school. Kudos to her for her amazing work! (Warren County Post, 4/22/26) Next is wishing a very happy birthday to Western Reserve Academy in Hudson, Ohio! The state’s oldest high school—a secular, private, college-prep boarding and day school—is celebrating its 200th anniversary this year. Sounds incredible! (WKYC-TV, Cleveland, 4/23/26)

Did you know you can have every edition of Gadfly Bites sent directly to your Inbox? Subscribe by clicking here.

Policy Priority:
School Funding
Topics:
Governance
The Education Gadfly
4.24.2026
Gadfly Guy
Listen to this article
Loading the Elevenlabs Text to Speech AudioNative Player...

WHAT WE’RE READING

“Birthrates are down. Families are leaving New York City. So educators, especially at charter schools, are expanding their marketing efforts on social media and in subway stations.” —Troy Closson, Matthew Haag, and Jeff Adelson, The New York Times

—

Molly Worthen, professor of history at UNC-Chapel Hill, wades into the conversation on ed tech in classrooms, calling the decision to give all children devices and gamify learning “the greatest blunder in the past decade of K–12 education,” and arguing that schools can’t fix the problem without a clear vision of what education is for. —The New York Times

—

Interest in the skilled trades is growing fast, and some programs go beyond job training, aiming to give young people—especially men—a sense of purpose in addition to employment possibilities. In The New Yorker, Emma Green shares a fantastic look into Steubenville, Ohio’s College of St. Joseph the Worker, where a promising new model for post-high school education is changing young lives and trying to build hope in a city fallen on tough times.

It’s good to highlight programs like the one in Steubenville, and to look beyond well-intentioned efforts to push all kids toward traditional colleges. Still, the “learn to code” era reminds us that we are generally terrible at picking the jobs of the future, and many careers in skilled trades require backbreaking work for mediocre pay—covered by River Page this week in The Free Press. Acceptance into the best training programs, particularly those covered by future employers through apprenticeship models, is highly selective, and affordable programs like high school vocational pathways and public community colleges struggle to keep up with demand for spots. And as Te-Ping Chen and Lauren Weber show in The Wall Street Journal this week, choosing a career in the trades can still lead to debt with no credential to show for it.


Editor's note: This was first published on Mike Petrilli's Substack, SCHOOLED, a twice-weekly free Substack and email newsletter restarting the education-reform conversation.

Click here to subscribe for:

  • Sharp analysis of the week’s biggest K–12 debates

  • Curated commentary from across the ed-policy world

  • Lively discussion—including reader reactions and pushback

The Education Gadfly
4.24.2026
Gadfly Guy
Listen to this article
Loading the Elevenlabs Text to Speech AudioNative Player...

CHEERS

“The work is sometimes difficult and often takes years to unfold, especially in order to have a sizeable impact on the roughly 5.5 million public school students around the state,” Mike Morath tells Keri Heath. She traces the path that led the Texas Education Agency commissioner to his current role, in which he’s now served for a decade, portraying a leader on a moral mission, fully committed to accountability. —The Houston Chronicle

—

Jonah Goldberg makes a strong case for keeping AI out of American classrooms. “Just as you can’t learn how to ride a bike from reading a book, you can’t get the benefits of reading by asking AI to read a book for you. The same holds for math, science, computer programming and nearly every other aspect of education.” —AEI

JEERS

The Associated Administrators of Los Angeles/Teamsters Local 2010 secured big benefits for LAUSD school principals after recent strike threats. Jed Wallace discussesthe unheard-of concession allowing principals to “reclaim hours” beyond a 40-hour work week without supervisory approval, launching “a new race to the bottom.” As Gustavo Arellano reports in the Los Angeles Times, the union’s leader admits that the new contracts require money that doesn’t exist—not a great look alongside job cuts and declining enrollment, but these are “issues for another day.” Talk about kicking the can down the road and putting the needs of students last.

—

“More than a third of the federal government’s education research budget—an estimated $289 million—could go unspent this year,” writes Jill Barshay. Particularly troubling: “85 percent of the $77 million designated for special education remains unspent and there are no federal notices or documents, as there usually would be, detailing plans to launch grant competitions and spend it.” —The Hechinger Report


Editor's note: This was first published on Mike Petrilli's Substack, SCHOOLED, a twice-weekly free Substack and email newsletter restarting the education-reform conversation.

Click here to subscribe for:

  • Sharp analysis of the week’s biggest K–12 debates

  • Curated commentary from across the ed-policy world

  • Lively discussion—including reader reactions and pushback

Meredith Coffey, Ph.D.
4.23.2026
Tablets
Getty Images/aquatarkus
Listen to this article
Loading the Elevenlabs Text to Speech AudioNative Player...

With school phone bans now underway in 41 states and counting, debates on classroom screen time have shifted focus to the devices ostensibly being used for educational purposes: Chromebooks, iPads, and the like. In response to all the tech backlash, state policymakers are taking swift action, some of which is warranted, but much of which bears signs of legislative haste.

While a recent West Virginia bill banning all K–3 “electronic devices” except for calculators didn’t make it out of committee, still moving forward are bans on K–5 “digital devices” in Kansas, South Carolina, and Tennessee. Their exceptions are limited to accommodations under IDEA (all three states), virtual schools (South Carolina and Tennessee), and state assessments (Tennessee only). Also for K–5, Missouri may soon mandate a maximum of 45 daily device minutes and Oklahoma one hour, both with exceptions only for IDEA. Kansas proposes time limits throughout the upper grades, too, with a 60-minute cap in middle school and a 90-minute cap in high school.

I’m no fan of unfettered screen time, but we should take these bills as a signal that the ed tech pendulum may be swinging back too far, too fast.

First, it’s unclear whether policymakers in these states have considered a swath of classroom realities. Many schools lack hard-copy versions of curricula and other materials. For example, evidence-based K–5 Amplify curricula—used in over 8,000 U.S. school districts for English language arts, math, and/or science—either encourage or require digital components. Where both print and digital versions of any curriculum are available, it’s typically cheaper to purchase digital versions. So will districts and schools be able to afford hard-copy versions? Will they be able to obtain materials soon enough to comply with the rapidly approaching effective dates (e.g., July 1, 2026, in Oklahoma and Tennessee)? Will they be able to adequately support teachers modifying their instructional methods so dramatically? Will states and districts have capacity to pivot to pen-and-paper screeners and assessments, and if they can’t, how will they equip students when they do encounter such digital tasks? (Or, as some reformers fear, will device bans become a means for undermining state testing?)

What’s more, arbitrarily limiting the quantity of screen time does absolutely nothing for the quality of the screen time. A nine-year-old playing Roblox at school is a problem, whether for 55 minutes or 65. On the other hand, a nine-year-old learning coding, online safety, and early research skills shouldn’t necessarily be subject to inflexible time limits.

It’s unclear how exactly states would plan to monitor or enforce these restrictions, anyway. Missouri’s bill includes school-level reporting requirements around student device-use minutes and digital and print products used. That’s pretty minimal, yet it’s the only such bill I’ve seen that offers anything akin to an accountability mechanism.

At first glance, new opt-out proposals from Iowa, Rhode Island, and Vermont might seem more measured, as they would merely permit caregivers to opt their children out of school device usage. As some Vermonters have noted, however, such a policy would almost assuredly lead to classrooms divided between device and non-device users. Would teachers really be able to support both groups simultaneously and effectively? Would districts and schools be able to obtain appropriate materials to support both groups? What are the implications for materials and instruction if parents opt in or out mid-year?

The situation isn’t hopeless; there are also some promising plans out there. Though I’m wary of Iowa’s and Rhode Island’s opt-out permissions, their legislation—along with Utah’s newly-passed law—reflect valuable steps toward improving the quality of school screen time, not simply restricting the quantity. Among the highlights from these three states are provisions on:

  • Computer science: Iowa and Utah both specify that computer science doesn’t count toward their device minute limits. Even better, Utah’s state board must adopt computer science standards, including AI standards. Such stipulations aim to ensure that limits on device time don’t come at the expense of essential digital literacy instruction from an early age.

  • Safety of devices: All three states have suggested more stringent requirements for the devices students are using, including guidelines around student privacy. Capping student device use at a certain number of minutes doesn’t keep students safe; ensuring personal data security, disabling cameras, and blocking social media will help.

  • Value of ed tech tools: Rhode Island and Utah both establish criteria for ed tech tools, such as alignment with curricula and evidence of effectiveness. And, in perhaps the first state policy of its kind, Rhode Island would require all ed tech tool providers to register with the state’s attorney general, much like other consumer service providers in many states. This move would help pave the way toward greater transparency and accountability.

Too much low-quality school screen time is a real problem for students’ academic growth, social development, and digital safety. But coarse limits and outright bans on devices risk too many unintended consequences. They may be at odds with required curricula. Mandates that emphasize quantity over quality don’t make screen time any more purposeful or safer. And all students deserve digital skills instruction from the early grades; not providing any will translate into students with fewer resources outside of school facing yet another disadvantage compared to peers.

Education advocates are right to call out excessive screen time at school, but state leaders should take a beat before forging ahead with one-size-fits-all policies. States could, for example, wait to see results from the districts implementing screen time restrictions, like those that LAUSD’s board passed just this week. The steps states take will shape millions of children’s early exposure to technology. Legislation should be informed, practical, and optimally designed to support all students—not rushed.

Policy Priority:
High Expectations
Topics:
Curriculum & Instruction
Governance
Teachers & School Leaders
Dale Chu
4.23.2026
Classroom
Getty Images/Drazen Zigic
Listen to this article
Loading the Elevenlabs Text to Speech AudioNative Player...

Fifteen years have passed since Indiana took home the Fordham Institute’s “Education Reform Idol” crown, a recognition earned through a sweeping set of reforms that included an overhaul of teacher evaluation, an expansion of school choice, and major changes to collective bargaining. It feels like a lifetime ago, back when bipartisan education reform still had real momentum. That era came back into sharp relief for me while reading a recent Johns Hopkins University interview with my former boss and longtime friend Tony Bennett, who led education in Indiana and later Florida. Conducted by Jonathan Plucker, their conversation finds Bennett candid and clear-eyed about both the successes and shortcomings of that period. What stands out most, looking back, isn’t just how much reform happened, but how it happened—and how different that approach looks from the way reform is pursued today.

It wasn’t just a different political moment. It was a different theory of change. Education reform today is often myopic in comparison, in the sense that it organizes improvement around discrete levers that are expected to produce results largely on their own. A new reading law becomes shorthand for reading improvement. Private school choice stands in for systemwide change. Math instruction is treated as the primary pathway to stronger outcomes. What gets lost is the degree to which these levers depend on broader conditions (e.g., standards, capacity, accountability, execution) for their effects to materialize. This is not a universal pattern, and there are important exceptions (more on that below), but it reflects a gradual shift from comprehensive reform to piecemeal initiatives.

In the early 2010s, Indiana’s pursuit of education reform was not organized around any single policy. As Bennett describes it, the approach was explicitly coordinated across several fronts:

Our strategy was to pass all [of our reform] bills at once. This would force our opponents to oppose all of them so we could paint them as being for nothing and against everything. I worked with both House and Senate Caucuses and agreed to attend their town hall meetings, which were being flooded by angry teachers, to answer questions and take the wrath. This, along with the bully pulpit of Governor Daniels, gave them the cover they needed to pass [everything].

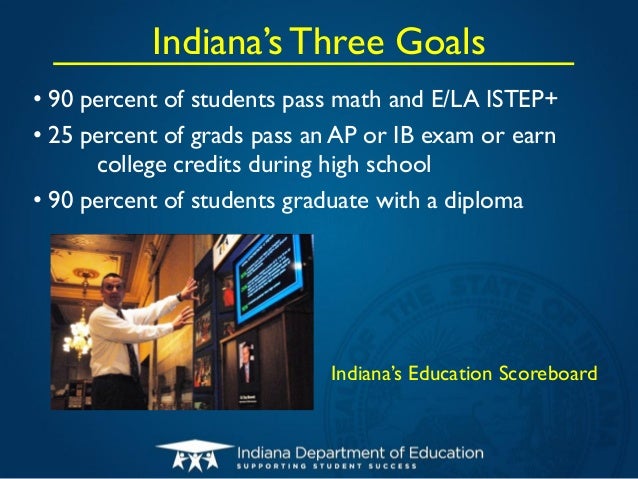
That effort was anchored by Bennett’s “90-25-90” goals: 90 percent of students passing the state test, 25 percent earning advanced credit or credentials, and 90 percent graduating from high school ready for college or career without remediation. Together, they defined what success meant in concrete terms and made the desired outcomes clear to one and all. No state had achieved them, and that ambition became an organizing force for everything that followed.

With these reforms codified into law and 90-25-90 as the North Star, the work shifted quickly from aspiration to implementation. It was propelled by a close relationship between Bennett and Governor Mitch Daniels, with the governor’s clout helping to recruit top talent to Indianapolis. An underlying sense of urgency, rooted in an understanding that there was a limited window to put the pieces into place, kept momentum from dissipating. Indiana’s agenda was a comprehensive one in which policy, people, and political will reinforced one another. The resulting academic gains were not the product of any single policy shift, but of a deliberate push across multiple areas—an approach that, over time, would prove difficult to sustain.

Important counterexamples remain today. Mississippi’s recent literacy gains, for instance, are often attributed to the science of reading, but closer analyses reveal a larger, coordinated effort spanning high expectations, curriculum guidance, teacher preparation, accountability, and sustained implementation support. And in Texas, the state’s data-driven education commissioner has treated accountability as a tool for driving managerial decisions that produce results. What distinguishes effective reform is whether those signals are paired with a system that turns them into action, along with leadership commitment and follow-through.

Bennett’s reflections are clarifying. One of the most widely cited concepts from that period is what he describes as “tight–loose–tight”: tight on goals, loose on means, tight again on accountability. It is a deceptively simple framework that depends on discipline at every stage. Over time, however, that balance has been replaced by something closer to “loose–tight–loose”: loose agreement on goals, tight constraints on implementation, and laissez-faire oversight on top—though in areas like curriculum, states like Mississippi and Texas have moved in the opposite direction, toward greater specificity and guidance. But an even deeper concern lies in how systems behave in practice. As Bennett notes:

[There were so many] times…when we asked districts, schools, and leaders to provide us specific and clear “red tape” that we could remove to make their jobs easier. We literally asked that question every year, and without fail, we not only got no real answers, but we also received reasons we should not remove that red tape.

Even when given the opportunity to reduce unnecessary constraints, practitioners chose to defend them rather than eliminate them.

This gets at the core tension in efforts to “return education to the states,” which assume that shifting authority downward will automatically improve outcomes. But systems shaped by decades of externally imposed rules, procedures, and oversight do not become more effective simply because that oversight is removed. Many reform efforts underdeliver because they rely on discrete levers rather than a comprehensive approach and assume that devolution alone will solve for execution.

Indiana’s reform idol victory feels today like an artifact of a bygone era, one that is unlikely to return anytime soon. Even so, one of the more counterintuitive reflections from Bennett is that the surface conditions for reform may be more favorable today than they were 15 years ago, particularly in red states. Choice enjoys broader public support, literacy policy is on stronger footing, and the level of personal vitriol directed at state chiefs appears to have diminished. Yet that improvement in climate has not translated into stronger academic performance. The explanation lies less in the atmospherics than in how reform is put together. Among the lessons from Bennett’s tenure, the most important for reformers today is that lasting improvement depends less on individual reforms than on whether they are part of a coherent whole. The challenge, as Bennett’s experience suggests, is sustaining that coherence over time.

Policy Priority:
High Expectations
Topics:
Governance

Pagination

  • First page « First
  • Previous page ‹ Previous
  • Page 40
  • Page 41
  • Page 42
  • Page 43
  • Current page 44
  • Page 45
  • Page 46
  • Page 47
  • Page 48
  • Next page Next ›
  • Last page Last »
Fordham Logo

© 2026 The Thomas B. Fordham Institute
Privacy Policy
Usage Agreement

National

P.O. Box 110
Burke, VA 22009

202.223.5452

[email protected]

Ohio

P.O. Box 82291
Columbus, OH 43202

614.223.1580

[email protected]

Sponsorship

130 West Second Street, Suite 410
Dayton, Ohio 45402

937.227.3368

[email protected]