Over the past few years, Ohio has launched important new policy initiatives aimed at improving reading proficiency. Based on decades of research about how children best learn to read, Governor DeWine and the General Assembly enacted a new requirement in 2023 that schools follow the Science of Reading.
The report below provides insight into how Ohio teachers view the shift to the Science of Reading. Conducted by researchers at Johns Hopkins University, the survey finds promising signs that most teachers are supportive of these changes, while also uncovering areas that need continuing attention from state and local leaders.
Foreword
Aaron Churchill and Chad L. Aldis
In January, federal officials released fourth and eighth grade math and reading scores from the 2024 National Assessment of Educational Progress. Results nationally and in Ohio were abysmal, especially in reading, where scores slid yet again after the pandemic-impacted plunge in 2022. Yet a few states—most notably Louisiana and Mississippi—have bucked these trends and shown improvements in reading. It’s likely no coincidence that both states have been at the forefront of ambitious literacy reforms centered around high-quality curricula and the Science of Reading.
Ohio has only recently begun its turn to the Science of Reading (SoR), an evidence-based approach that emphasizes phonics and knowledge-building curricula. Under the leadership of Governor Mike DeWine, lawmakers enacted provisions in 2023 that require schools to implement the Science of Reading starting sometime this school year (2024–25). To support the effort, Ohio has dedicated $168 million to help cover new curricula purchases, to fund teacher stipends for professional development, and to support literacy coaches.
The new policy represents a big shift for Ohio schools. But how are classroom teachers—the ones being called upon to change their practices—feeling about this whirlwind of change? Do they generally view the shift to the Science of Reading as a positive development, or is there widespread skepticism? Are they starting to use high-quality curriculum, or are they turning to other materials when they close their classroom doors? How often do they report using scientifically-based instructional strategies versus non-aligned practices?
To learn more about teachers’ views, we partnered with Johns Hopkins University’s Institute for Education Policy to survey grade K–3 reading teachers working in a representative sample of schools statewide. A total of 402 teachers took time out of their busy schedules to participate in the survey during fall 2024.
From this survey, we see a mix of promising news and signs of work ahead.
On the upside, teachers report significant changes occurring in literacy instruction—and most view these shifts positively. For instance, 81 percent of teachers say they’ve “noticed changes” in their schools’ literacy instruction over the past year. Most teachers (57 percent) report that their school is in the first or second year of implementing a state-approved core reading program. When asked how they view these transitions, 68 percent of teachers respond positively, while just 7 percent say they’ve been negative (the rest are neutral).
Also encouragingly, teachers report regular use of scientifically-based instructional strategies, such as practicing letter-sound recognition, developing academic vocabulary, and blending and segmenting words. When asked whether they favor phonics or three-cueing (a non-aligned method), a strong majority express support for phonics by a 72 to 16 percent margin.
Now to several concerning findings.
- We find a small but significant minority of teachers still using non-aligned curriculum and practices. For instance, 30 percent of teachers report regularly using a non-approved core curriculum, and teachers acknowledge continuing use of discredited practices even as they also report using phonics-driven approaches.
- A majority of teachers (63 percent) say that they turn to supplemental programs—materials outside the “core” curriculum—to help teach foundational skills (e.g., phonemic awareness). While some teachers report using high-quality supplements, non-aligned materials are more prevalent.
- Teachers indicate that their core reading curriculum and professional development are weakest in helping to support struggling readers, including English learners and students with disabilities.
Overall, we agree with the report’s conclusion: “Teachers’ responses to the survey suggest a partial but incomplete implementation of SoR-aligned curricula.” How can Ohio continue to press for full implementation? Here, the authors offer four recommendations, which we endorse and summarize in brief form. They include:
- Require non-compliant schools to immediately change course;
- Ensure teacher evaluations consider instructional fidelity to the Science of Reading;
- Promote use of high-quality core curricula, and discourage supplemental materials; and
- Focus teacher PD efforts on strategies that support struggling readers and align with the Science of Reading.
We wish to add two suggestions—which should be enacted this year through the state budget. First, lawmakers should require the Ohio Department of Education and Workforce to disclose the core curriculum and any supplemental programs used by schools on their annual report cards. This information is currently unavailable, but parents and the public should know which materials their local district and school are using and whether they are state-approved. Second, lawmakers should continue support of the state’s literacy coaching program. This initiative currently deploys eighty-four trained coaches who provide hands-on support for teachers serving in more than 100 low-performing schools. In his recent budget request, Governor DeWine set-aside $12 million per year to sustain the program, and lawmakers should approve these funds. Coaches like these were essential to the Mississippi Miracle, and can help Ohio make rapid progress, too.
Ohio’s Science of Reading initiative is off and running, with significant improvements happening in schools and classrooms across the state. Success like that demonstrated by Louisiana and Mississippi will take continuing commitment from state and local education leaders to make sure these instructional reforms take root in every classroom. Rigorous implementation promises higher reading proficiency for Ohio students, and a brighter future for the state. Let’s keep the pedal to floor on the Science of Reading.
Executive Summary
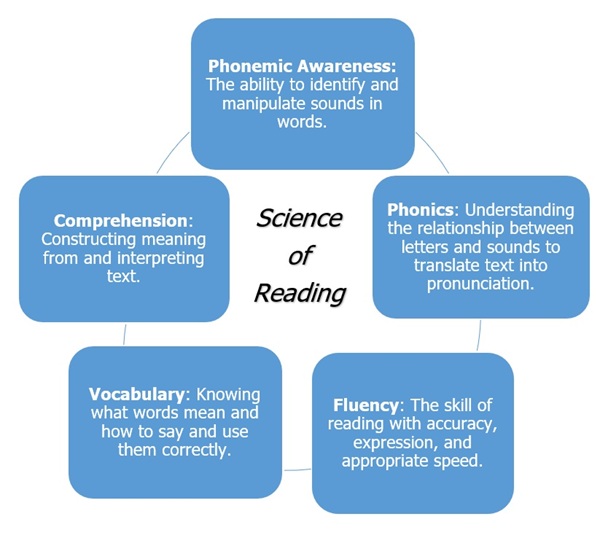
The science of reading (SoR) encapsulates a body of interdisciplinary research developed over decades. It represents the preponderance of evidence about reading development, reading, and best practices of reading instruction. SoR is not a single approach but rather a large and diverse collection of evidence that should be used to inform curriculum and instruction for all students. Properly understood, SoR centers around five main components: phonological awareness, phonics, fluency, vocabulary, and comprehension (Castles et al., 2018; Shanahan, 2020).
Ohio has made significant efforts to improve early literacy over the past several years. Governor DeWine’s literacy agenda focuses on SoR (Poiner, 2023), and in 2023, the state legislature passed a bill requiring all teachers to complete training in SoR by June 2025. In addition, the state requires public schools to adopt state-approved curriculum and instructional materials aligned with SoR during the 2024-25 school year and to move away from other methods of teaching reading that lack evidence of success.
To understand the progress made towards these goals, the Johns Hopkins Institute of Education Policy, in partnership with the Ohio Department of Education and Workforce (“ODEW”), the Thomas B. Fordham Institute, and Ohio Excels administered a representative state-wide survey to Ohio’s K-3 public school teachers. The survey asked teachers about their use and perceptions of curricula aligned to SoR, effective instructional practices, and professional development. This report highlights findings from the survey and provides the following principal findings:
- Survey responses suggest that approximately two-thirds of teachers’ students were reading below grade level, highlighting the critical need for strong reading instruction.
- Teachers have received extensive professional development over the past year. Specifically, teachers received an average of 26 hours of ELA professional development, and 86% of respondents had participated in training on SoR. Teachers reported favorable impressions of the professional development in general, although they found it least helpful for identifying struggling readers and then providing tools and resources to support them. This insight is particularly important given the finding that teachers consider two-thirds of their students to be reading below grade level.
- Most teachers stated that they were comfortable with - and regularly used - phonics and SoR-aligned instructional strategies. However, roughly 16% of teachers still favored instructional practices not aligned with SoR, and another 11% had no preference. This suggests that more than a quarter of teachers need additional support to understand that SoR strategies embody the most effective means of supporting students’ literacy development.
- Survey responses suggest that 70% of teachers use state-approved core reading materials aligned with SoR for their English-language Arts (ELA) instruction. Core reading curricula are teachers’ primary instructional resource and typically include all elements of SoR, including phonological awareness, phonics, fluency, vocabulary, and comprehension. They also include instruction in writing, speaking, and listening. However, 30% of teachers still use materials not approved by the state or teacher-developed materials for their core ELA instruction. These materials may not be SoR-aligned.
- While almost all state-approved core materials do include lessons that teach two key foundational reading skills – namely phonemic awareness and phonics lessons – only 47% of teachers primarily use their state-approved materials to teach these foundational reading skills. Thus, almost two-thirds of Ohio’s teachers – 63% - are using non-approved materials to teach these crucial reading skills. In short, the data shows that while many districts have transitioned to state-approved core curricula, their teachers continue to use their old, unapproved foundational skills materials even though almost all core materials include SoR-based foundational skills lessons.
Based on these findings, we recommend the following:
Recommendation 1: Survey results suggest that most, but not all, districts have adopted state-approved core curricula. Once the state has identified districts that have not adopted such curricula, it should require those districts to do so (for example, by incorporating this requirement into state grant applications, providing PL support only for state-recommended curricula, and sharing curriculum-specific rubrics).
Recommendation 2: Encourage individual teachers’ use of district-selected materials by aligning teacher observation rubrics to their district’s curricula. ODEW could support this by providing exemplar observation rubrics or, where they already exist, press for the use of curriculum-specific rubrics. The state should focus professional learning support on curriculum-specific pedagogy.
Recommendation 3: Ensure that all state-supported PL and any webinars or other public advocacy promote the use of foundational skills materials in the core curricula and discourage the use of supplemental materials. Using a single, high-quality curriculum helps ensure alignment and coherence in literacy instruction. We recommend only allowing districts to select supplemental foundational skills materials if their core curricula do not include them (such as in the case of Wit & Wisdom).
Recommendation 4: Focus professional development on training teachers to identify struggling learners, tailor instruction to their needs, and monitor progress effectively.
Background
The science of reading (SoR) integrates research across diverse fields to create a comprehensive understanding of how children develop reading and writing skills from early childhood through adolescence (Petscher et al., 2020). For early readers, SoR emphasizes the critical role of explicit phonological awareness and phonics instruction in teaching children how to read. In addition, this research underscores the significance of reading comprehension, including vocabulary, reading fluency, and the content knowledge essential for proficient readers (Castles et al., 2018; Shanahan, 2020). The five primary elements of SoR and their definitions are shown below (National Reading Panel, 2000; Ohio Department of Education and Workforce, 2024a; Shanahan, 2005).
Since 2023, Ohio has made significant strides in improving early literacy, with Governor DeWine’s literacy agenda focused on SoR (Poiner, 2023). A new policy framework mandates that public schools adopt curricula and instructional materials aligned with SoR by the 2024-25 school year. Schools and districts that have not yet adopted the SoR are required to replace their core curriculum and/or reading intervention programs to comply with ORC 3313.6028(C).
Thus, the 2024-2025 school year serves as a transition period for districts to select state-approved materials, procure and distribute them, and provide professional development to help teachers implement the new resources effectively (Ohio Department of Education and Workforce, 2024b).
In spring 2024, ODEW released a list of approved instructional materials for Grades K–5 to support the new frameworks. The list is based on comprehensive reviews by EdReports, a national nonprofit that evaluates the quality of instructional materials (Poiner, 2024; Ohio Department of Education and Workforce, 2024b). It includes two main categories:
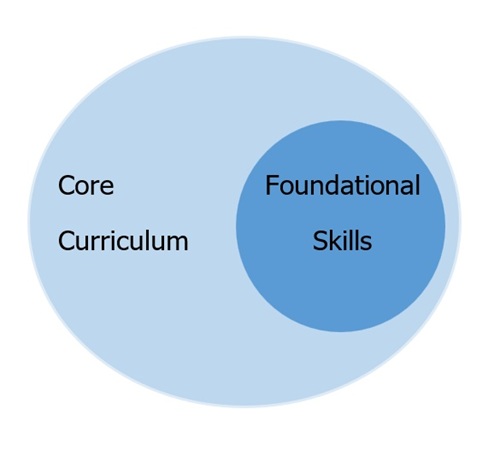
- Core comprehensive programs. These are teachers’ primary instructional tools and typically provide instruction on all reading skills and content, including all five SoR elements, foundational skills, and all other ELA standards (e.g., reading comprehension, writing, language and grammar, and speaking and listening).
- Foundational skills-only programs, which are supplemental programs that target early reading skills, primarily phonemic awareness and phonics.
Since most core programs include foundational skills lessons, teachers using those programs do not need a separate foundational skills program. However, Ohio includes two core materials, Wit & Wisdom and Fishtank Plus ELA, that do not contain foundational skills lessons for Grades K-2. These programs teach many literacy skills, including reading comprehension, fluency, and vocabulary, but they do not teach students phonemic awareness or phonics, the basic building blocks of learning how to read. Thus, teachers who use those two curricula must also use state-approved foundational skills curricula.
ODEW encourages districts to prioritize high-quality core programs, with SoR-based supplemental materials only used when necessary. This revised framework is intended to discourage the use of curricula not aligned with SoR, such as Fountas & Pinnell and Lucy Calkins’s Units of Study, which are notably absent from the list (Poiner, 2024).
Selecting a new curriculum aligned with SoR is an essential first step toward changing Ohio's early reading instruction. However, the success of Ohio’s literacy initiative will also depend on a number of next steps, such as high-quality curricular implementation and sufficient support and professional learning for teachers. The purpose of the present study is to understand the implementation process: which curricular materials teachers use for core and foundational skills, how they use these materials, their instructional techniques, and their professional learning experiences.
Analysis and Results
To gain a broad understanding of how early elementary teachers are progressing toward implementing SoR-aligned materials, the Institute fielded a state-wide survey to a stratified, random sample of K-3 teachers from public schools representative of Ohio’s traditional districts and community (i.e., charter) schools. Surveys were sent to 1,652 teachers from 120 schools in 48 districts. A total of 402 K-3 teachers responded to the survey, with a response rate of 24%, and responses were weighted to reduce non-response bias. See Appendices B and C for more details.
Teachers who responded to the survey were more experienced, with more than 17 years of experience on average, and evenly distributed across the four grade levels. On average, teachers taught 24 students, including approximately three English language learner (ELL) students and four students receiving special education services (i.e., with individualized educational plans or IEPs). Most notably, teachers indicated that an average of approximately 16 students in their class were on Reading Intervention and Monitoring Plans. Ohio law requires that schools develop a Reading Improvement and Monitoring Plan within 60 days for any K-3 student reading below grade level, and the plan must remain in place until the student achieves grade-level reading proficiency. Thus, survey responses suggest that approximately two-thirds of respondents’ students were reading below grade level (Ohio Department of Education, 2024c), highlighting the critical need for strong reading instruction.
Core Curricular Materials
Research shows that most teachers use various materials to plan lessons, even when given a comprehensive curriculum (Kaufman et al., 2020). Thus, to understand the range of sources teachers use to plan their core literacy instruction, the survey provided teachers with a list of all ODEW’s approved core instructional materials and options for other commonly used published materials that were not on the approved list. Teachers were asked to select all the materials they used for their core ELA lessons. Teacher responses show that while many teachers do consult unapproved materials when planning their literacy instruction, 70% of teachers primarily use a state-approved SoR core curriculum. In addition, while teachers generally have favorable impressions of their most frequently used core curricula, they have more mixed opinions about whether their curricula meet the needs of students below grade level, those learning English, and those with IEPs.
Figure 1 shows the percentage of teachers who use each material to plan their core literacy lessons. Note that state-approved materials are displayed as purple bars, and materials not approved by the state are orange.
Figure 1. Response to Survey Item: Please indicate which of the following instructional resources you draw upon for your core comprehensive ELA classroom lessons. (Select all that apply.)
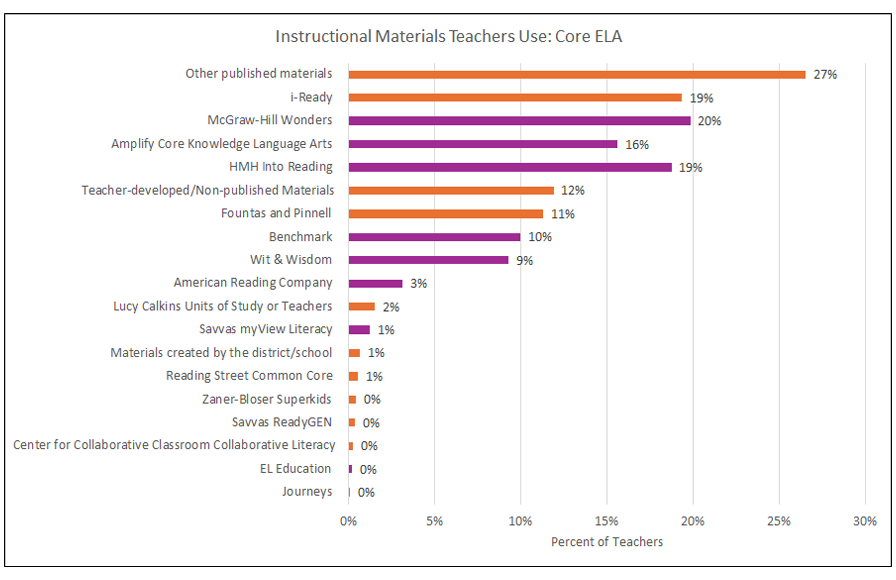 Note. Percentages do not add up to 100 because teachers could select multiple resources if they used them.
Figure 1 shows that teachers draw on a wide range of materials to plan their core literacy lessons, many of which are not on the state’s approved list of curricula. For example, more than a quarter of teachers use “other published materials” (i.e., published materials not listed in the survey), and 19% use i-Ready. This suggests that many teachers at least consult unapproved ELA materials that are not aligned with the state’s standards of high-quality SoR-aligned curriculum.
Most Frequently Used Materials
To better understand whether teachers primarily use state-approved curricula and which curricula teachers regularly use, the survey next asked teachers to indicate which instructional materials they used most frequently for their core comprehensive ELA classroom lessons. Teachers’ responses are shown below in Figure 2.
Figure 2. Responses to Survey Item: Which of these instructional resources do you use most frequently?
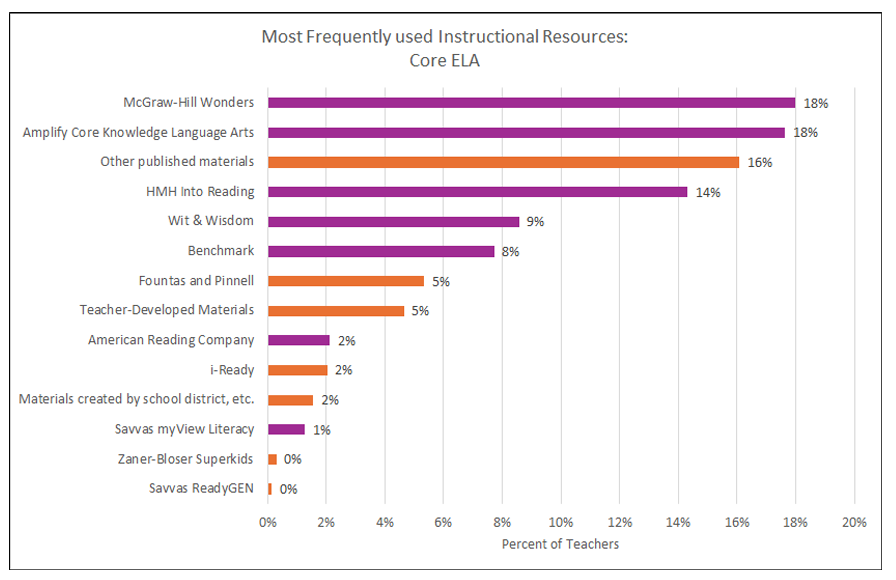 Note. Percentages do add up to 100 as teachers selected one primary resource.
Figure 2 shows that a variety of core curricular materials are used most frequently by K-3 teachers across the state. The most commonly used curricula are on ODEW’s approved curriculum list, including Amplify Core Knowledge (18%) and McGraw-Hill Wonders (17%). Collectively, 70% of teachers indicated that they most frequently use core curriculum approved by the state.
Figures 1 and 2 show that while most teachers use state-approved curricula, augmenting with other materials, often unapproved, is common. In addition, 30% of teachers indicated they did not use approved state materials to teach core ELA. This includes the 21% of teachers who indicated they use “other published materials” or “teacher-developed materials” most frequently. This suggests that further support is needed to reach full implementation among the 70% of teachers primarily using approved curricula and more intense, targeted support to reach the other 30% of teachers.
Teachers’ views of their Materials
Teachers indicated they had neutral to slightly positive impressions of their core curricula. Specifically, the survey asked teachers to rate their agreement about elements of their core curricula on a scale of 1, indicating strong disagreement, to 5, indicating strong agreement. Responses are shown in Figure 3.
Figure 3. Responses to Survey Item: Respond to the following statements about your impression of the curriculum.
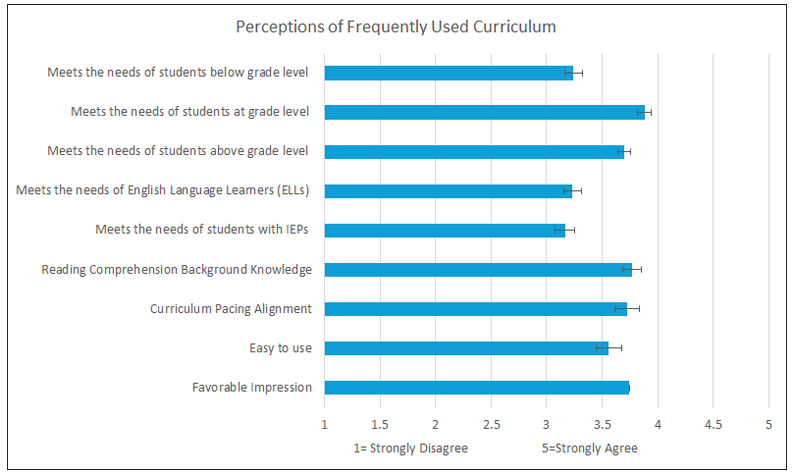
Teachers’ average responses across all questions range from 3, indicating “neither agree nor disagree” with the statement, and 4, indicating agreement. Figure 3 suggests that teachers generally had a slightly favorable impression of their curricula (with an average of 3.7) and most strongly agreed that their frequently used curriculum met the needs of students at grade level. However, teachers indicated more neutral responses when asked if their materials met the needs of their students below grade level, students learning English, and students with IEPs.
These more neutral responses are especially notable since teachers indicated that two-thirds of their students are below grade level. Teachers also reported teaching an average of three students who were learning the English language and four who had IEPs. Taken together, these groups represent most of the students in teachers’ classes, and teachers’ perceptions about the curriculum meeting these students’ needs may help explain why teachers augment these materials.
Foundational Skills Curricular Materials
All but two of the core curricula approved by ODEW also include lessons for foundational skills. This suggests that most teachers do not need to augment their core curriculum with a separate foundational skills curriculum. However, ODEW has approved 13 supplementary foundational skills materials. Teachers’ responses show that they are unlikely to use these state-approved foundational skills curricula but instead supplement their core curricula with different foundational skills curricula. Specifically, while 70% of teachers use state-approved core materials, only 47% use approved foundational skills materials. Figure 2 showed that only 9% of teachers used a core curriculum without foundational skills, suggesting that teachers are unnecessarily supplementing their core curricula. Even when the foundational skills supplements are state-approved, they are not aligned with the core curriculum. This is important because it results in unnecessary misalignment between two components of an instructional system that should work together. Survey responses also suggest that this decision is likely happening at the school or district level rather than at the classroom level, as many teachers indicate that their schools recently adopted new core curricula but that they have used their foundational skills curricula for longer.
Given teachers' frequent practice of constructing lessons from various sources, especially in ELA, the survey asked if they use the same core curricula to teach foundational skills (Kaufman et al., 2020). Teachers’ responses are shown in Figure 4. Respondents also indicate whether teachers used state-approved core curricula (in purple) or not (in orange).
Figure 4. Responses to Survey Item: Do you use the same curriculum to teach your core comprehensive ELA instruction and your foundational skills instruction?
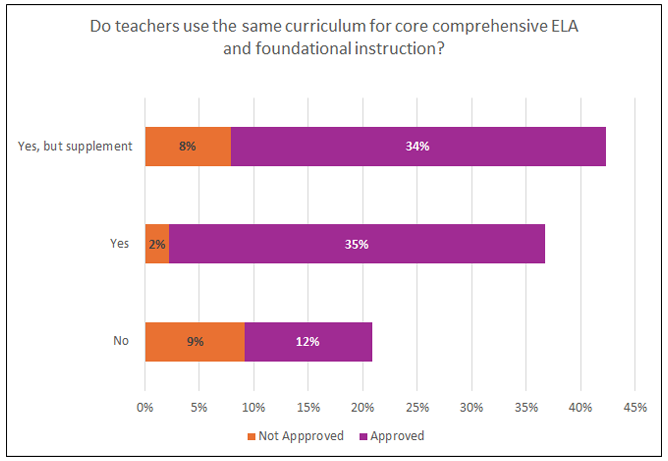
Figure 4 shows that the largest group of respondents, 42% of teachers, stated that they use the same curriculum for core and foundational skills lessons. However, they also supplemented their foundational skills lessons with additional materials. This is concerning, as SoR research finds that phonics instruction should be systematic (National Reading Panel, 2000), which is less likely when teachers augment lessons with materials from multiple sources. In addition, the state has indicated, through their approval, that the state-approved curricula are aligned with the SoR and do not need to be supplemented.
In addition, Figure 4 shows that 21% of respondents used a completely different foundational skills curriculum than their core curriculum (i.e., answered “No”). Combining these two groups suggests that the majority of teachers, some 63%, used at least two different resources for core and foundational skills, making alignment between lessons less likely.
To better understand the resources teachers primarily draw upon for their foundational skills lessons, Figure 5 shows all the materials teachers use most frequently for their foundational skills lessons. The response options included all state-approved foundational skills materials and other popular materials not approved by the state. Note that these responses only represent the 63% of teachers who use foundational skills materials outside their core curricula.
Figure 5. Responses to Survey Item: Which of these materials do you use most frequently?
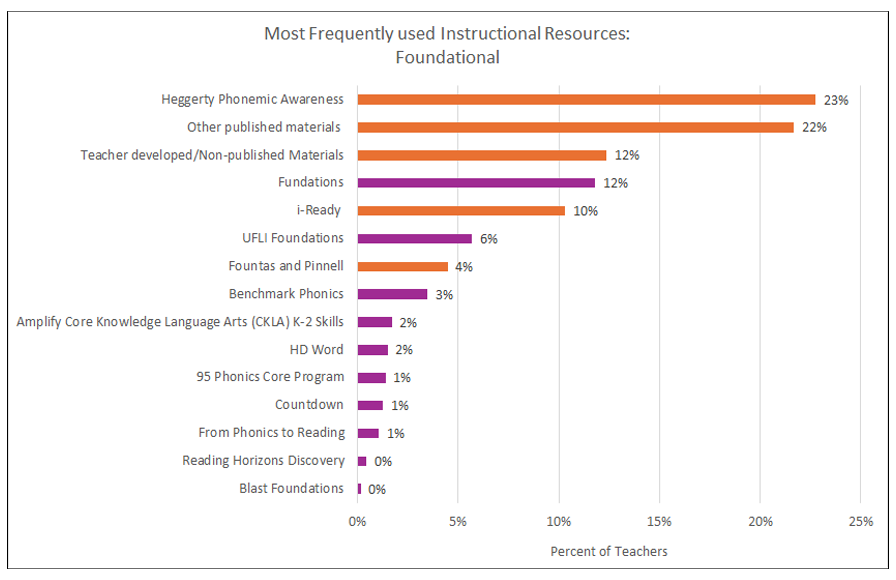
Figure 5 shows that when teachers do not use the same core and foundational skills curriculum, many use a foundational skills curriculum that is not approved by the state. Specifically, among teachers that did not use the same core and foundational skills materials, almost a quarter (23%) stated that they used Heggerty Phonemic Awareness, another 22% stated that they used other published materials not approved by the state, and 12% stated that they most frequently drew from unpublished or teacher-developed foundational skills materials. In total, 71% of these teachers used materials not approved by the state to teach foundational skills. This is especially concerning, given that foundational skills lessons are designed to teach students how to read.
Note, however, that Figure 5 only shows responses from teachers who use separate foundational skills curricula or use them to supplement core curricula and does not include teachers who used the same core and foundational skills curricula only. Thus, Figure 6 shows the percentage of teachers that used state-approved foundational skills curricula—whether embedded in their core curricula or as a separate or supplemental program—across all teacher respondents.
Figure 6. Percent of teachers who use ODEW-approved core and foundational ELA curricula.
Figure 6 shows that 47% of teachers used state-approved foundational skills materials, compared to 70% of teachers using state-approved core curricular materials. This suggests that the state is further along in implementing approved core materials than foundational skills materials.
Teachers’ views of their Foundational Skills Curriculum
When asked about their agreement to a series of questions about their impressions of their foundational curricula, teachers had more positive responses about foundational skills curricula, shown in Figure 7, than core curricula, shown in Figure 3.
Figure 7. Responses to Survey Item: Respond to the following statements based on your use of your chosen foundational skills curriculum.
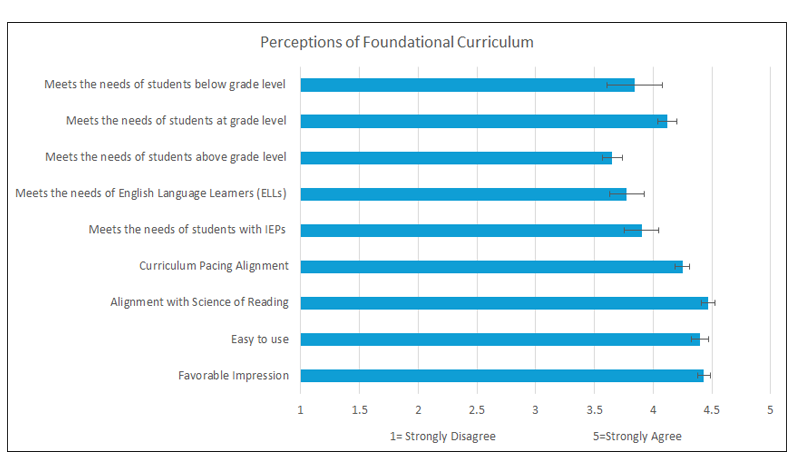
Teachers’ average responses across all questions ranged from around 3.5, where a 3 indicates a neutral response to a statement (“neither agree nor disagree”), to 4.5 indicates agreement with the statement. Figure 7 suggests that teachers generally had a more favorable impression of their foundational curricula (with an average of 4.4). They most strongly agree that their most frequently used foundational skills curriculum is aligned with SoR and is easy to use. Teachers indicated more neutral responses that the materials meet the needs of their students above grade level, below grade level, students learning English, and students with IEPs. However, these responses were higher than those about the core curricula.
Are Teachers Required to Use Specific Instructional Materials?
The survey also explored the extent to which teachers reported being required to use specific core and/or foundational skills materials. To shed insight on why a smaller percentage of teachers are using approved foundational skills materials, especially considering that teachers indicate more favorable responses to foundational skills materials, Figure 8 shows teachers’ responses regarding whether their school or district requires the use of specific core and/or foundational materials.
Figure 8. Responses to Survey Item: Please indicate whether your district/school system requires or recommends use of [your curriculum]?
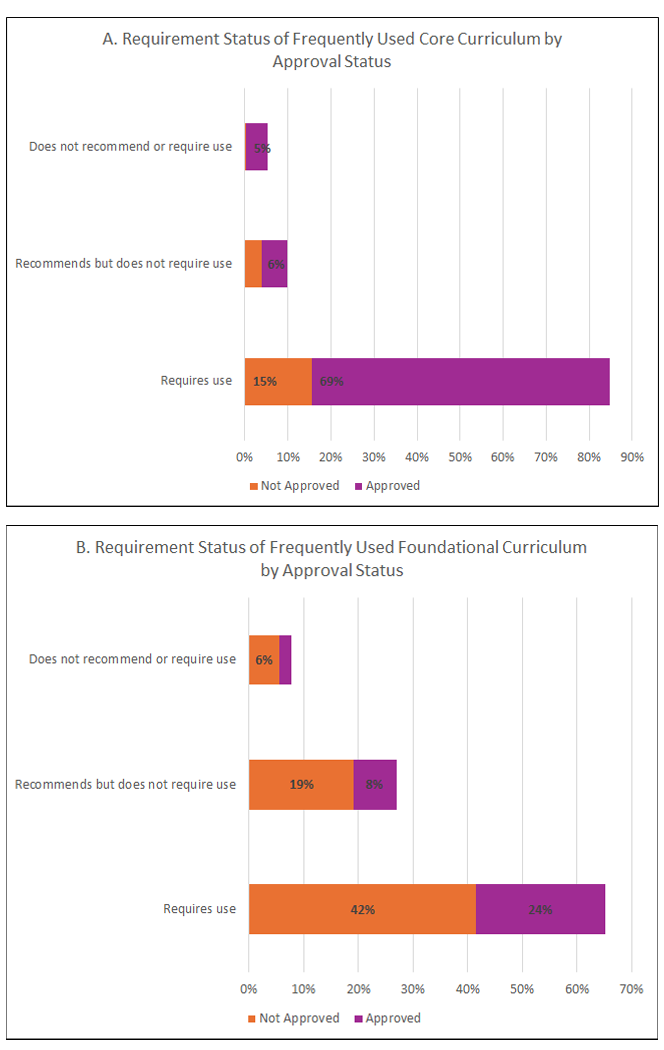
Figure 8 shows that more schools and districts require the use of core than foundational skills curriculum. In addition, while 15% of teachers state that their districts require the use of unapproved core curricula (e.g., suggesting that they have yet to transition to state-approved materials), 42% of teachers state that their districts require the use of unapproved foundational skills curricula. Thus, Figure 8 suggests that districts are further along in transitioning to core curricula than foundational skills curricula. However, this is puzzling since – to repeat a key point - most core curricula include foundational skills curricula.
Figure 9 may shed some insight into this, as it shows how long teachers have been using their core and foundational skills curricula.
Figure 9. Responses to Survey Item: How long have you been implementing your most frequently used instructional materials?
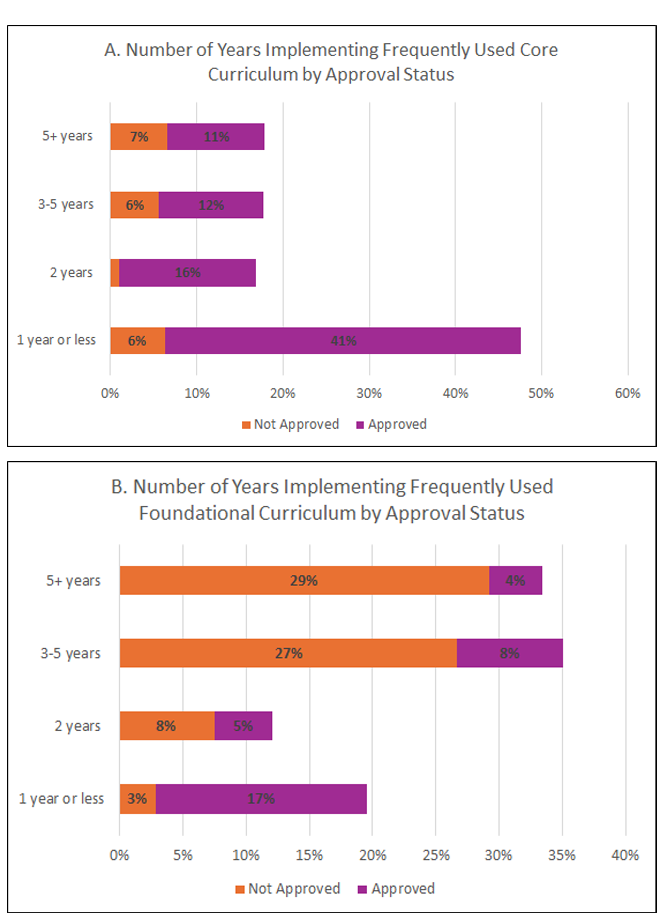
Panel A shows that most teachers use state-approved core materials, which are relatively new to many teachers. For example, 41% of teachers are in their first year of using state-approved core materials. In contrast, a small percentage of teachers still use unapproved materials, and most have been using these materials for relatively longer. This suggests that these teachers still need to transition to approved state materials (although it is surprising that 6% of teachers are in their first year of using unapproved curricular materials).
In contrast, Panel B shows that many districts and teachers have not yet transitioned to using state-approved foundational skills materials. This suggests that schools and teachers have continued to use their prior foundational skills curricula, even though they are not approved. Additional support may thus be needed to help schools and teachers move away from these known foundational skills materials. This transition is critical given that foundational skills are specifically designed to teach students how to read.
Foundational Skills Instructional Practices
To gain a deeper understanding of teachers’ instructional practices during their foundational skills lessons, the survey asked teachers about their general comfort level with teaching the five main elements of SoR. Teachers’ responses suggest that teachers felt comfortable teaching each of the five main elements of the SoR; all responses are between 4 and 5, indicating that teachers felt very and extremely comfortable on average.
In addition, the survey asked teachers about their use of more specific instructional strategies aligned with SoR. Teachers were asked how frequently they use each strategy every week, with a response of 1 indicating that they do not use the strategy at all and 5 indicating that they use it a great deal. Responses are shown in Figure 10.
Figure 10. Responses to Survey Item: In a typical week, how much do you ask your students to engage in the following practices during ELA class?
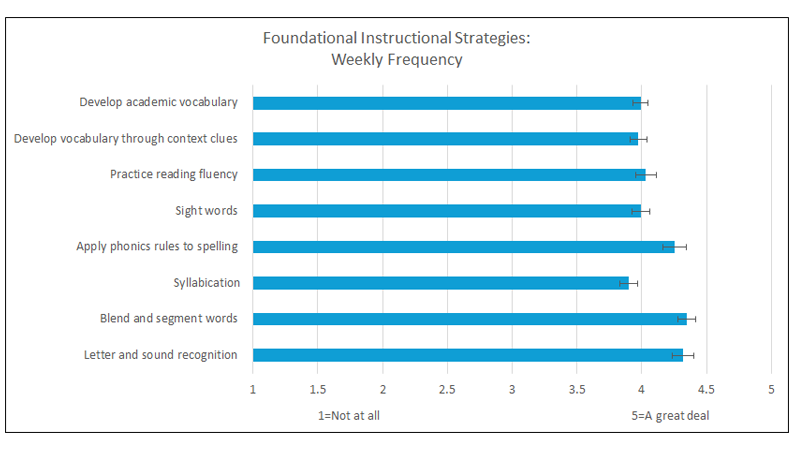
Figure 10 shows that teachers regularly used each SoR-aligned strategy, with all responses close to 4 or “a lot.” In addition, teachers most regularly practiced letter and sound recognition, blending and segmenting words, and applying phonics rules to spelling with their students. On average, teachers practiced syllabication and developing vocabulary slightly less regularly.
Teachers were asked how frequently they used additional tools and methods in their classrooms, several of which were not aligned with SoR (e.g., running records, three cueing, balanced literacy, leveled readers, guessing from context, pictures, or other clues). These responses are shown in Figure 11.
Figure 11. Responses to Survey Item: In a typical week, how much do you use the following tools and methods in your classroom to help kids learn how to read?
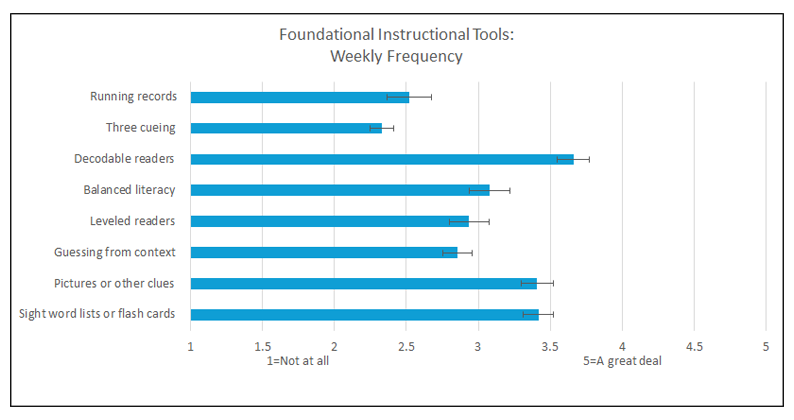
Figure 11 suggests that teachers are less likely to employ instructional practices that do not align with SoR. For example, on a scale of 1 to 5, where a 2 indicates using the method “a little” and a three indicates the method is used “some,” teachers’ average response to the use of the three cueing system is 2.3, their use of prompting students to guess an unknown word from context clues is 2.9, and prompting for students to guess an unknown word using pictures or other clues is 3.4. Thus, Figures 10 and 11 suggest that SoR-aligned practices were more common than practices less aligned with SoR. These differences highlight the partial implementation of SoR: teachers are now comfortable with SoR’s main components and are more likely to use instructional practices aligned with SoR research. However, they still sometimes rely upon old, unaligned practices.
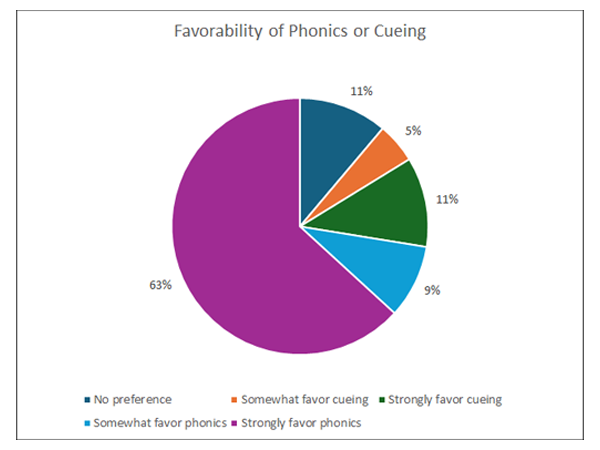
Use of non-SoR Practices
This partial implementation is highlighted in Figure 12, which shows teachers’ responses to a question asking if they generally favor using phonics or cueing. Most teachers, 72%, preferred phonics over the three-cueing system, with most indicating a strong phonics preference. Among the more than a quarter of teachers remaining, 11% indicated no preference between the two approaches. Thus, we estimate that 16% of K-3 teachers across Ohio still favored teaching reading using the three-cueing system.
Figure 12. Responses to Survey Item: Do you generally favor the use of phonics (i.e., encouraging students to sound out words) or cueing (i.e., encouraging students to use context clues) when teaching?
Science of Reading Professional Learning
Teachers’ responses about the quantity of professional learning (PL) they received to support ELA instruction over the past year suggest an increase in ELA professional learning than they typically receive. Specifically, teachers indicated that they received an average of almost 26 hours of PL to support their ELA instruction in the past year. Approximately 68% of teachers indicated that the PL support they received this year increased compared to a typical year. In comparison, 23% responded that professional development remained the same as in a typical year.
In addition, teachers’ responses indicate that most teachers received PL support for using ELA curricular materials and SoR instruction. Specifically, 70% of teachers participated in PL to support their most frequently used curriculum. In addition, 86% of teachers indicated that they participated in PL to support instruction in SoR, and 55% of teachers indicated they participated in SoR PL provided by ODEW.
To learn more about the quality of teachers’ SoR PL, the survey asked teachers to indicate how much they agreed with statements about their experiences. Responses are shown in Figure 13, where a response of 1 indicates that a teacher strongly disagreed with the statement, and 5 indicates strong agreement.
Figure 13. Responses to Survey Item: Please respond to the following statements regarding the PL (the language used in the survey was professional development) you received to support your literacy instruction in the science of reading over the past year.
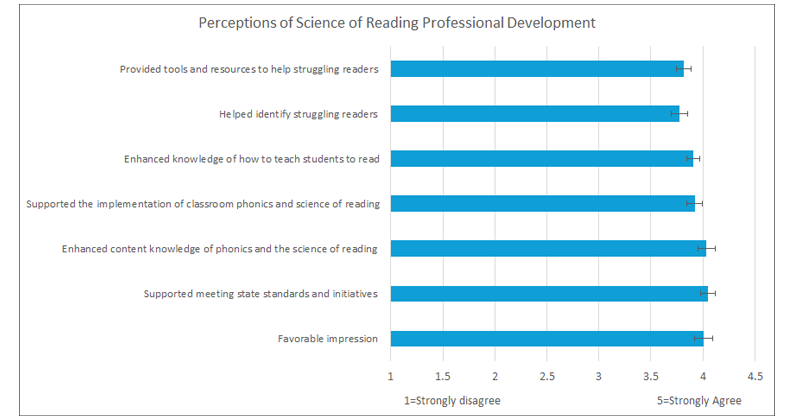
Figure 13 suggests that teachers had a positive view of their SoR PL. Average answers are all close to 4, indicating “agreement” with the statements. Teachers had the strongest agreement that they have a favorable impression of the PL, that the PL supported meeting state standards and initiatives, and that it enhanced their content knowledge of phonics and SoR. Teachers had slightly less positive responses, an average of 3.8, to statements about identifying and supporting struggling readers and to a statement that the PL provided teachers with resources and tools to support struggling readers. These responses suggest that teachers believed they benefited from their SoR PL and might benefit from additional professional learning to support their struggling readers.
Summary of the Results and Implications
Teachers’ responses to the survey suggest a partial but incomplete implementation of SoR-aligned curricula. While the teacher survey shows evidence of the success of Ohio’s efforts to improve early literacy, it also indicates that more work is needed to complete the implementation process and better support the two-thirds of respondents’ students who are below grade level in reading.
The survey revealed that 70% of teachers use state-approved core curricular materials most frequently. However, a significant number, 30%, also use non-approved curricula or teacher-developed materials. The survey revealed that only 47% of teachers used a state-approved foundational skills curriculum. This is surprising, given that all but two of the state-approved core curricula include foundational skills lessons.
- Recommendation: Ensure that all state-supported PL and any webinars or other public advocacy promote the use of foundational skills materials in the core curricula and discourage the use of supplemental materials. Using a single, high-quality curriculum helps ensure alignment and coherence in literacy instruction. We recommend allowing districts to select supplemental foundational skills materials only if their core curricula do not include them (such as in the case of Wit & Wisdom).
Teachers’ responses suggested that some schools and districts have not yet implemented a state-approved core curriculum.
- Recommendation: Once the state has identified districts that have not adopted such curricula, require those districts to do so (for example, by incorporating the requirement to state grant applications, providing PL support only for state-recommended curricula, and sharing selection rubrics).
Some teachers are not using state-approved core curricula, and some teachers who are using such curricula are not using them to teach foundational skills (even though almost all the core curricula include materials to support such teaching).
- Recommendation: Encourage individual teachers’ use of district-selected materials by aligning teacher observation rubrics to their district’s curricula. ODEW may support this by providing exemplar observation rubrics and existing curriculum-specific rubrics. Focus PL on curriculum-specific pedagogy.
While teachers are generally satisfied with their state-recommended materials, they are less satisfied with their efficacy when it comes to teaching students who are below grade level.
- Recommendation: Focus professional development on training teachers to identify struggling learners, tailor instruction to their needs, and monitor progress effectively.
While Ohio’s initiative is progressing towards the widespread use of SoR-based reading instruction, effective implementation at scale will depend on targeted incentives, focused PL support, and close monitoring to ensure that districts and teachers fully adopt SoR-aligned materials and practices and discard non-SoR-aligned materials and practices.
Fordham Institute acknowledgements
We wish to thank Alanna Bjorklund, David Steiner, and Ashley Berner at Johns Hopkins University, for designing the survey and producing the fine report that follows. Special thanks to Lisa Gray, Kevin Duff, and Cassandra Palsgrove of Ohio Excels who provided thoughtful input on the survey and report drafts. We’re grateful to the staff at the Ohio Department of Education and Workforce who supported this effort, particularly Melissa Weber-Mayrer and Sherine Tambyraja. We also wish to thank Tom Lasley of Learn to Earn Dayton and Tony Podojil of the Alliance for High Quality Education who helped encourage survey participation. On the Fordham team, our thanks to Michael J. Petrilli and Chester E. Finn, Jr., who provided feedback on an earlier draft. We wish to thank our Fordham-Ohio colleagues Jeff Murray and Jessica Poiner for helping on this project in various ways.
This report was made possible through generous financial support from Ohio Excels, as well as our sister organization, the Thomas B. Fordham Foundation.
References
Doan, S., & Shapiro, A. (2023, December 11). Do Teachers Think Their Curriculum Materials Are Appropriately Challenging for Their Students? Findings from the 2023 American Instructional Resources Survey. Rand.org; RAND Corporation.
Castles, A., Rastle, K., & Nation, K. (2018). Ending the reading wars: Reading acquisition from novice to expert. Psychological Science in the Public Interest, 19(1), 5-51.
Dillman, D. A., Smyth, J. D., & Christian, L. M. (2014). Internet, phone, mail, and mixed-mode surveys: The tailored design method (4th ed.). John Wiley & Sons.
Kaufman, J. H., Doan, S., Tuma, A. P., Woo, A., Henry, D., & Lawrence, R. A. (2020, August 31). How Instructional Materials Are Used and Supported in U.S. K–12 Classrooms: Findings from the 2019 American Instructional Resources Survey. Rand.org; RAND Corporation.
Levy, P. S., & Lemeshow, S. (2008). Sampling of populations: Methods and applications (4th ed.). John Wiley & Sons.
National Reading Panel (US), National Institute of Child Health, & Human Development (US). (2000). Report of the National Reading Panel: Teaching children to read: An evidence-based assessment of the scientific research literature on reading and its implications for reading instruction: Reports of the subgroups. National Institute of Child Health and Human Development, National Institutes of Health.
Ohio Department of Education and Workforce. (2024a,). Implementing Ohio’s Plan to Raise Literacy Achievement A Guide for School Leaders, Grades K-5.
Ohio Department of Education and Workforce. (2024b, March 4). Updated list of approved core curriculum and instructional materials for English language arts.
Ohio Department of Education and Workforce. (2024c, August 28). High-Quality Instructional Materials in English Language Arts FAQ | Ohio Department of Education and Workforce.
Ohio Department of Education and Workforce. (2024d, December 18). District Resources.
Petscher, Y., Cabell, S. Q., Catts, H. W., Compton, D. L., Foorman, B. R., Hart, S. A., ... & Wagner, R. K. (2020). How the science of reading informs 21st‐century education. Reading Research Quarterly, 55, S267-S282.
Poiner, J. (2024). Ohio continues to move toward high-quality reading curricula. The Thomas B. Fordham Institute.
Science of Reading Professional Development Requirements under House Bill 33 of the 135th General Assembly Guidance for Districts and Schools. (2024).
Shanahan, T. (2005). The national reading panel report: Practical advice for teachers. Learning Point Associates.
Shanahan, T. (2020). What constitutes a science of reading instruction? Reading Research Quarterly, 55, S235-S247.
Shen, Z., Curran, F. C., You, Y., Splett, J. W., & Zhang, H. (2023). Intraclass Correlations for Evaluating the Effects of Teacher Empowerment Programs on Student Educational Outcomes. Educational Evaluation and Policy Analysis, 45(1), 134-156.
Valliant, R., Dever, J. A., & Kreuter, F. (2018). Practical tools for designing and weighting survey samples. Springer International Publishing.