Mobile Navigation

  • National
    • Policy
      • High Expectations
      • Quality Choices
      • Personalized Pathways
    • Research
    • Commentary
      • Gadfly Newsletter
      • Flypaper Blog
    • Events
    • Scholars Program
  • Ohio
    • Policy
      • Priorities
      • Media & Testimony
    • Research
    • Commentary
      • Ohio Education Gadfly Biweekly
      • Ohio Gadfly Daily
  • Charter Authorizing
    • Application
    • Sponsored Schools
    • Resources
  • About
    • Mission
    • Board
    • Staff
    • Career
Home
Home
Advancing Educational Excellence

Main Navigation

  • National
  • Ohio
  • Charter Authorizing
  • About

Matthew Carr
9.17.2026
Fork in the road
Getty Images/Liudmila Chernetska
Listen to this article
Loading the Elevenlabs Text to Speech AudioNative Player...

The backlash against the “college for all” movement was overdue. For too long, high schools treated a four-year degree as the default destination for too many students, without paying enough attention to how well students were prepared to embark on that pathway, the quality and costs of the colleges they might apply to, or the availability of alternatives that might be a better fit. But today we risk overcorrecting. The danger is replacing that overly broad default assumption with an overly confident effort to direct more students away from the path of a traditional four-year degree.

The growth of high-quality career and technical education programs, experiential learning opportunities, and other career-focused pathways has been an important and much-needed development. And there is good evidence behind the enthusiasm. Rigorous studies of Career Academies, technical high schools, and P-TECH have all found gains in earnings, graduation, and postsecondary attainment for participating students. But corrections can swing the pendulum too far in the other direction—and, as the history of K–12 education reform has shown, they often do.

As momentum gathers toward “multiple pathways,” we should be careful not to interpret modest grades, humble test scores, or other lackluster measures of college readiness as ironclad evidence that students would be better off pursuing something other than a four-year degree. A student’s academic record can help predict whether she will complete college. But the actual choice confronting that student is different: Would attending college leave her better off than pursuing her best available alternative?

One useful way to think about the problem is through the possibility of making mistakes in two different directions. Any rule we use to guide students toward different post-secondary paths will inherently produce some false positives and some false negatives. The first type of mistake is familiar. We encourage a student to attend a four-year college, but he struggles and ultimately drops out, incurring both financial and opportunity costs. This person may well have been better served by another pathway. That is a false positive: We recommended college when another option would have produced a better outcome. The other type of mistake runs in the opposite direction: we discourage a student whose academic record raises questions about their college readiness but who, with access to the right college and sufficient supports, would have completed a degree and benefited substantially. That is the false negative.

Much of the post-secondary debate in recent years has focused on the first error. However, recent research suggests we should take the second type of error more seriously.

A study of public four-year universities in Texas compared students just above and below admissions cutoffs, allowing researchers to isolate the impact of enrolling in college for students near the threshold. Those just above the admissions cutoff, and thereby eligible to enroll, increased their bachelor’s degree attainment by about 12 percentage points and eventually raised their earnings by roughly 8 percent compared to those students who fell just below the line and were not eligible to enroll. What is particularly important to keep in mind is that these were students near the margin of admission rather than the strongest applicants—meaning we would expect them to be at greater risk of dropping out.

A similar study in Georgia reached a similar conclusion. Enrolling in one of the state’s public four-year universities increased bachelor’s degree attainment and was estimated to raise household income around age 30 by roughly 17 percent, with larger benefits observed for students coming from lower-income high schools.

A note of caution: These studies apply to students who were just above and below admissions eligibility thresholds, so the findings should not be generalized to all students whose academic records might raise questions about their readiness to succeed in college-level courses. Still, they provide a useful reminder that students with a lower predicted probability of completing college do not necessarily face lower expected returns from attending.

For example, imagine a student whose academic record suggests only a 50 percent probability of completing a bachelor’s degree. That estimate is useful but, in isolation, tells us very little about whether college is the right choice. The decision also depends on a host of other factors, including which colleges are realistically accessible, eligibility for financial aid packages, out-of-pocket costs, the availability of wrap-around supports, the long-term payoff from completing, the opportunity costs of enrollment, and the alternative pathways actually available.

As important, the costs of the two errors may differ substantially in the long run. Sending a poorly matched student to college can mean debt, lost time, and foregone earnings. Steering away a student who would have completed can mean giving up a lifetime of higher earnings and other benefits generally associated with attaining a degree.

This is where the distinction between false positives and false negatives becomes especially useful. Any benchmark used to classify students as more or less likely to complete college changes the balance between the two errors. A more restrictive threshold may reduce the number of students who enroll and struggle, while increasing the number who are discouraged from attending even though they would have benefited. A more relaxed threshold shifts those risks in the other direction. That should make us cautious about replacing the old “college for all” model with another simplistic approach. If prediction cannot usefully tell us which path would be better for any given individual, then we should focus instead on helping students more carefully weigh the tradeoffs involved.

Research suggests that high school advising can be an important part of that process. Two recent studies are instructive. Bottom Line, an intensive advising program, pairs lower-income students with professional advisers who help them develop college lists, navigate the application and financial aid processes, compare options, and decide where to enroll. Advising continues into college for students who attend participating institutions. An evaluation found the program increased bachelor’s degree attainment, with much of the effect appearing to come from students enrolling at colleges with stronger average outcomes.

A second study examined a very different advising model. Across 62 Michigan high schools, seniors were offered an 18-week college-planning curriculum delivered largely by current teachers and school staff. The course addressed two- and four-year options, the costs and benefits of college, navigating application and financial aid processes, and broader career planning. The course did not increase college enrollment overall. Instead, it influenced who enrolled. Enrollment increased among students with stronger academic records and decreased among some students with weaker records. Ultimately, the program was found to increase longer-term persistence and associate-degree attainment among more academically prepared students.

That pattern is especially relevant to the current debate. The objective was not simply to push more—or fewer—students toward college. Better information and structured support appear to have helped some students enroll who otherwise might not have, while leading others to reconsider enrollment when it wasn’t the best available path for them.

But better advising should not simply mean giving high school advisors or teachers more discretion to decide who is “college material.” In Noise, Daniel Kahneman, Olivier Sibony, and Cass Sunstein describe how professional judgments can vary significantly across decision-makers confronting similar cases. Their proposed solution is what they term “decision hygiene,” which involves systematically assessing the relevant components of a particular judgment using the best available information before forming a conclusion.

Neither study noted above describes its intervention in those terms, but both embody a similar idea. They break a complicated decision about choosing a post-secondary pathway into a more manageable set of questions rather than relying on a single predictor or a general impression of whether a student is “college ready.” Applied to high school advising, even modest improvements to the process can improve the odds that a student will select the pathway that leaves them better off than the alternatives. Those judgments will still be imperfect. But with a more intentional approach, advisers can reduce reliance on incomplete information or overly broad assumptions.

Ultimately, the evidence points to a critical question that is often overlooked: How can we help students choose the post-secondary option that improves their long-term outcomes the most, while reducing the costs of errors in both directions? Answering that question depends on preparing students for multiple possible pathways and ensuring that valuable and accessible alternatives to a four-year college degree exist. Advising should help students evaluate those options using the best available information about the likely benefits, costs, supports, and fit, customized to their specific circumstances.

It also means preserving valuable options for as long as possible. When uncertainty is unavoidable—which will always be the case when discussing teenagers—keeping multiple viable pathways open may be more valuable than sorting students earlier.

Policy Priority:
High Expectations
Topics:
Governance
Teachers & School Leaders
Alicia Anderson
9.17.2026
Sad students on computers
Getty Images/AnnaStills
Listen to this article
Loading the Elevenlabs Text to Speech AudioNative Player...

“The turbulent AI era is here. The choices we make now are critical.” So begins Bill Gates, calling for the world to wise up to the risks we face as the technology rapidly approaches capabilities beyond human imagination and control.

It is not hyperbole to say that the stakes are high. The Pope has warned about the erosion of human ability to think. An Anthropic researcher publicly quit, citing concerns that the AI industry is acting recklessly given the “civilizational stakes” of its work. Leaders of the nation’s top AI companies appear to agree that the technology is potentially catastrophic, warranting a slowdown.

As a parent who watched tech leaders defend their predatory practices in a series of lawsuits over the past few months, I find this new call for safeguards among competing tech titans almost too hard to process.

It took well over a decade to see the alarming impact of smartphones, social media, and school-issued devices on children, and longer still to demand action to protect students from harmful effects. We clearly can’t wait that long on AI.

Alongside device bans and restrictions, school districts are racing to develop AI use policies—first piecemeal and now expansive. In New York City, the mayor announced a moratorium on student-facing AI use through eighth grade. District administrators in Los Angeles went further, apparently surprising even school board members with their total ban.

But AI use is about much more than whether a child can access Gemini on their Chromebook at school. In addition to increasingly clear impacts on learning, AI use raises complex questions about honesty, judgment, and whether struggling through difficult work has inherent value separate from the final product. Parents who believe a child’s moral education starts at home need to engage in conversations about when and how—or if—the technology should be used.

—

My eighth-grade daughter is taking “Humanities” this fall, an elective that apparently used to involve watching a lot of movies before a language arts teacher filled a last-minute vacancy and was given free rein to adjust the class as he saw fit. At back-to-school night, he discussed how our children are constantly inundated with media and shared his desire to help them learn how to view content with appropriate skepticism. (Amen!)

The teacher described a shift among students and families; it’s a change I’ve observed as well. Parents are more cautious about screen time, or at least more aware. Kids themselves know that social media is harmful (though they don’t stop using it when left to their own devices). My oldest child, born just as smartphones entered the chat and now a college freshman, went through the hollowed-out, tech-filled, high school experience described in Fordham’s report on high school in the age of distraction. For my youngest child, in her last year of elementary school, teachers seem noticeably more cautious about technology in their classrooms. Instead of seeking out ways to incorporate tech, they ask whether the task works without it.

This “techlash” is taking hold across the country. In Lower Merion Township, outside Philadelphia, parents are suing to retain the right to opt their children out of mandatory tech use in the classroom. Los Angeles preceded its new AI-ban with a sweeping screen-time policy passed over the summer, developed largely in response to parent demands. After years of heated conflict over partisan-coded issues like book bans and preferred pronouns, school leaders are hearing from parents across the political spectrum who don’t want their children sitting in front of screens all day, doing who knows what.

Action on screen time, driven by consensus, is a welcome development. Yet limiting the number of minutes a child spends on their school-issued device does not resolve the difficult questions—more moral than technical—that come with an AI future.  

Toward the end of our seven-minute block together at back-to-school night, my daughter’s teacher turned to AI and his enthusiasm disappeared. He was visibly disturbed by the dual reality that our children will live with AI tools and thus should know how to use them, while it is clear that the technology erodes cognitive development in ways we are only beginning to understand.

AI increases academic efficiency on certain assignments. Students may earn better grades for less work, but a recent analysis of closed-book test scores confirms that students using AI are not obtaining knowledge along the way. Meanwhile, some teachers are producing AI slop lesson plans and feedback, undermining student effort in exactly the moment when kids need to understand that effort is at the center of real learning, not the production of a polished final product.

The technology is changing faster than any state, district, school, or teacher can update their policies and procedures, which makes it exceptionally difficult to define what type of AI use constitutes cheating. Is it really that different from spell-check or a calculator? (Yes!) And even if kids want to avoid AI, their perceptions of peer use mean that every assignment brings a moral reckoning over whether the cost to not use AI is too high.

Few kids are prepared to fully grapple with these ethical concerns, especially when few adults can even begin to develop and articulate shared norms over how and when AI should be used.

As parents, our job is to support the development of our child’s moral compass, cognitive growth, and intellectual curiosity. At a minimum, we can ask our children about AI use and stay aware of their schools’ and teachers’ policies. We can push our kids to think about how and when technology should be used, and what happens when their moral convictions or family rules come in conflict with what others consider appropriate use. We can stress how shortcuts are limiting, even if peers take them to get ahead in the short term. Better—we can do all these things in partnership with the educators who guide their learning for many hours each day.

Children need to learn how to navigate technology with the confidence that they can reason, appreciate, converse, and serve their communities in distinctly human ways. Building this confidence requires teaching kids to work hard and think independently, without reliance on powerful tools that adults don’t fully understand and that their creators may not be able to control. Pressing “pause” on AI in schools is necessary but insufficient. Today’s students will not know a world without this new technology, and it’s up to the adults in their lives to equip them with the human capacity to debate and decide how it should be used. 

Policy Priority:
High Expectations
Topics:
Curriculum & Instruction
Governance
Teachers & School Leaders
Kathleen Porter-Magee
9.17.2026
Empty desks with backpacks
Getty Images/AnnaStills
Listen to this article
Loading the Elevenlabs Text to Speech AudioNative Player...

Private-school choice advocates, particularly in red states, have a lot to be excited about right now. Since 2020, more than two dozen states have either expanded or created state-level choice programs, which means that 18 states now have choice programs that are either universal or near universal and 27 have already elected to participate in the new federal scholarship tax credit, which will take effect in 2027. Taken together, these policy developments have created an unprecedented opportunity to tap into the demand for and increase access to a private school education, particularly among families who previously were unable to afford one. The question we face now is: How do we ensure that the families that want a good private or parochial school for their children can find one?

Until now, much national attention has focused on creating new schools. Venture philanthropies like the Drexel and VELA funds are both primarily (though not exclusively) focused on seeding growth among new schools, scaling existing schools and networks, or investing in low-cost innovation. This is important work, and over the long run the new school start-ups they support will add importantly to the supply of places for students to learn. But to ramp up quickly enough to meet today’s fast-rising demand, seeding and scaling growth should be two elements of a three-tiered effort to boost supply. Those tiers should include a coordinated push to fill the excess capacity in already existing schools; an investment strategy aimed at helping thriving existing schools and networks grow (i.e. scale); along with investments in new-school start-up and innovation to seed new schools and networks, particularly in areas where limited supply exists.

For those looking to ramp up quickly, we must acknowledge that the first tier provides the best and most cost-effective way to grow private schools quickly.

The fact is that excess private school capacity exists in communities all over the country, most heavily concentrated in the Catholic sector. For more than two decades, overall Catholic school enrollment, particularly urban Catholic school enrollment, has shrunk. A number of internal and external factors have contributed to the decline, including a dramatic increase in tuition-free competition from the charter school sector; an internal shift in staffing structure from one that relied heavily on religious men and women to one that required a far greater number of lay (and salaried) faculty, staff, and leadership; and a policy and philanthropic environment that has, for decades, funneled billions to seed growth and operations in the district and charter sectors, while the private and parochial school sectors were largely left out.

In short, the combination of internal financial challenges combined with an investment strategy that starved parochial schools while ramping up investments in competitors has constrained Catholic school enrollment across the country.

While recent private school choice policy victories haven’t fully leveled the fiscal playing field (parents choosing private schools will still get a fraction of the funds that public schools receive), they are an important step towards allowing private schools to compete on the same terms as their district and charter counterparts. If we add to that intentional investments in Tier 1 and 2 enrollment and capacity-building support, many communities will be able to quickly increase overall private school enrollment, which is critical to demonstrating the demand that does exist for more options.

To understand what’s possible, it’s worth looking more closely at a state that is a trailblazer in expanding access to private schools: Florida.

In August 2022, Florida’s Step Up For Students surveyed more than 2,000 private schools and found that participating schools were operating at 79 percent of capacity, with room to add another 84,442 students. Between 2021 and 2024, thanks to a combination of targeted philanthropic support, local efforts to attract more families, and strong local leadership, much of that existing capacity has been filled. Specifically, while the overall population of school-aged children (ages 5–17) increased by 4 percent between 2021 and 2024, private school enrollment increased by nearly 20 percent (more than 80,000 students). And these gains were driven largely by intentional efforts to fill vacant Catholic school seats.

Catholic dioceses across Florida invested heavily in family outreach. The Diocese of Venice alone launched a marketing campaign that sent more than a million texts and emails, helping families understand that a private education was now in reach. The Archdiocese of Miami invested in both strengthening existing academic programs and launching new dual-language programs, classical programs, and programs aimed directly at supporting students with special needs. They also expanded capacity by re-opening four schools that had recently closed.

These efforts paid off and helped drive a 19 percent increase in Florida Catholic school enrollment between 2022 and 2025. Jim Rigg, Secretary of Catholic Schools in the Archdiocese of Miami said, “at this point, there are areas of South Florida where there are simply no open seats in a Catholic school.”

Florida isn’t alone. Texas recently passed the largest Education Savings Account program in the nation, and the Texas Conference of Catholic Bishops worked quickly to ramp up Tier 1 enrollment and parent outreach support to Catholic schools across the state with the goal of increasing their enrollment by at least 20,000. Early evidence suggests that this targeted outreach and support is having an impact. As the new school year began, the Archdiocese of Dallas has projected it will add roughly 2,500 new students using Texas Education Freedom Accounts to attend Dallas Catholic schools in 2026–27. The Diocese of Beaumont projects a 15 percent overall increase in enrollment, and Corpus Christi estimates that enrollment will increase by 8 percent.

These early examples suggest how existing schools, supported by organized outreach and practical assistance, can respond quickly when new public funding makes tuition affordable. And the good news is that, unlike new school startups, growth in existing schools requires relatively modest, time-limited investments that focus on infrastructure improvement, systems development and support, and targeted outreach and culture building.

So if we want the supply of places in private schools to keep pace with the new opportunities, we need a national strategy that arms existing under-enrolled schools with the strategic investment and targeted technical assistance they need. And we need to understand that that’s far less costly than starting schools from scratch. There’s no land acquisition. There are no complex leases to negotiate. There’s little or no new bricks-and-mortar required, just some retrofitting and modernizing work that can be done relatively quickly.

Of course, investment in filling existing seats doesn’t preclude the need to start new schools in targeted markets. But if the aim is to make choice real for more families now, the first question in every state should be simpler: Where are the good schools with room to grow, and what will it take to help them find the families newly empowered to choose them—and vice versa? 

Policy Priority:
Quality Choices
Topics:
Facilities
Governance
Private School Choice
Amber M. Northern, Ph.D.
9.17.2026
C grade on a chalkboard
Getty Images/Esin Deniz
Listen to this article
Loading the Elevenlabs Text to Speech AudioNative Player...

The National Center for Education Statistics (NCES) regularly publishes reports using results from NAEP testing to compare the proficiency standards that states set for their students. Since standards vary across states, the results of state assessments can’t be used to directly compare students’ progress from place to place. But by placing a state standard or cut score onto the NAEP scale, which is a common metric, a NAEP-equivalent score of that standard can be generated and compared across states. NCES’s latest Mapping State Proficiency Standards report, the ninth in the series, puts this method to work on student achievement results from state and NAEP assessments administered in 2022. Because states are required to participate in NAEP reading and math in grades 4 and 8, the assessment also serves as an external audit of state expectations—one that sits beyond any individual state’s control.

The latest iteration maps state expectations in fourth- and eighth-grade reading and math onto NAEP’s 0–500 scale, showing whether they line up with NAEP Basic or NAEP Proficient levels. There is some fluctuation between findings of the previous report in 2019 and these 2022 data, but not a great deal. More on that in a moment.

Let’s look at the most recent levels first. Only three states were equivalent to NAEP Proficient in both subjects and both grades in 2022—Illinois, Massachusetts, and Rhode Island. In grade 4 reading, 48 states had standards at or above NAEP Basic. Of those, six states had standards at the NAEP Proficient level—Alaska, District of Columbia, Illinois, Massachusetts, Oklahoma, and Rhode Island. Two states—Iowa and Virginia—had standards below NAEP Basic. (Make no mistake that the Old Dominion’s unacceptable standing on this metric is motivating serious work from those of us on the state board!)

In grade 8 reading, 48 states had standards at or above NAEP Basic and six of them were at NAEP Proficient—Illinois, Kansas, Massachusetts, Rhode Island, Tennessee, and Wisconsin—while two states—Iowa and Virginia—had standards below NAEP Basic.

In grade 4 math, 50 states had standards at or above NAEP Basic level. Thirteen had standards at NAEP Proficient—Alaska, Colorado, District of Columbia, Illinois, Kansas, Maryland, Massachusetts, Nebraska, New Jersey, North Carolina, North Dakota, Pennsylvania, and Rhode Island.

For grade 8 math, all states had standards at or above NAEP Basic. Ten of them reached the NAEP Proficient level—Alaska, Arizona, Illinois, Indiana, Kansas, Massachusetts, Oklahoma, Pennsylvania, Rhode Island, and Wisconsin. The authors also looked at the Smarter Balanced Assessment Consortium states as a whole and found they mapped to NAEP Basic at each grade and subject.

Now for those short-term changes. Since 2019, for reading in both grades, movement was mostly upward (e.g., D.C. and Oklahoma went from Basic to Proficient), but a few states slipped from Basic to below Basic, including Virginia (sigh).

Grade 4 math saw modest upward movement, including Maryland and Colorado, which went up from Basic to Proficient. There was more churn observed in grade 8 math as, for example, Indiana and Oklahoma rose from Basic to Proficient, while Massachusetts and Arizona fell from Proficient to Basic.

What to make of all this? The National Assessment Governing Board, which oversees NAEP administration, sets a high bar for NAEP Proficient at each grade and subject tested. States, of course, are not compelled to set their own standards that high—and, as you can see, most don’t. Reasonable people can debate, and many have, whether NAEP Proficiency is best understood as a college-ready benchmark and, similarly, whether NAEP Basic is the more appropriate target for all students. But the useful takeaway from this crosswalk is not that every state should immediately try to leap to NAEP Proficient (phased approach, anyone?). It is that states can easily compare where their standards sit on a common scale and see how much room there is to keep raising expectations. Here’s hoping the tenth edition shows more states doing just that!

SOURCE: Darrick Shen-Wei Yee and Brian Cramer, “Mapping State Proficiency Standards Onto the NAEP Scales Results From the 2022 NAEP Reading and Mathematics Assessments,” Institute of Education Sciences, National Center for Education Statistics.

Policy Priority:
High Expectations
Topics:
Accountability & Testing
Evidence-Based Learning
Governance
Kendall Rogers
9.17.2026
Clock and money jar
Getty Images/Michail_Petrov-96
Listen to this article
Loading the Elevenlabs Text to Speech AudioNative Player...

The importance of childhood investments to the trajectory of life is commonly accepted, but less is known about the size and sources of disparities in these investments. A recent study in Nature Communications sought to assess differences in childhood human capital investments across different racial and socioeconomic demographics.

To expand the scope of investments across multiple areas of children’s lives, the researchers combine data from ten nationally representative surveys from 2010 to 2023 and convert public spending, private expenditures, and family time into a common dollar scale. The ten domains include informal education, nutrition, housing, formal schooling, health care, exercise, clothing, childcare, transportation, and college prep. For example, time-based investments, such as informal education and transportation, are converted using hourly wages, while expenditure-based investments—food, clothing, housing, childcare, and college preparation—are measured through costs.

The researchers then evaluate trends across socioeconomic quartiles and racial groups and identify three key findings: (1) disparities between groups are substantial but smaller than estimates reported in previous research; (2) the gaps are largest before children enter formal schooling; and (3) those disparities vary by race, ethnicity, and income.

For finding one, the average investment per child from birth to age 18 (counting all public and private spending) is $502,152. Total investments are approximately $86,000 more for children in the top quartile of income compared to the bottom quartile, and between $55,000 and $75,000 more for White families compared to Black and Hispanic families. These racial and socioeconomic investment gaps, which range from 6 percent to 15 percent, are much smaller than found in previous studies.

Investment gaps are widest between birth and age five and converge as children enter formal education. Notably, the investment gap between the highest and lowest socioeconomic quartiles is cut from 24 percent to 12 percent as children transition from early childhood (birth through age four) to older childhood through twelfth grade. Researchers identify that publicly funded investments in K–12 teacher salaries are comparable across groups, which contributes to the investment convergence in tandem with increased support for groups with lower investments during early childhood once they enter K–12 schooling (e.g., tutoring and special education funding).

Finally, investment gaps present differently across various racial and income groups. Because housing is the largest contributor to investment disparities for Hispanic families, the Hispanic-White gap is larger for expenditure-based investments than for parent- and family-time investments. By contrast, because Black children on average receive less family time during meals, the Black-White gap is larger for parent- and family-time investments than for expenditure-based investments. The contributors to disparities across household income are similar to, but not identical to, those across racial groups, further reflecting variability in how disparities present.

Put together, the evidence paints a vivid picture of the investment disparities that exist among children. Through examining a more comprehensive set of investments, researchers more accurately identify which disparities are greatest among groups, and which investments increase or decrease disparities.

In all, this study offers a more comprehensive picture of childhood investments and their disparities. While the gaps are smaller than those found in previous research, they remain significant before children enter formal education. These findings could help policymakers target support more effectively and examine how early investment gaps shape students’ readiness for school.

SOURCE: David Blazar, Michel Boudreaux, Steven Klees, Jennifer King Rice, Marvin Titus, Jiehui Zhao, Disparities in childhood human capital investments in the United States (Nature Communications, 2026).

Policy Priority:
High Expectations
Topics:
Evidence-Based Learning
Governance
Teachers & School Leaders
Jessica Poiner
9.16.2026
Ohio's outcomes dashboards blog image
Getty Images/Khanchit Khirisutchalual
Listen to this article
Loading the Elevenlabs Text to Speech AudioNative Player...

Last month, the Ohio Department of Education and Workforce (DEW) unveiled a pair of brand-new resources that provide a snapshot of education and workforce outcomes for the state’s graduates. The dashboards, which were developed via a partnership among several groups[1], connect three primary data sources: the Education Management Information System (public and private high school graduation records), the National Student Clearinghouse (enrollment and graduation records for two-year, four-year, public and private colleges in Ohio), and state unemployment insurance wage records. Users can examine these data at a variety of levels, including the state, JobsOhio region, district, school, and Career-Technical Planning District (CTPD).

The goal of this effort is to shine a light on real-world results. In a media release, DEW Director Stephen Dackin noted that the dashboards provide a “new level of insight” that can help students and families plan for the future. The data can also support schools in their efforts to identify areas of success and areas for improvement, and empower advocates and researchers to track student outcomes into the workforce.

To get a clearer picture of what these resources offer, let’s take a closer look at each.

Ohio high school outcomes

This dashboard examines post-high school outcomes for the classes of 2018 through 2023. Cohorts are based on students’ expected year of graduation, which is determined by the year they first enter ninth grade. Outcomes include educational attainment, combined education and workforce status, college enrollment and completion, in-state employment, and earnings.[2]

For families deciding where to send their kids to school, this dashboard can be a helpful supplement to district and school report cards. It examines different data than the state’s College, Career, Workforce, and Military Readiness component and provides a clearer picture of real-world outcomes like college degree attainment and wages that complements school-based measures like passing AP exams or doing well on the ACT.

It also offers plenty of information for advocates and policymakers. In fact, here are a few key data points from Ohio’s class of 2018, which has six full years of postsecondary data available: 

  • Six years after graduation, the highest educational attainment for nearly one-third (32 percent) of students was a high school diploma. More than one-fourth (28 percent) earned a bachelor’s degree. Another 4 percent earned an associate degree. The “some college” group—students who enrolled in college at some point after high school—includes those who were still enrolled (just under 6 percent) and those who discontinued their studies without earning a degree (more than 19 percent). The remaining 10 percent dropped out of high school without earning a diploma.

  • Six years after graduation, median annual earnings (in 2024 dollars) for students who obtained an associate degree or higher were nearly $48,000. For students with no college degree, median annual earnings clocked in at just over $31,000.

  • The percent of 2018 high school graduates employed in Ohio declined from 85 percent in 2019 to 77 percent in 2024.

Ohio career technical education outcomes

This dashboard focuses on CTE concentrators, or students who have completed at least two courses in a single CTE program. It examines three primary outcomes: earnings, in-state employment, and college enrollment and attainment. Just like with high school outcomes, the CTE dashboard focuses on graduation cohorts 2018 through 2023. Unlike the high school resource, however, users can’t access statewide or regional data—to examine CTE outcomes, they must select a specific CTPD and a specific CTE program.

It’s important to recognize that drilling down to specific CTPDs and programs can be incredibly helpful for students and families. For example, let’s say Jane is a student who lives in Hamilton County. Her district works with the Great Oaks Career Campuses to provide CTE programming. She’s interested in becoming an automotive service technician, which is part of the Ground Transportation pathway. But Jane’s mom is worried. Will her daughter be able to find work in Ohio? How much money can she expect to make? The CTE outcomes dashboard not only answers those questions, it provides data specifically tied to Great Oaks. The dashboard, for instance, shows that within six years of graduation, 84 percent of Ground Transportation concentrators from Great Oaks were working in Ohio. It also shows that during those six years, wages steadily climbed. Within six years of earning a diploma, median annual earnings clocked in at nearly $42,000. Concentrators in the 75th percentile made over $56,000. Thanks to these data, Jane and her mom can have a productive conversation about her future plans.

Alternatively, consider Joe, who lives in Berea, Ohio. Joe attends the Polaris Career Center, where he’s well on his way to becoming a Certified Nursing Assistant. He’s trying to decide whether he should pursue postsecondary education after graduation (perhaps to become a registered nurse) or stick with his certificate and go straight into the workforce. When he uses the state’s dashboard to pull up the Polaris Career Center and choose Allied Health and Nursing on the dropdown menu, he notices that median earnings are much higher for students who attain at least an associate degree compared to those who don’t. In fact, five years after graduation, those with a degree earn a median wage of $49,865 compared to just $27,071 for those who don’t earn a degree. Six years after graduation, degree-holders earn more than double their peers who don’t have a degree. Armed with these data, Joe will be able to make a much more informed decision about his future.

***

These new dashboards are a welcome addition to Ohio’s transparency efforts. They have the potential to serve a wide range of stakeholders, from district and school leaders looking to build on what works to policymakers eager to make data-driven decisions. Most importantly, though, this effort puts detailed and accurate information straight into the hands of students, who can use it to make informed decisions about their future. Ohio kids and families deserve to be well-informed. These resources help make that happen.


[1] The groups are DEW, the Ohio Department of Job and Family Services, InnovateOhio, and the Ohio Education Research Center at the Ohio State University.

[2] Employment and earnings measures are currently limited to Ohio employers covered by the state’s unemployment insurance program.

Policy Priority:
Standards & Accountability
Topics:
Career & Technical Education
Jeff Murray
9.16.2026
Gadfly Bites logo
Listen to this article
Loading the Elevenlabs Text to Speech AudioNative Player...

News stories featured in Gadfly Bites may require a paid subscription to read in full. You have been warned.

  1. School and district report cards were released yesterday morning. The overall takeaway is that things are generally trending in the right direction—early literacy, math and English test scores, and absenteeism—but Ohio is still some distance away from where we were in 2019…and the climb back remains agonizingly slow. (Cleveland.com, 9/14/26) Fordham’s Aaron Churchill said in a statement, “Policymakers must continue their push for stronger math and reading instruction”, and to improve chronic absenteeism rates. Full statement, with some nice big-picture data tables, is here. (State Affairs, 9/15/26) Aaron was actually interviewed for this Spectrum News coverage, where he went into some more specifics about the big picture data. He noted “slight improvement” on chronic absenteeism rates, but reminds us that “they are still significantly higher than they were prior to the pandemic. Right now about a quarter of students are still chronically absent each year.” He adds that too many students being absent for too many days undermines other academic efforts. “It’s undermining teachers and their ability to teach and stay on track. (Spectrum News 1, Ohio, 9/16/26)
     
  2. Media outlets were also quick to checking in with some notorious underperformers around the state. Lorain City Schools leaders note that academic outcomes there are trending upward—slowly—and they point to excessive absences for a lot of that lag. “Attendance is awful,” says superintendent Jeff Graham. “When our kids do show up for school, great things are happening.” (The Chronicle, 9/14/26) Youngstown City Schools earned 3 stars overall—their highest rating ever—and it sounds like party time up there. The overall success was driven, says superintendent Jeremy Batchelor, by two high flyers (Choffin Career Center and Rayen Early College High School, both buildings at 5 stars) and by a couple of formerly cellar-dwellers (East and Cheney High Schools) which both boosted to 3 stars this year. Batchelor particularly extolled East: “There existed scholars, teachers, administrators, families and community members who continued believing in East when the data told a very different story,” he said. “They refused to let the school determine where it could go. They should be extremely proud of what they accomplished.” (WFMJ-TV, Youngstown, 9/14/26) East Cleveland City Schools, whose improvement efforts we have previously discussed here at Fordham, maintained their 3 star rating again this year. “Maintaining three stars gives us another piece of evidence that the progress can last,” said superintendent Henry Pettiegrew II. “It is confirmation that the district has moved—and a reminder that we must keep moving.” Nice. (Cleveland.com, 9/14/26)

  3. One person not looking on the bright side (IMHO) is reporter Patrick O’Donnell. His new piece in The 74 wants to equate Ohio’s current math instruction improvement efforts to our science of reading implementation efforts circa 2023, when there were strong outside forces talking about “state overreach” and “no consensus” in order to derail the push to eliminate bad curricula, boost teacher skills, and provide individual supports to students, among other things. And while that tussle got settled just exactly the way we all figured it would—my favorite part was when nay-saying veteran teachers reported getting teary-eyed while watching long-struggling students suddenly accelerate their learning—O’Donnell’s coverage of the plan to build a similar structure for math instruction in Ohio is languishing in the old swamp. “The Ohio legislature and Gov. Mike DeWine passed a law this summer that mirrors Ohio’s 2023 law…by requiring schools to better track math skills and give students extra help. The new law also requires elementary school teachers to show they are proficient in math skills before they can teach math.” But, he says, “there is no consensus — both nationally and in Ohio — on how students can best learn math, with ongoing debate nationally between a self-proclaimed science of math movement and more holistic approaches favored by many educators.” To which I say: Just like the SoR nay-sayers that are still out there willing to give the same “no consensus/overreach” quotes about literacy education to any sympathetic reporter who calls in 2026 as they gave in 2023, these math deniers will still be saying the same things on the record long after Ohio has moved onward and upward in math despite their insistence without their assistance. (The 74, 9/15/26)

Did you know you can have every edition of Gadfly Bites sent directly to your Inbox? Subscribe by clicking here.

Policy Priority:
School Funding
Topics:
Governance
Ohio Education Gadfly
9.15.2026
Media alerts stock image
Getty Images/almir1968
Listen to this article
Loading the Elevenlabs Text to Speech AudioNative Player...

Today, the Ohio Department of Education and Workforce released school report cards for the 2025–26 school year. Data include state math and reading exam results as well as high school graduation and chronic absenteeism rates. They also feature star ratings that summarize schools’ performance through an “overall” rating and six “component” ratings. 

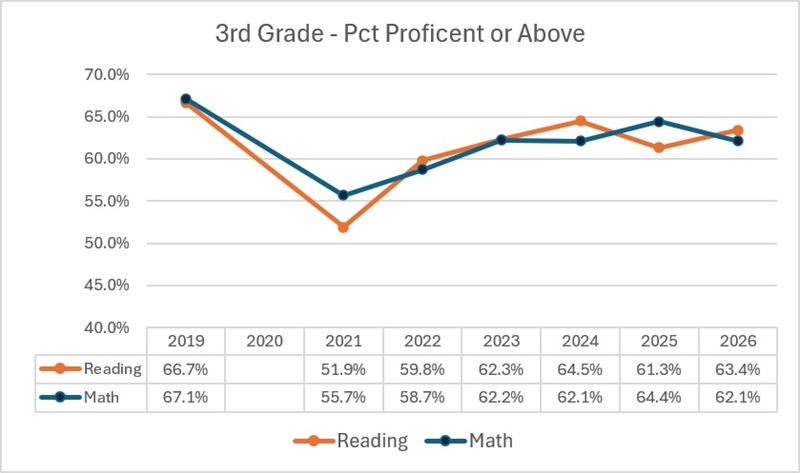
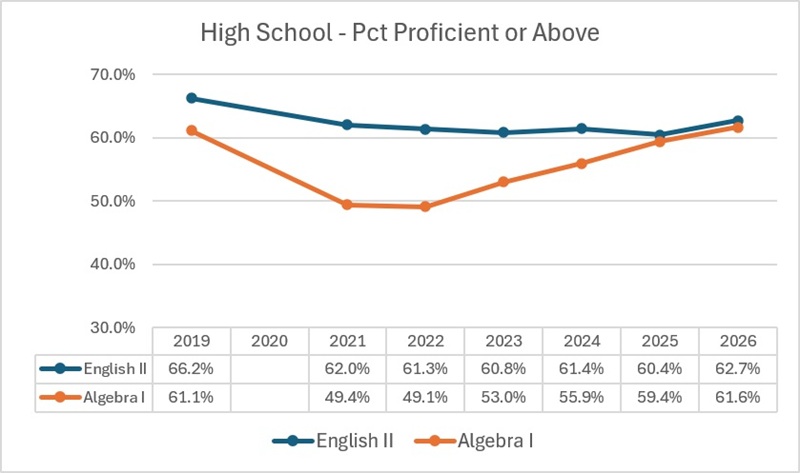
“The state’s report card has long provided a vital checkup on the academic progress of Ohio students,” said Aaron Churchill, Ohio Research Director at the Thomas B. Fordham Institute. “This year’s edition reveals encouraging signs of academic improvement, particularly in third grade reading and high school algebra I. But with proficiency rates still generally lagging pre-pandemic marks, state policymakers must continue their push for stronger math and reading instruction.”

The figures below display statewide proficiency rates in selected grades and subjects, with 2018–19 scores (pre-pandemic) shown as the baseline. In three of the four grade-subject combinations, proficiency rates in 2025–26 fell below pre-pandemic marks, with only algebra I proficiency exceeding it.

Figure 1

Figure 2

Note: 2019-20 data are omitted due to the test cancelations.

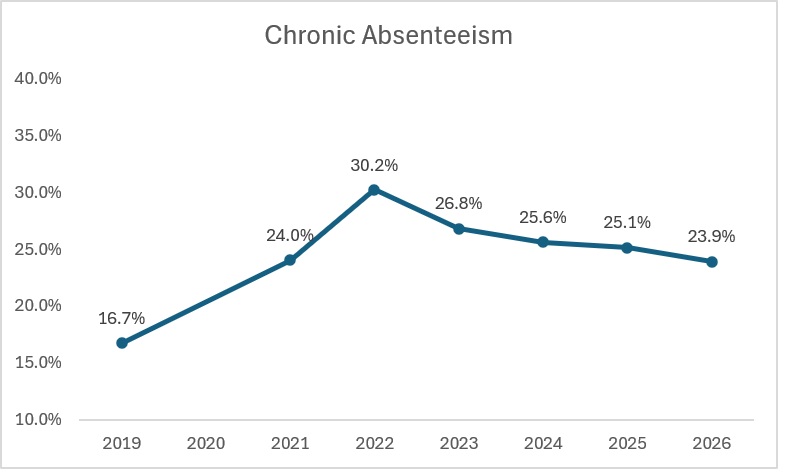
Another closely-watched indicator is chronic absenteeism—defined as missing more than 10 percent of the school year for any reason. The chart below shows that the percentage of chronically absent students continued to decline from the pandemic-era high of 30 percent in 2021–22. Nevertheless, absenteeism remained stubbornly high compared to pre-pandemic levels and still exceeded 50 percent in nine school districts during 2025–26 (Cleveland, Columbus, Lorain, and Youngstown among them).

Figure 3

“Widespread absenteeism continues to undermine academic improvement, particularly in Ohio’s highest-need communities,” continued Churchill. “While state policymakers have touted the importance of attendance, it’s time for Ohio to take a stronger stand against chronic absenteeism. At its current rate of improvement, Ohio will return to pre-pandemic chronic absenteeism rates sometime during the 2030s. That is unacceptable. State policymakers must take more aggressive steps, including a stronger report-card mechanism, to ensure daily attendance.”

Policy Priority:
Media Statements
Topics:
Accountability & Testing
Jeff Murray
9.14.2026
Gadfly Bites logo
Listen to this article
Loading the Elevenlabs Text to Speech AudioNative Player...

News stories featured in Gadfly Bites may require a paid subscription to read in full. You have been warned.

  1. Lots of schools and districts out there are apparently bracing for lower report card scores when data are officially released tomorrow. (They have seen preliminary info already) This coverage, featuring comments from our report card guru Aaron Churchill, focuses specifically on changes made to the Early Literacy Component which the state teachers union believes will serve to lower many a grade. And, since we learn that the change is from reporting “the percentage of students who were promoted from third to fourth grade” to reporting “only those who were actually eligible for promotion based on reading scores — excluding students who advanced despite not meeting proficiency”, you can see how that might change the calculus…for what some of us might call “the better”. (Cleveland.com, 9/14/26)

  2. As we discussed last week, a number of charter and district schools will receive report cards with asterisks on some test-based data due to “anomalies” in their state test results, as determined by an Ohio Department of Education and Workforce review. Among these are all six of Steubenville City Schools’ buildings. You remember Steubenville, the small district in an impoverished part of the state that became an all-consuming cause célèbre of the national science of reading movement for its success in teaching its young students to read using old-school methods, tenacity, and common sense. Substacker Tim Daly is first out of the gate to use the “c word” in relation to Steubenville’s version of those anomalies—and then 2,000 more words to explain what the “c word” will mean to all of the Steubenville watchers worldwide if cheating is actually alleged…let alone proven. (Tim Daly Substack, 9/14/26) Even though we’re a long way from understanding what happened and how—not to mention what official repercussions might eventuate—just getting one’s name on the “anomalies” list for further investigation is already generating blowback. Another case in point: Focus Learning Academy here in Columbus. The Dispatch today rehashes a closed criminal case against one of the charter school’s leaders and points out that he is still at the helm despite his guilty plea and criminal conviction. The school’s sponsor is not breaking any laws by keeping him on, a spokesman says, explaining that the school is running pretty well these days and thus no leadership changes are currently under discussion. However, the piece also points out that Focus is now on DEW’s testing “anomalies” list, which could possibly change the calculus for the school’s governing authority. (Columbus Dispatch, 9/14/26)

  3. Speaking of charter schools, here is that list of federal CSP grant funding awardees we were talking about last week. Congratulations to all the winners! (Dayton 24/7 Now News, 9/11/26) Here’s a quick look at the two awardees in northeast Ohio: FORWARD Girls Leadership Academy and Menlo Park Academy. Nice! (Signal Cleveland, 9/14/26)

Did you know you can have every edition of Gadfly Bites sent directly to your Inbox? Subscribe by clicking here.

Policy Priority:
School Funding
Topics:
Governance
Jeff Murray
9.11.2026
Ohio charter news logo
Listen to this article
Loading the Elevenlabs Text to Speech AudioNative Player...

Stories featured in Ohio Charter News Weekly may require a paid subscription to read in full.

News about news

The Ohio Department of Education and Workforce (DEW) will soon be announcing the winners of $105 million in grant funding from the federal Charter Schools Program (CSP). As this coverage from Cleveland.com relates, 22 applicants were vying for funds in two categories: existing high-quality schools looking to expand, and schools looking to open new high-quality models in the state. Hopefully we’ll know all the winners next week.

Help for virtual charters in North Carolina

The North Carolina Association for Public Charter Schools has contracted with Safal Partners on a wide-ranging project to improve the quality of virtual charter schools in the state. They will create a document explaining state charter law “in plain terms” to help school operators understand and follow it, a new rubric for schools and outside reviewers to judge their quality, and a plan to help the state’s Charter Schools Review Board monitor the virtual schools over the next two years. The project is funded through a federal CSP grant.

Following up on last week’s news

As we noted last week, DEW is conducting an investigation of state testing anomalies in 52 schools—including 39 charters—across Ohio. While it’s too soon to say what they might find, the Fordham Institute’s Aaron Churchill sums up the importance of the effort: “The integrity of state assessments, they matter to the public, they matter to parents. We cannot be giving dishonest information to the public.” Meanwhile, DEW is still on schedule to issue school and district report cards next week, although those schools under investigation will have asterisks on their test-related data.

School choice landscape in Cleveland

Kudos to Signal Cleveland for this detailed piece charting the expanding/changing public school options in and around the city. These include the new academic offerings in consolidated CMSD schools, the coordinated effort from organizations like Future Ready Cleveland to bring new and innovative charter schools to the area, and even the presence of independent STEM school Bio-Med Science Academy. Lots of helpful information for families.

Speedbumps on the school choice landscape

While the school choice landscape all across Ohio is evolving, student transportation remains firmly stuck in the 20th century. You can take Larry Fravel’s word for it. Fravel is a third-generation bus driver in rural Licking Heights Local Schools. He explains that he drives for the same reason his grandfather and parents did: It’s a great side gig for farmers (like his family elders), ministers, and stay-at-home mothers, giving them flexibility to drive in the mornings and evenings while working another job in the middle of the day. However, there are fewer and fewer folks who actually want such a schedule today. Thus, bus driver shortages abound because the job hasn’t adapted to this reality. All of this spells ongoing trouble for families opting for non-district choices and indeed for district resident families too, it seems, judging by the news so far this year.

*****

Did you know you can have every edition of the Ohio Charter News Weekly sent directly to your Inbox? Subscribe by clicking here.

Policy Priority:
School Choice
Topics:
Charter Schools

Pagination

  • First page « First
  • Previous page ‹ Previous
  • Page 7
  • Page 8
  • Page 9
  • Page 10
  • Current page 11
  • Page 12
  • Page 13
  • Page 14
  • Page 15
  • Next page Next ›
  • Last page Last »
Fordham Logo

© 2026 The Thomas B. Fordham Institute
Privacy Policy
Usage Agreement

National

P.O. Box 110
Burke, VA 22009

202.223.5452

[email protected]

Ohio

P.O. Box 82291
Columbus, OH 43202

614.223.1580

[email protected]

Sponsorship

130 West Second Street, Suite 410
Dayton, Ohio 45402

937.227.3368

[email protected]