Mobile Navigation

  • National
    • Policy
      • High Expectations
      • Quality Choices
      • Personalized Pathways
    • Research
    • Commentary
      • Gadfly Newsletter
      • Flypaper Blog
    • Events
    • Scholars Program
  • Ohio
    • Policy
      • Priorities
      • Media & Testimony
    • Research
    • Commentary
      • Ohio Education Gadfly Biweekly
      • Ohio Gadfly Daily
  • Charter Authorizing
    • Application
    • Sponsored Schools
    • Resources
  • About
    • Mission
    • Board
    • Staff
    • Career
Home
Home
Advancing Educational Excellence

Main Navigation

  • National
  • Ohio
  • Charter Authorizing
  • About

The Education Gadfly
6.5.2026
Gadfly Guy
Listen to this article
Loading the Elevenlabs Text to Speech AudioNative Player...

CHEERS

Leadership Preparatory Charter School, a K–8 school in Memphis, partnered with Teach Like a Champion to create an adapted math program that better served students struggling post-pandemic. Valissia Allen, the school’s founder, calls the arrangement “teacher autonomy with guardrails,” with teachers following the state-approved curriculum but gaining flexibility in how to deliver materials in their classrooms. Bri Hatch reports on the school’s success, where “nearly 44 percent of students scored as proficient on state standardized math tests—up over 20 percentage points from 2021.” Across the city, charter school students are recovering faster than their traditional district school peers, surpassing pre-pandemic levels last year.

JEERS

“The City of Cleveland is asking developers and other organizations to propose plans for a dozen buildings the school district is shuttering at the end of this month,” reports Franziska Wild for Signal Cleveland. This despite the law requiring that former schools be offered to charter schools that need the space.

—

Jason Gonzales reports on what went wrong with an apprenticeship program in Colorado and why it’s so hard to make such programs work. “Ten years in, CareerWise offers an important case study in the challenges of offering robust on-the-job training for high school students,” he writes. It’s “an idea that has widespread bipartisan support and increasing investment from the public and private sectors but can be difficult to execute on a large scale.” Hurdles include hesitation from parents, competition from other opportunities, and unstable business participation.

—

New York Governor Kathy Hochul caved to union pressure on pensions, lowering both the retirement age for teachers and their required contributions. The Washington Post‘s Editorial Board points out that the estimated $557 million in additional annual costs stemming from the deal leaves state and local governments paying for the priorities of special interests, money that could otherwise be used to support kids.


Editor's note: This was first published on Mike Petrilli's Substack, SCHOOLED, a twice-weekly free Substack and email newsletter restarting the education-reform conversation.

Click here to subscribe for:

  • Sharp analysis of the week’s biggest K–12 debates

  • Curated commentary from across the ed-policy world

  • Lively discussion—including reader reactions and pushback

Chester E. Finn, Jr.
6.4.2026
Child on a windy day
Getty Images/Tatiana Foxy
Listen to this article
Loading the Elevenlabs Text to Speech AudioNative Player...

Let me acknowledge up front that I may be grasping at straws or (to shift analogies for the second time) forgetting the ancient maxim that sighting one or two swallows doesn’t necessarily mean summer has arrived.

But recent weeks have brought a few encouraging signs that the decades-long effort to kill academic standards in the name of equity has wreaked enough havoc and that something of a counter-movement can be glimpsed.

Most recently, hundreds of University of California faculty, mostly math professors, have pleaded with the administration to bring back SAT-ACT testing requirements, at least for applicants to STEM fields within the UC system. This in the wake of a UC-San Diego report that sizable numbers of first-year students can’t handle even middle-school math.

Just days earlier, the Harvard faculty took a small step toward curing grade inflation by placing a limit on the percentage of straight A’s that can be conferred in undergraduate courses, starting in 2027. (But note that there’s no cap on A-minuses.)

A few weeks before that, Yale’s “Committee on Trust in Higher Education” came forth with a thoughtful discussion of faltering public faith in U.S. higher education, citing many reasons. These include:

Colleges and universities cannot expect the public to trust or value the classroom if they do not fully value it themselves…. Over the past several decades, grading across many institutions has steadily lost its meaning. In 1963, 10 percent of grades in Yale College were an A or A-. In 2022–23, that number was seventy-nine percent. Today, the median student at Yale receives an A. Peer institutions are similar.

The committee went on to include (among many recommendations) several thoughtful moves to arrest and reverse grade inflation, including “that the Yale University Registrar compute course percentiles, or devise a similar mechanism that reflects the context for each grade, and include them on transcripts.”

At the K–12 level, the latest Harvard-Stanford “Education Scorecard” reported bleak achievement results pretty much across the board. As Tom Kane explained in introducing it, “The pandemic was the mudslide that followed seven years of erosion in student achievement. The ‘learning recession’ started a decade ago, after policymakers switched off the early warning system of test-based accountability and social media took over children’s lives.”

And as the New York Times summarized it:

Almost everywhere in America, students are performing worse than their peers were 10 years ago, according to new, district-level test score data released Wednesday by the Educational Opportunity Project at Stanford. Compared with a decade earlier, reading scores were down last year in 83 percent of school districts where data was available. Math scores were down in 70 percent. The declines have affected both rich and poor districts, and crossed racial and geographic divides.

True, we’ve had plenty of “Sputnik moments” before. And we’ve learned—sadly—that, in and of themselves, they don’t foreshadow a renaissance in academic standards and accountability. This kind of publicity does, however, at least signal widening awareness of the cost of their erosion.

Turning awareness into action requires sustained high-level leadership, such as once came from presidents, Congressional leaders, governors, business executives, and more. That’s hard to find nowadays, particularly in Washington, where I doubt we’ll see it again for many moons. (It should be noted, though, that Rahm Emanuel has been terrific on this issue, for whatever that may turn out to be worth.)

Hence the states will remain the center of action—or inaction. That’s why it matters that NAEP’s governing board recently moved to beef up 12th grade assessments and the reporting of state-level results in core subjects, particular end-of-high-school results. Yes, viewed in isolation, this just means more data. But it has the potential to jar—and equip—state leaders into taking action to strengthen their expectations from kindergarten readiness all the way through high school graduation. Whether they will we cannot know.

States (and districts) can combat grade inflation and standards-lowering in many ways. Legislators could mandate admissions tests—even minimum scores—for state colleges and universities. They could ensure that student scores on state achievement tests are sent—in timely fashion—to parents in forms they can comprehend. School report cards, too, can be made far more transparent and accessible than most are today. Teacher preparation and certification requirements can include obligatory training in assessment and grading. As at Harvard, schools could be limited in the percentage of A-range grades they can award, and (at least in high school) the difficulty of various courses can be factored in. “Credit recovery”—if done at all—can be made rigorous and third-grade “reading guarantees” can come with teeth.

There’s more. But it takes guts and sustained leadership, which calls for leaders who sustain a push for excellence and to defy mediocrity. We know it makes a difference when they do: Consider the gains of the past decade in Tennessee, Louisiana, and Mississippi, rivaling what we once called the “Massachusetts miracle.” But we also know—Massachusetts, sadly, is now the most visible evidence for this—that without sustained reformist leadership and political oomph, the forces of resistance end up prevailing.

That’s too depressing a note on which to end, so allow me, instead, at least to grasp at a few hopeful straws!

Policy Priority:
High Expectations
Topics:
Governance
Standards
Teachers & School Leaders
Cece Zhou Kathleen Castillo-Clark
6.4.2026
Teacher and students
Getty Images/Rawpixel
Listen to this article
Loading the Elevenlabs Text to Speech AudioNative Player...

For the last several years, as more than 40 states have invested in evidence-based literacy instruction, national attention has understandably focused on the K–12 implementation efforts that have the most direct impacts on students, including widely discussed change efforts like that in Mississippi.

Yet as these efforts have gained steam, a gap has become increasingly noticeable: Beginning teachers who are entering classrooms for the first time are often unprepared for the literacy practices that districts and schools are trying to roll out.

As a result, districts that have made the shift to structured literacy continue to devote time and energy year after year to retraining incoming teachers. In the many communities where this is happening, teacher preparation (with the exception of state licensure and standards) has not been a primary lever in early change efforts, and as a result, districts, new teachers, and their K–12 students are carrying that burden.

As states and districts have moved to improve literacy outcomes at scale, many are recognizing the importance of ensuring educator-preparation programs (EPPs) are supported to be in stronger alignment with broader efforts. Without that alignment, instructional improvement is difficult and costly to sustain.

The Fordham Institute’s recent survey of K–3 teachers (and a forthcoming Teacher Prep Review from the National Council on Teacher Quality) provide valuable insight into the variability of implementation. These data understandably raise questions about whether EPPs are changing quickly enough. We invite consideration of a different angle: What do these data reveal about how effectively states and systems are investing in preparation?

Improving preservice reading instruction is not like pressing a button. EPPs sit at the intersection of coursework, field experiences, faculty expertise, district partnerships, funding, and workforce needs. Preparation changes when all these elements move in alignment together. And because reading instruction is inherently complex, changing one or two courses isn’t enough. Candidates need repeated, scaffolded opportunities to practice with the materials, routines, and structures they’ll experience in classrooms with feedback. Faculty need time and support to deepen their own understanding of evidence-based reading instruction. And district partners need to help ensure that clinical experiences reinforce what candidates learn in coursework.

For many outside of educator preparation, the complexity of this work is easy to underestimate. But increasingly, systems are taking note and carving out the time to learn what’s needed. From our work on the ground with 300 teacher-preparation programs, we’ve seen strong examples of meaningful EPP shifts. Below, we highlight three different examples of how state and local systems are bringing preparation more intentionally into literacy change efforts.

Tennessee: Local initiative within state policy change efforts

In Tennessee, the state’s Literacy Success Act (2021) and related legislation ushered in large-scale changes that set clearer expectations for reading instruction. Carson-Newman University, which serves a largely rural community and has built strong, long-standing relationships with local school districts, made the connection to implications for preparing candidates. As these districts gained access to new high-quality instructional materials (HQIM) and literacy training through broader state policy investments, Carson-Newman faculty saw the mismatch between what the new expectations were in classrooms and how candidates were being prepared.

Like many EPPs, its faculty did not automatically have access to the same materials districts were using, even though research continues to show how important curriculum alignment is for teacher learning and implementation. But with support from Deans for Impact (DFI), they worked closely with district partners to source the same HQIM that schools were using and redesign literacy coursework to better connect preparation with clinical experiences. They also asked candidates in clinical experiences to identify opportunities to better align their preparation with the realities of classrooms.

Carson-Newman’s efforts show what’s possible when EPPs take initiative, even without dedicated policy support. The charge for policymakers is to make that alignment happen by design and at scale, and not leave it to chance.

Texas: Statewide infrastructure bridging K–12 and teacher preparation

In Texas, Reading Academies have served as an emerging pillar of the state’s approach to ground reading instruction in evidence-based practices—first in K–12 and now increasingly in educator preparation. This large, state-wide effort, bolstered by a historic $8.5 billion investment in public education through last year’s passage of HB2, has helped establish clear expectations for both K–12 districts and EPPs.

But even with state infrastructure, implementation looks different from one community to another. In Houston, a large and complex teacher-labor market includes many different school districts and EPPs working to align expectations across different partnerships, processes, and pathways into teaching. In El Paso, on the other side of the state, where one EPP prepares approximately 70 percent of the teacher workforce, changes can roll out in more coordinated ways—though, even there, leaders have described implementation as a significant lift across capacity, buy-in, and content integration.

The Texas Education Agency has created opportunities for EPPs across the state to provide feedback on the content and rollout of the academies. The scale of this effort highlights that while state policy can guide direction, implementation support still needs to be adaptive and responsive to local contexts for change to be successful.

New York City: Cross-sector partnership from design to implementation

We’re seeing a more ground-up approach in New York City. While the state of New York has not mandated shifts in teacher preparation, the Literacy Academy Collective has mobilized change through fostering cross-sector coordination and collaboration. Through the New York Path Forward initiative supported by the New York State Department of Education, districts, EPPs, and technical assistance providers, including DFI, are working together on implementation and alignment.

EPPs like those across the CUNY system and Touro University have engaged early in the process to build coherence, problem-solve, and share learnings from their pilots to redesign courses with their K–12 counterparts. Importantly, these efforts are being treated as continuous learning and improvement efforts, not one-time implementation changes. As New York considers how to strengthen literacy preparation statewide, this local initiative is a strong proof point for the type of infrastructure and support that can effectively support EPPs to integrate evidence-based reading instruction into preparation.

These EPPs, and many others that DFI has supported to embed evidence-based literacy instruction in preparation, challenge the common misconception that EPPs are resistant or slow to change. The reality is much more nuanced: Meaningful instructional change requires coordination across many interrelated parts of the system—particular teacher preparation and K–12—that have historically not been designed to work cohesively together. The depth, scale, pace, and long-term success of that change depend significantly on leadership, policy, and implementation support. Different investments result in wide variability from state to state, EPP to EPP, and as a result, classroom to classroom.

We are grateful for reports like Fordham’s that continue to raise important questions about the role of preparation. And if we want to see lasting improvement, the conversation must move beyond “How quickly can we get EPPs to change?” to “How can states and systems help EPPs to change successfully?”

Policy Priority:
High Expectations
Topics:
Evidence-Based Learning
Curriculum & Instruction
Teachers & School Leaders
Julia Hayes
6.4.2026
Bored student
Getty Images/MachineHeadz
Listen to this article
Loading the Elevenlabs Text to Speech AudioNative Player...

It’s much disputed in England whether grouping students by achievement level or mixing them together is a more effective strategy for teaching in secondary schools. This practice resembles achievement grouping in the U.S., particularly when done in specific subjects like math.

In a new study, researchers from several UK universities evaluated these two student grouping practices in mathematics. The sample included year 7 and year 8 (aged 11–13) students in non-selective state secondary schools in England, along with subgroup analyses for marginalized students and those with low prior achievement in mathematics. The evaluators recruited two groups of schools based on their usual approaches to grouping students for math lessons. Using a quasi-experimental design, the two groups were matched to ensure they were as similar as possible across key characteristics before comparing outcomes.

The researchers had three primary objectives: examining the effects of grouping practices on mathematics achievement, students’ self-confidence, and classroom teaching practices.

Several findings emerged. Most important is the statistically significant finding that high-achieving students in schools using heterogeneous grouping made, on average, two months less progress in mathematics compared to students in schools that grouped students by current achievement levels. Overall, students taught in mixed groups made an estimated one month less progress in mathematics than those in more homogenous groups. (This difference, however, was not statistically significant.)

Nor did analysts find consequential differences in progress associated with grouping practices for socio-economically disadvantaged students or those with low prior achievement. Some evidence suggests a narrowing of the achievement gap in mathematics between low- and high-achieving students in the heterogeneous-grouping schools, but this appeared to be driven largely by lesser progress among higher achievers rather than greater progress among low achievers. In other words, the gap was reduced by lowering the ceiling, not raising the floor.  

Mixed grouping in mathematics also had negative effects on students’ self-confidence in mathematics, particularly for socio-economically disadvantaged students and low prior achievers. Within the case study schools, mixed-achievement mathematics lessons generally had a slower pace than that seen in higher-achieving groupings. And the researchers found that enrichment opportunities for higher achievers were limited and were often disconnected from the lesson content and rarely incorporated into class discussions.

Overall, the findings suggest that mixed-achievement grouping in secondary mathematics, where students of different prior achievement levels learn together, reduces progress for high-achieving students, has no impact on outcomes for their marginalized or lower-achieving peers, and negatively affects students’ self-confidence in the subject.

SOURCE: Jeremy Hodgen, Becky Taylor, Antonina Tereshchenko, Jake Anders, Laurie Jacques, Maria Cockerill, Rosa Kwok, David Sirl, Hester Burn, Nicola Bretscher, “The Student Grouping Study,” UCL Institute of Education (April 2026).

Policy Priority:
High Expectations
Topics:
Evidence-Based Learning
Curriculum & Instruction
Governance
Advanced Education
Teachers & School Leaders
Aaron Churchill
6.3.2026
State share of funding blog image
Getty Images/Istoma
Listen to this article
Loading the Elevenlabs Text to Speech AudioNative Player...

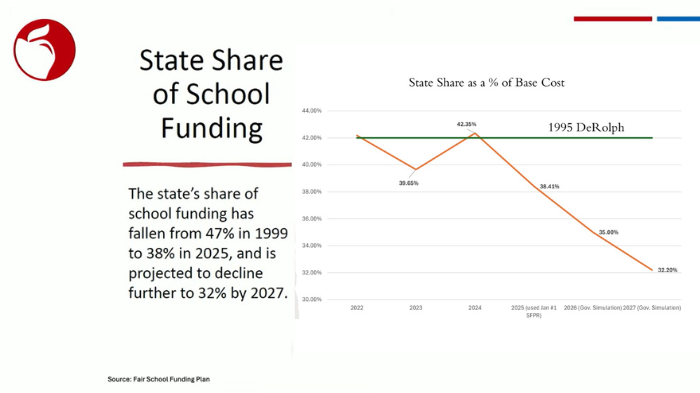
At the May school board meeting, Columbus City Schools’ treasurer Ryan Cook made an impassioned argument that the State of Ohio has “disinvested” in public education. After cataloguing all the evils inflicted by legislators onto public schools, including (heaven forbid) reducing state taxes and expanding educational choice, Cook showed a slide that he seemed to believe was the coup de grâce. “I think this is just a powerful chart... This chart here clearly shows that legislative disinvestment has led to where we’re at this evening [discussing budget cuts]. The consequences are sobering.” he said.

State share of funding blog figure 1

Never mind that Columbus is among the most lavishly funded districts in Ohio (it spends more than $25,000 per year), that its state per-pupil revenues have steadily risen, and that its budget woes are largely related to downsizing after receiving hundreds of millions in temporary, Covid-era federal funds. Forget those pesky facts and fixate only on the falling “state share” displayed on this chart.

Cook is not alone in pointing to a plummeting state share as evidence of “disinvestment.” Molly Bryden of the Policy Matters Ohio claimed: “By the end of the 2026–27 school year, the state's portion of school funding will fall to 32 percent, the lowest state share since long before the 1997 DeRolph decision.” Jim Betts, a longtime school funding advocate, also noted a declining state share (referencing 32 percent as well) in a recent Dayton Daily News story with a sensational headline declaring a “funding crisis.”

In a prior piece, I have challenged the prevailing sky-is-falling narrative about overall school funding amounts. But are the critics right to decry a declining “state share”? Or is their argument full of bologna?  

The right understanding of the “state share” of school funding

Before scrutinizing their numbers, let’s review some basics. Funding public schools has long been a joint responsibility of the state and local districts.[1] Using taxes collected from Ohioans, state lawmakers allocate about $8 billion in state aid to districts via the school funding formula. This formula directs progressively more dollars to districts with smaller tax bases or those serving more low-income and special-needs pupils. On top of this formula aid, the state also provides districts with “guarantee” subsidies ($570 million this year), property tax rollback reimbursements ($1.2 billion), and casino revenues ($110 million), and a few other small funding streams.

In addition, state law also requires districts to levy a minimum 20 mill, or 2 percent, local property tax. Though not officially counted as “state funding,” this state-required tax generates billions for districts. This “indirect” form of state aid is also considered part of Ohio’s overall foundation funding system. Combined with the “direct” formula funding, the 20 mills ensure all Ohio students receive adequate baseline resources for their education. Furthermore, districts may—with voter approval—assess property taxes above the 20 mills and/or an income tax, thus further supplementing their revenues.

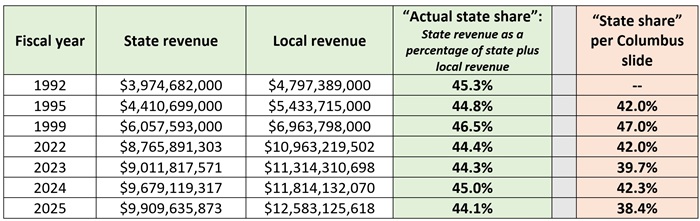
What does this all amount to? Table 1 shows the state and local revenues for Ohio’s traditional districts, as well as the resulting portion of funds directly provided by the state (the “actual state share”). During the DeRolph era,[2] a point of reference in the Columbus presentation, the state contributed 45 to 47 percent of school funding. The actual state share remains roughly the same today: between 44 and 45 percent over the past four years. During this time span (1992 to 2025), state-only per-pupil funding rose by 33 percent above the inflation rate, or nearly 1 percent each year, indicating strong and increasing state investment in public education.

Table 1: State revenue as a percentage of state and local funding, Ohio districts

State share of funding blog table 1
Notes: The 2022 to 2025 funding totals are for traditional districts only (excluding public charter schools, JVSDs, and private school scholarship funding) and were calculated based on Ohio Department of Education and Workforce data reported in the “Expenditure Rankings” files. The DeRolph era data (1992, 1995, 1999) are from the National Center for Education Statistics (it reports rounded numbers) and reflect public school funding before any substantial public charter and private school scholarship enrollment (the first charters opened in 1999 and the Cleveland Scholarship began in 1997). Historical revenue data are not inflation-adjusted, as the table focuses on the proportion of state to local funds, not funding levels. However, adjusted for inflation (CPI), state revenues for districts have grown from $5,094 per pupil in 1992 to $6,764 per pupil in 2025—up 33 percent or almost 1 percent annually above the inflation rate.

The numbers trick: Focusing on the “state share percentage”

As Table 1 indicates, the state shares of funding that I calculate are noticeably higher for 2022–2025 than what the Columbus slide displays. They also sit well above the 32 percent “state share” predicted for 2027. In fact, given the modest upticks in districts’ state revenues expected for 2026 and 2027, local revenues would need to swell to an impossible $22 billion by next year to sink the actual state share of funding to 32 percent.

What gives?

In a sleight of hand, critics are not citing the actual portion of funding provided by the state. They instead refer to the “state share percentage” (SSP), an obscure (albeit important) mechanism buried deep inside the school funding formula.

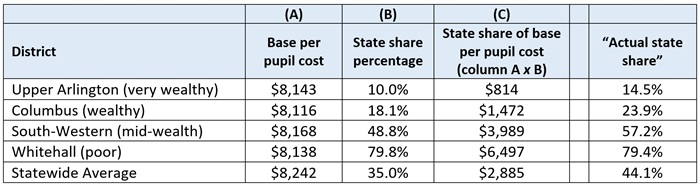
As a quick primer, the SSP ensures low-wealth districts—those with lower property values and resident incomes—receive more state aid, and vice-versa for higher-wealth districts. Table 2 illustrates how it works, using 2026 data from four Franklin County districts. Because Whitehall has less local wealth, the SSP drives more core formula aid to this district ($6,497 per pupil) than to the über-rich Upper Arlington. Whitehall also receives more core state aid than Columbus, which is property-wealthy, even though it serves primarily low-income students who generate additional state aid through a separate weighted-funding element not reflected in this table. We also see the statewide average SSP (35 percent), which matches the number presented on the Columbus slide for 2026 and confirms that the treasurer was in fact presenting SSP numbers.[3]

Table 2: Illustration of how the SSP works to yield base per pupil state aid

State share of funding blog table 2
Source: Ohio Department of Education and Workforce, Traditional District Payment Reports (May 2026). Note: The actual state shares of revenue are based on FY25 data, the most recent available.

It is true that SSPs have generally declined in recent years, as property values and resident incomes have systematically risen across Ohio. But the SSP isn’t the final word on state funding. While the SSP is used to calculate the main formula elements,[4] it is not applied in two important formula components: disadvantaged pupil impact aid and targeted assistance, which provide more than $1.7 billion this year to districts. Moreover, the state distributes nearly $2 billion to districts entirely outside of the formula itself, including guarantees—funds layered onto formula aid[5]—as well as property tax reimbursements and casino revenues. These are all substantial sources of state revenues for districts but not accounted for when the SSP is the sole data point. 

In sum, focusing only on the SSP creates the illusion of “disinvestment,” even though the true state portion of funding has remained relatively stable. As Table 1 indicates, the statewide SSPs (red column) have fallen behind the actual state share of funding over the past four years (green column). And in most districts, this is also the case. In 2025, 485 districts, or about four in five, had lower SSPs than their actual state share of funding. But the SSPs are not an accurate or complete presentation of the state’s total contribution to public school funding.

Topping it off with a faulty analogy

What does this mean for normal human beings? One implication put forward by critics is that a declining state share automatically translates to higher local taxes. Coming full circle to the Columbus treasurer’s presentation, he offered this analogy: “Think of it like a teeter-totter, when the state share decreases, the local residential tax base picks up the high end of that. The formula shifts.”

The teeter-totter analogy is nonsense. When the “state share” declines—whether referring to the SSP or the actual state share—there is not a mechanical, compensatory increase in districts’ local revenues (and residents’ local tax liabilities). How do property taxes rise? It’s due either to an increase in property values, which occurs through county reassessments, or an increase in the tax rate, which happens via ballot measure. Neither factor—reassessment or election results—has anything to do with the school funding formula. The formula takes into account districts’ local wealth to ensure an equitable distribution of state funds, but it does not dictate a local tax rate (beyond 20 mills) or property valuations.

A better image of state and local funding is two escalators, both heading upwards. Historically, both have risen at about the same rate, though there may be years when one moves slightly faster than the other. While that might somewhat alter the state-local mix, the larger fact remains that citizens provide public schools with steadily increasing funding through both state and local taxes. Unfortunately, the generosity and investment of Ohioans in public education is entirely glossed over in the flawed teeter-totter analogy.

***

Public schools and their allies are within their rights to petition state lawmakers and local citizens for additional funding. Pressing for more money because they believe it can benefit students is fair game. But, while it may score short-term political points, conjuring up disingenuous narratives is unlikely to build the lasting trust needed to continue growing public school funding in the years ahead.


[1] Federal funds and nontax revenues, which represent roughly 10 to 15 percent of all school funds, are excluded from my analyses and the analysis of those accusing the state of “disinvestment.”

[2] DeRolph was first filed in the county courts in December 1991 (during fiscal year 1992). The other DeRolph era years shown in Table 1 mirror those presented on the Columbus slide.

[3] The chart also refers to the “state share as a % of base cost,” which is a reference to the use of the SSP to determine the base per-pupil formula funding.

[4] The SSP is applied to the core base per-pupil element (calculations illustrated in Table 2), as well as weighted per-pupil funding for special-education, English learner, gifted, and career-tech students.

[5] Though not a desirable mechanism, guarantees blunt the impact of a declining SSP by boosting the total state funding a district receives relative to the formula prescription. While a much larger topic, state policymakers could redesign the SSP in a way that guards against systemic declines in the face of widespread inflation and potentially avoid such large-scale uses of guarantees.

Policy Priority:
School Funding
Topics:
School Finance
Jeff Murray
6.3.2026
Gadfly Bites logo
Listen to this article
Loading the Elevenlabs Text to Speech AudioNative Player...

News stories featured in Gadfly Bites may require a paid subscription to read in full. You have been warned.

  1. I don’t know how your summer concert plans are shaping up, but here’s something fun you might consider: Ohio’s EdChoice haters are going on tour! Honesty for Ohio Education’s got a new Voucher Accountability Project (VAP) underway which, as we learn from Laura Hancock, is going to host townhall meetings throughout the state starting soon. While the organization says the main point of these events is to explain how money spent on Ohio vouchers “hits” public schools, Hancock herself helpfully includes all the other justifications Cleveland.com has published to hate vouchers over time. Just to make sure their readers know how hateable they are even if they can’t make any of the tour stops. (Cleveland.com, 6/2/26) I assume this dude will be front and center in the mosh pit of fibs and exaggerations (as he is in this op-ed) for some these gigs. Or maybe manning the merch booth. (Ohio Capital Journal, 6/2/26)

Did you know you can have every edition of Gadfly Bites sent directly to your Inbox? Subscribe by clicking here.

Policy Priority:
School Funding
Topics:
Governance
Jonathan Plucker Alicia Anderson Matthew Makel Shaun M. Dougherty
6.3.2026
Shaking a piggy bank
Getty Images/triocean
Listen to this article
Loading the Elevenlabs Text to Speech AudioNative Player...

For every dollar states spend on K–12 education, less than half a penny is earmarked for advanced learning. This surprising finding comes from our recent study of K–12 education spending in the U.S., generously supported by the Carina Initiative.

This low-level of support is ironic because, for the first time in recent memory, interest in advocating for advanced education feels on the rise. At both the state and federal levels, advocates are making the case that rigorous learning should be the norm and not the exception for our brightest students. From expanded AP and International Baccalaureate access to automatic enrollment policies in several states, the U.S. is experiencing an uptick in policy advocacy and activity with the goal of increasing opportunities for advanced learning. Perhaps not coincidentally, recent surveys provide evidence that a considerable majority of Americans believe students should have access to advanced opportunities (here, here, and here).

In light of these developments—and in the hope of encouraging additional efforts—the Carina Initiative approached our team with an important question: How much federal and state funding is directly targeted on advanced education programs? These figures can serve as a baseline for determining advocacy and policy success in the future.

Beginning in late spring 2025, we began estimating federal and state investment in gifted and advanced education over the past decade. We purposefully took an inclusive view of advanced learning, reflecting the many ways schools provide opportunities for learning outside standard grade level pathways. Rather than focus solely on funding for traditional gifted and talented programs, we also included Advanced Placement and International Baccalaureate programs.

We acknowledge past efforts to estimate public investment in advanced education, but many of these efforts have encountered substantial data limitations. For this study, we used publicly-available data sources, with outreach to state education agency personnel to confirm data accuracy, and assembled what we believe to be the most complete picture of state and federal funding for advanced education.

Federal resources

The Javits Act remains the only dedicated funding mechanism for K–12 advanced education at the federal level. The program, currently funded at $16.5 million per year, is funded at its highest nominal level in history. However, when adjusted for inflation, the current funding sits below levels seen during the George H.W. Bush administration and first term of the George W. Bush administration. Not only does this represent a net decline in Javits funding, but it effectively represents nearly 0 percent of overall federal education spending.

We also attempted to estimate federal funding for AP programs, which were originally funded via a specific line item. But several such programs were combined into block grants for states under Title IV Part A, making it difficult to determine how much—if any—is being spent by states to support advanced education.

State resources

We reviewed state funding data beginning in 2015. Due to widespread differences in reporting across states, we developed a range of estimated funding rather than a single number.

Overall, states are making minimal investments in targeted support for advanced learning. As we stated in the opening paragraph: At best, for all state advanced programs (i.e., gifted education and AP/IB funding), our high-end estimate is that, on average, for every dollar states spend on K–12 education, less than half a penny is earmarked for advanced learning. The low-end estimate is less than a third of a penny of total state education revenue spent on advanced learning.

Education finance data are complex, and the data collected for this study were no exception: Data quality varied greatly among states, and the level of investment in advanced education reflected a broad range of investment. For example, North Carolina has a longstanding investment in advanced learning with significant capacity at the state level to monitor enrollment and funding over time. The state, for instance, fully covers the cost of AP exams for all students (over $16 million in 2025) and began covering International Baccalaureate and Cambridge exams this year. Yet other states—notably California and New York—do not provide any funding explicitly for gifted education to local districts.

Our analysis also suggests that state support for advanced learning is increasing more slowly than the rate of total education expenditures. According to federal data, state revenue for all K–12 education increased by over $400 per student over this eight-year period, yet our high-end estimate is that state K–12 advanced education spending increased by 17 cents per student over the same time period (our low-end estimate is that advanced spending decreased by a penny per student).

State financial support for AP and IB, primarily in the form of exam fee assistance, is widespread and appears to be increasing. Still, this funding represents a minuscule fraction of the overall education budgets even in states that support these programs at relatively generous levels. For example, Illinois added $500,000 for state-level AP support by 2023 (compared to $0 in 2015), which—while better than no support—was 0.003 percent of the $18.2 billion K–12 education revenue from state sources that year. The vast majority of states changed their funding for advanced education less than one-tenth of 1 percent between 2015 and 2023.

We acknowledge that assumptions made during the study could influence results. Not all states responded to our outreach, and we had to decide whether to treat missing data as zero funding or truly missing. In states that combine funding for gifted education with broader special education funding—notably, high-enrollment Florida—it is impossible to isolate gifted-specific funding using public data.

However, and we believe this is the key finding from the study, the federal and state investment in advanced education is so low that even making changes in our methodology do not produce substantially different results. The gap between a third of a penny and a half a penny per dollar spent on education does not justify meaningfully different interpretations about the lack of funding supporting gifted and advanced education.

Some states are increasing their funding

Our inquiry also revealed bright spots among generally low and stagnant funding for advanced education. In Alabama, a recent state-level school funding formula overhaul led to increased resources for gifted education linked to district enrollment and a competitive grant for additional support. North Carolina also provides significant resources to districts, including funding, expertise, and monitoring of services. In Washington State, legislators have doubled state support over the past decade. These investments signal a commitment to build capacity—at the school, district, or state level—to better serve talented students, and to invest in the future workforce in the states.  

Limitations, conclusions, and recommendations

As we share our findings, one interesting reaction to this study has been to note that certain funding streams at the federal or state level were omitted. We are sensitive to these concerns and investigate any such omissions. But to date, all of the “missed” programs or line items either no longer exist, are immensely difficult to pin down based on current approaches to reporting, or are so small relative to total K–12 funding that including them does not appreciably change our estimates.

As with any study—especially studies of education finance!—we could write many paragraphs about the limitations of this work. K–12 finance data are complex, often opaque, and frequently incomplete. But given the many limitations and assumptions of this study, we believe our key findings will hold up to further scrutiny:

  1. State and federal resources devoted to advanced education are very limited, strongly suggesting that it is not a priority for policymakers. Advocates should help policymakers understand the popularity of advanced education services among both parents and the general public.
  2. Overall K–12 education spending has grown much faster than investments in advanced learning from FY15 to FY23. We acknowledge there needs to be a healthy debate about what constitutes an “adequate” level of advanced funding, but at the very least, funding for advanced education should keep pace with increases in overall education funding.
  3. When education funding is block-granted, we lose the ability to track whether the funding is used to support advanced education, and we suspect that little of it gets used to provide advanced learning opportunities to K–12 students. States should specifically delineate advanced education funding or, barring that, monitor district block grant funding to determine the extent to which public funds are (or are not) supporting advanced education.
Policy Priority:
High Expectations
Topics:
Evidence-Based Learning
School Finance
Governance
Advanced Education

Wisconsin’s Teacher Union Strength Profile

This profile is one of 51 state profiles accompanying Fordham’s report, A Crowded Table: Teacher Union Strength in 2026, which updates Fordham’s 2012 rankings of state teacher union strength.

  • Read more about Wisconsin’s Teacher Union Strength Profile

Virginia’s Teacher Union Strength Profile

This profile is one of 51 state profiles accompanying Fordham’s report, A Crowded Table: Teacher Union Strength in 2026, which updates Fordham’s 2012 rankings of state teacher union strength.

  • Read more about Virginia’s Teacher Union Strength Profile

Mississippi’s Teacher Union Strength Profile

This profile is one of 51 state profiles accompanying Fordham’s report, A Crowded Table: Teacher Union Strength in 2026, which updates Fordham’s 2012 rankings of state teacher union strength.

  • Read more about Mississippi’s Teacher Union Strength Profile

Pagination

  • First page « First
  • Previous page ‹ Previous
  • Page 31
  • Page 32
  • Page 33
  • Page 34
  • Current page 35
  • Page 36
  • Page 37
  • Page 38
  • Page 39
  • Next page Next ›
  • Last page Last »
Fordham Logo

© 2026 The Thomas B. Fordham Institute
Privacy Policy
Usage Agreement

National

P.O. Box 110
Burke, VA 22009

202.223.5452

[email protected]

Ohio

P.O. Box 82291
Columbus, OH 43202

614.223.1580

[email protected]

Sponsorship

130 West Second Street, Suite 410
Dayton, Ohio 45402

937.227.3368

[email protected]