Mobile Navigation

  • National
    • Policy
      • High Expectations
      • Quality Choices
      • Personalized Pathways
    • Research
    • Commentary
      • Gadfly Newsletter
      • Flypaper Blog
    • Events
    • Scholars Program
  • Ohio
    • Policy
      • Priorities
      • Media & Testimony
    • Research
    • Commentary
      • Ohio Education Gadfly Biweekly
      • Ohio Gadfly Daily
  • Charter Authorizing
    • Application
    • Sponsored Schools
    • Resources
  • About
    • Mission
    • Board
    • Staff
    • Career
Home
Home
Advancing Educational Excellence

Main Navigation

  • National
  • Ohio
  • Charter Authorizing
  • About

Montana's Teacher Union Strength Profile

This profile is one of 51 state profiles accompanying Fordham’s report, A Crowded Table: Teacher Union Strength in 2026, which updates Fordham’s 2012 rankings of state teacher union strength.

  • Read more about Montana's Teacher Union Strength Profile

Pennsylvania's Teacher Union Strength Profile

This profile is one of 51 state profiles accompanying Fordham’s report, A Crowded Table: Teacher Union Strength in 2026, which updates Fordham’s 2012 rankings of state teacher union strength.

  • Read more about Pennsylvania's Teacher Union Strength Profile
Jeff Murray
6.12.2026
Gadfly Bites logo
Listen to this article
Loading the Elevenlabs Text to Speech AudioNative Player...

News stories featured in Gadfly Bites may require a paid subscription to read in full. You have been warned.

  1. We’ll start today with a simple note that, among the myriad legislation passed in the General Assembly this week, was a bill that included a provision for Ohio middle and high schools to teach students about the Success Sequence. That is, the research-based optimal pathway to life success: Get an education, then get a job, then get married, then have children. Such a curriculum will soon be part of state graduation requirements. (Ohio Capital Journal, 6/12/26)

  2. On to more complicated matters. In case you missed it, Fordham Senior Research Fellow Vlad Kogan recently posted a fairly stinging analysis of the Columbus Promise program on the Ohio Gadfly Daily blog. (And in case you’ve forgotten, that’s the pledge from the city that any Columbus City Schools graduate can attend Columbus State Community College for free.) His downbeat findings—inadequate academic preparation, lots of dropouts, lost earnings, and high operating costs—very quickly generated a flurry of responses from the district, the city, and the folks hired to do the original research on program outcomes, published in the Dispatch today. It’s an important debate that we can only hope will lead to improvements in the program that better benefit students at some point in the future. (Columbus Dispatch, 6/12/26) Kogan is also an OSU professor, and he has to go into full lecture mode in this piece, easily debunking the idea that state funding for school districts is shrinking by using a pizza analogy. Good one, prof! Hopefully that’ll boost up your RateMyProfessors number even higher. (WKYC-TV, Cleveland, 6/9/26)
     
  3. Speaking of school funding issues, the elected board of Mentor City Schools has determined that their current funding woes are the result of the expansion of the EdChoice Scholarship program to near-universal status and—because they are facing a looming deficit—they must now oppose it. They voted 4-1 to join the voucher groucher lawsuit. In a unique twist, they will not have to kick in a portion of their state funding to turn around and sue the state because a random Mentorite (for surely that is what they must be called) has already maxed out a GoFundMe campaign to donate private funds for the effort, with a second one in the works for next year’s lawyer dues. Crazy stuff! (News 5, Cleveland, 6/11/26) As all 6 of my long-standing, long-suffering subscribers will surely recall, we noted that the Mentorinos (just tryin’ something) were planning to have a “debate” of sorts in chambers about EdChoice and the merits of joining the voucher groucher lawsuit. That event did actually happen, but unfortunately I missed the limited coverage there was at the time. You can take a look now if you want; I found it unsurprising.

  4. It should be noted that the elected Mentorians (still tryin’ stuff) on the board also took a step toward putting a new levy on the ballot in November to help shore up finances. Perhaps if that fails, they can crowdfund operating cash from some of their wealthier residents, too. No such option in Jefferson Township Local Schools, I reckon. Their third attempt at a levy in 12 months went down to defeat in May. And with no KickStarter to fall back on, the tiny (and still shrinking) district is making substantive staffing cuts, including all of their principals. Now before you jump on the “Ohio is starving its school districts of cash” bandwagon, do take note that Jefferson Twp. has so few students (259 at highest recent count) that they have only had two principals in the entire district for many years. There are daycares in Ohio bigger than that! Not sure how they’ve avoided fiscal emergency up to now, but it’s clearly time to talk about dissolution, consolidation, or charterization for this disappearing district. (Dayton Daily News, 6/10/26) Meanwhile, Akron City Schools has been hemorrhaging students for the last 30 years, with enrollment declines accelerating steeply since 2010. While a couple of buildings have been closed in that time, the district has also been on a building and renovation spree so comprehensive that they now face an even bigger dilemma: Any underutilized school they close to rightsize their footprint—and they must do so to avoid a looming deficit—is going to be less than 20 years old. Closing those brand-new white elephants will be “emotional”, district leaders say, but think of how readily they’ll sell to a charter or private school operator in near-mint condition. (Signal Akron, 6/11/26)

  5. In Cleveland, meanwhile, a group of community members (yes, district-employed union members count as “community”…although I do wonder how many of them actually live in Cleveland proper) is trying to end CMSD’s 30-year experiment with mayoral control of the school district—including a return to electing board members. They say they are motivated by the recent spate of building closures and consolidations. While it is true that pushback against the effort was likely dampened by the lack of elected board members involved, it is ironic that the Akron Schools folks in the clip above cite CMSD’s closure efforts as successful (they have been) and worth emulating (they are, especially the support given to impacted families). Feels like an uphill climb, but we’ll see how it goes. (Signal Cleveland, 6/9/26)

Did you know you can have every edition of Gadfly Bites sent directly to your Inbox? Subscribe by clicking here.

Policy Priority:
School Funding
Topics:
Governance
The Education Gadfly
6.12.2026
Gadfly Guy
Listen to this article
Loading the Elevenlabs Text to Speech AudioNative Player...

WHAT WE’RE READING

Amid heated debates about the future of Plyler v. Doe, an April 2026 poll found that 75.5 percent of Americans support access to the public schools for undocumented children. Alarmingly, though, the number drops to just 57.5 percent among Republicans.


Editor's note: This was first published on Mike Petrilli's Substack, SCHOOLED, a twice-weekly free Substack and email newsletter restarting the education-reform conversation.

Click here to subscribe for:

  • Sharp analysis of the week’s biggest K–12 debates

  • Curated commentary from across the ed-policy world

  • Lively discussion—including reader reactions and pushback

The Education Gadfly
6.12.2026
Gadfly Guy
Listen to this article
Loading the Elevenlabs Text to Speech AudioNative Player...

CHEERS

CharterFolk celebrates six years of contributions this week, and Jed Wallace used the occasion to highlight the extraordinary work of charter schools in Paradise, California, where educators weathered the devastating 2018 fires, rebuilt, and expanded schools to serve the community.

JEERS

Last week in The New York Times, Jennifer Valentino-DeVries offered more details on the court cases pitting school districts against social media giants. Much was disappointing if not altogether surprising, but her reporting on how the National PTA solicited money from TikTok and other platforms over the years—taking in eye-popping sums to promote the companies—is especially maddening.

—

“What are public-sector unions for, exactly? What problem are they supposed to solve?” So begins Nicholas Bagley in The Atlantic, pointing out how “unions routinely insist on pay packages and work rules that degrade the efficiency and effectiveness of the public sector.” In schools, unions lead to a reliable increase in spending without reliable improvements in student outcomes—and they are stronger in blue states, on average, than red ones.


Editor's note: This was first published on Mike Petrilli's Substack, SCHOOLED, a twice-weekly free Substack and email newsletter restarting the education-reform conversation.

Click here to subscribe for:

  • Sharp analysis of the week’s biggest K–12 debates

  • Curated commentary from across the ed-policy world

  • Lively discussion—including reader reactions and pushback

Jessica Poiner
6.11.2026
Public schools open to all blog image
Getty Images/Georg Hummer
Listen to this article
Loading the Elevenlabs Text to Speech AudioNative Player...

In 2022, a coalition of traditional public school districts filed a lawsuit that aimed to eliminate the EdChoice Scholarship, Ohio’s largest private school choice program. As part of their argument, the plaintiffs claimed that, while a traditional public school “accepts all comers,” scholarship-accepting private schools don’t. Taxpayer dollars, they said, should only go to schools that are required to take all students who want to enroll. 

It would be a compelling argument if true. But, as I pointed out in this 2022 piece, it’s not.

Nearly four years later, a lot has changed. An initial ruling in the EdChoice lawsuit sided with the plaintiffs. The case is now before an appeals court. Despite the pending lawsuit, the 2023 state budget established near universal eligibility for the program. And the number of families participating continues to climb.

One thing that hasn’t changed is the establishment’s claim that unlike private schools, everyone has equal access to public schools. It’s just as hypocritical now as it was then. But in our current economic climate, where it’s even harder for many families to afford homes in communities with excellent public schools, that hypocrisy has become even more appalling. In an effort to cut through this freshly-claimed falsehood, let’s revisit my initial rebuttal with some updated data.

***

In many places in Ohio, traditional public schools aren’t open to everyone. Most of those places are suburbs, which are only open to students who live within their district boundaries. These boundaries are rooted in real estate redlining that’s had a lasting effect on American society. They don’t require an application for entry like private schools, but they do require proof of residency. And instead of tuition, they require payment in the form of a hefty mortgage and property taxes, or sky-high rent, a price tag that’s often far out of reach for low- and middle-income families.

Consider how this works in the Columbus metro area. Columbus City Schools (CCS), the largest district in the state and one of the named plaintiff districts in the EdChoice lawsuit, served over 46,000 students during the 2024–25 school year. On the most recent state report card, it posted an overall rating of two out of five stars. That’s the same overall rating it earned during the 2023–24 and 2022–23 school years. Ratings on individual measures have also been flat: Achievement, Progress, and Gap Closing have remained at two stars for three straight years, while Graduation and Early Literacy have stayed consistent at one star.

One- and two-star ratings are clear indicators that a district and its schools aren’t meeting state expectations. But a closer look at individual ratings shows just how bad things actually are. Even in an era of lackluster graduation standards and grade inflation on school report cards, the 2025 state report card shows that just 83 percent of CCS students graduated “on-time” (in four years). Nearly 65 percent of the class of 2024 took the SAT, but only 6 percent earned remediation-free scores on the reading, writing, and math sections. [1]Twenty percent of students took at least one Advanced Placement course, but less than 5 percent earned a score of three or better on their exams. And while nearly 97 percent of third graders were promoted to fourth grade, only 36 percent proved they could read proficiently on the state ELA exam. Just 16 percent of K–3 students who were off track in reading progressed to being on track by the end of the school year.

Now, imagine you’re a parent living in Columbus. You want to make sure your child has the best education possible, and the data above—likely combined with your own experience—have convinced you that CCS isn’t the best option. You still want your child to attend a public school, though, so you start looking around. Ohio’s school district map shows that there are over a dozen districts that share borders with CCS, and because you have reliable transportation, they’re all viable options. A close look at 2024–25 report cards reveals that seven of the identified districts had overall ratings of three stars or higher and no one- or two-star ratings on the primary measures of Achievement, Progress, Graduation, or Early Literacy. Those districts are Bexley, Dublin, Gahanna-Jefferson, Grandview Heights, Hilliard, Upper Arlington, and Worthington.

You decide to focus on these seven districts. Your first move is to look into open enrollment because, even though your assigned district is academically low-performing, you like your neighborhood and you’d rather not move. Unfortunately, open enrollment isn’t an option. None of these seven districts allow students who live outside their borders to enroll in their schools.

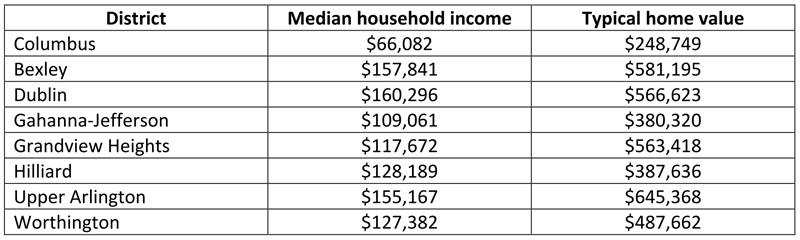
If you want to enroll your child at one of these higher-performing districts, you’ll have to move. But that’s easier said than done. In fact, purchasing a home in the districts that surround Columbus is financially out of reach for many city residents. The table below lists the median household income in 2024 dollars and the typical home value in each district as of this writing. Every single one has a significantly higher median income than Columbus. The smallest difference—between Columbus and Gahanna-Jefferson—is nearly $43,000. The same is true for typical home values. The closest difference, also between Columbus and Gahanna-Jefferson, is over $131,000. In districts like Bexley, Dublin, Grandview Heights, and Upper Arlington, the typical home now costs more than a half-million dollars. For all but the wealthiest Ohioans, it’s become a pipe dream to buy a path into excellent public schools.

Public schools open to all blog figure 1

It’s important to keep in mind that this table shows median incomes. There are thousands of Columbus households that make far less than $66,000 a year. The same is true for typical home values. Wealthier enclaves within Columbus—neighborhoods like Clintonville and Victorian Village—are driving up the average home value for the rest of the city. And don’t forget, thousands of Columbus residents are renters, not homeowners. That means they don’t have any home equity to help with a down payment on a new house. To make matters worse, many signs point to homes in central Ohio getting even more expensive over the next few years.

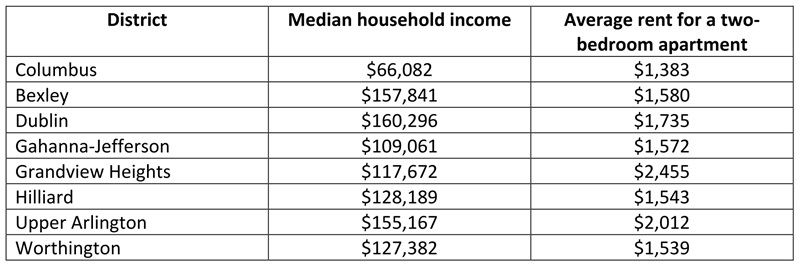
It’s possible that these families could rent, rather than buy, their way into these communities. After all, renting is now cheaper than buying a home in every major U.S. city. But as the table below shows, average rents at the time of this writing are also higher in the suburbs. And remember, the same factors driving up real estate prices are also driving up rent. Luxury apartments downtown boost the city’s median rent and make it seem a lot closer to suburban averages than it actually is.

Public schools open to all blog figure 2

As a last resort, you look for family and friends who are living in the districts you prefer but can’t afford. Your loved ones are residents, and they pay taxes, so maybe your children can list those addresses as their proof of residency. But a quick Google search reveals that’s a really bad idea. Apparently several of the districts on your list hire private investigators to tail parents and make sure they’re actually residents. In other parts of the state, parents have been sent to jail for enrolling their students in districts where they don’t reside. Much as you want your kids to have a better education, doing jail time is a steep price to pay.

The upshot? You’re stuck. The public schools that claim they’re open to all aren’t actually open because you don’t make enough money to live there. You can’t send your children to temporarily live with family or friends because districts have teams of lawyers and private investigators to hunt you down. And although Ohio has a statewide open enrollment policy that approximately 80 percent of districts participate in, the affluent, high-performing districts that surround cities like Columbus are almost exclusively closed.

What makes the establishment’s “we’re open to all” argument particularly galling is that they already know all of this. They know not all districts are open. They know that only certain kids are fortunate enough to attend the high-performing districts that they hold up as exemplars of public education. They just don’t care. Not about families, anyway. All they care about is protecting their interests—adult interests—and maintaining their monopoly. Public schools, they say, are a public good. And when something is a public good, it should be protected at all costs.

For readers who are unfamiliar, public good is an economic term that refers to services that are available to all members of society and are often paid for via tax dollars. To qualify as a public good, a service must meet two criteria. First, it must be non-excludable—the availability of the service can’t be limited to only certain people, like those who can afford to pay. Second, it must be non-rivalrous. That means when one person uses the service, it can’t prevent someone else from doing so.

EdChoice opponents are quick to point out that private schools fail to meet these criteria, as they can exclude certain students and have limited seats available. But as the central Ohio data outlined above clearly demonstrate, public schools often fail to meet these criteria, too. Yes, there are school buildings where kids are provided with an education. But is it the same education? Does everyone in the public have access to this public good, or do those who are richer get a better version? Are we really going to tell the parents of a Columbus third grader who can’t read, or a sixth grader struggling with basic math, that their child is receiving the same education as the kids in higher-performing districts that, just like private schools, exclude thousands of families?

That’s where school choice comes in. Rather than asking families to trust that districts with decades of poor performance are suddenly going to take improvement efforts seriously, charter schools and private school vouchers give families a lifeline to another option. But instead of asking why families might be so desperate for other options, districts like Columbus are pouring millions of dollars—money that could definitely be used elsewhere—into destroying all competition.

You see, it’s not enough for districts to close their borders and be hypocrites. They also want to prevent kids from attending any and every school that’s not under their control. That’s why they’re so outraged by data demonstrating that urban charter schools outperform local districts. That’s why they’ve filed a lawsuit to eliminate the EdChoice program. And that’s why, when parents dared to express concern over a lawsuit that could upend their lives and their kids’ futures, the callous response from the plaintiff districts was that families “do not have sufficient knowledge about either the Ohio Constitution or the EdChoice Voucher Program to be of any use to the Court in deciding this case.”

The bottom line is this: If you’re rich enough to buy or rent a home in a high-performing district, your kid gets to go to an excellent school. The world is your oyster. If, however, you can’t afford to pay your way into one of these districts, then most—if not all—high-performing public schools are closed to you. You can either resign yourself to the assigned district that, for myriad reasons, doesn’t work for your child, or you can take advantage of school choice programs. But beware—if you put your child’s interests above those of the adults running your district, the establishment will brand you as a traitor. Because after all, your kids are really their kids.


[1] Results on the ACT were similarly abysmal: 9 percent of students took the ACT and less than 2 percent earned a remediation-free score on the English, math, and reading sections.

Policy Priority:
School Choice
Topics:
Private School Choice
Dale Chu
6.11.2026
C grade on a test
Getty Images/DragonImages
Listen to this article
Loading the Elevenlabs Text to Speech AudioNative Player...

More than a dozen states are designing, piloting, or implementing some form of through-year (or through-course) assessment as a replacement for the traditional end-of-year test that has long been used for federal accountability. Among the latest entrants are Kansas and Texas, both led by respected chiefs known for taking accountability seriously. Through-year assessment is appealing because it promises to address multiple longstanding frustrations with existing state tests. But growing enthusiasm for it rests on a shaky assumption: that a single assessment can simultaneously satisfy accountability requirements, improve instruction, provide timely feedback, reduce testing burden, preserve local flexibility, and produce valid statewide comparisons. It slices, it dices, it even juliennes!

Complicating matters further, there is no single through-year blueprint. The term itself belies how varied these systems are. Instead, states are experimenting with different ways of structuring what is tested at each point in the year and how those results are used. In some states, all specified content is sampled across a series of tests and combined into a single annual determination of proficiency. In others, only portions of standards are assessed at each administration, with earlier results either fully incorporated into the final score, selectively weighted, or used primarily for informational purposes. Still other approaches rely primarily on the summative exam, with earlier tests serving mainly to support instruction rather than accountability. Policymakers and practitioners often use the same term to describe very different testing models.

Kansas’s approach, for example, is built around quarterly assessments that sample standards across the school year. Districts have some discretion as to how certain standards are incorporated into the testing sequence, but the system is designed to generate a single accountability score by aggregating performance across all four administrations. Texas, by contrast, is pursuing a program that gives districts greater flexibility over when and how certain assessments are administered, particularly at the beginning and middle of the year. Both states are trying to make state testing more useful for instruction while preserving its role in accountability. Yet for all the optimism surrounding these models, the empirical evidence on through-year assessment remains quite limited.

The more states try to have it both ways, the more they run into the tension of serving multiple, competing purposes at once. It is the same dilemma captured in the classic Saturday Night Live commercial for “New Shimmer,” a product advertised as both a floor wax and a dessert topping. Through-year assessment has something of a New Shimmer problem: It is being asked to function simultaneously as an accountability instrument and an instructional tool, as a system for comparability and a system for flexibility—design goals that do not naturally coexist in a single product.

Assessment experts have been warning about this dynamic for years. In a 2023 report, the Center for Assessment outlined ten key considerations for states pursuing through-year systems, many of which reflect the tradeoffs inherent in assessment design. More instructional utility often comes at the expense of comparability across students and schools. Additional testing windows may yield more information but increase logistical complexity. Faster feedback requires sacrifices elsewhere in the system, most commonly in the depth and breadth of what the assessment can cover.

These tradeoffs are not simply technical problems that can be papered over through more sophisticated psychometric design. They reflect a structural tension between systems built to support comparability and those designed to support instructional responsiveness. The expectation underlying many through-year proposals is that careful design choices can manage or smooth over this tension. But no matter how much ingenuity is brought to the ingredients list, a floor wax cannot be a dessert topping.

Indeed, the demands of accountability and instructional relevance pull in opposite directions. The more an assessment system is tailored to teaching and learning, the more it must reflect the diversity of classroom pacing, curriculum, and local priorities, potentially generating a wide array of tasks and measures. Accountability, on the other hand, depends on comparability across students as well as schools and districts, which requires common items or tasks aligned to a shared set of academic content expectations. Trying to make one system do too many things is a recipe for indigestion.

In theory, a summative test could be distributed across multiple administrations so that no single sitting carries the full weight of measurement. This idea is not new. It was, after all, a central motivation behind the original PARCC design. But that approach was never fully implemented, in part because states worried about unintended effects on curricular pacing and sequencing, as well as the added logistical and time demands of multiple testing windows.

That history points back to a familiar constraint rather than a new solution. The challenge, then, is not a lack of good intentions or even a lack of innovation. It is that state assessment systems are being asked to solve multiple problems at once, requiring choices that satisfy no purpose fully and inevitably sacrifice elements of each. In the process, states may be required to spend more time, money, and resources on unproven assessment models—and probably add to students’ total testing burden—at a time when there is little, if any, appetite for doing so.

Through-year assessment may yet prove valuable in some contexts. With strong leadership at the state level, Kansas and Texas are two worth watching closely. But policymakers should be wary of promises that sound too good to be true. The risk is that states mistake an unavoidable tradeoff for a design problem that can be engineered away.

Policy Priority:
High Expectations
Topics:
Accountability & Testing
Governance
Teachers & School Leaders
Kari Kurto
6.11.2026
Teacher and students
Getty Images/viafilms
Listen to this article
Loading the Elevenlabs Text to Speech AudioNative Player...

Editor’s note: This discussion between members of the Fordham research team and Kari Kurto, The Reading League’s National Director of Policy and Partnerships, comes in the wake of Fordham’s recent survey, From the Teacher’s Desk: A Science of Reading Progress Report. Questions come from the Fordham research team.

1. Which of the report’s findings or results do you find most encouraging? And which is most troubling?

There is a lot to be encouraged by here. The growing understanding of phonics and word recognition among teachers is promising, as is the finding that 81 percent of respondents recognize the importance of breaking words into parts to support struggling readers. We were also especially glad to see the report include information on understanding the needs of students with dyslexia and English learners.

At the same time, several findings are deeply concerning. We are troubled by the continued finding that only 2 percent of teachers report learning evidence-aligned reading practices during their pre-service training, as opposed to the training they receive after years of teaching. This means the overwhelming majority of teachers have been entering classrooms without the knowledge they need. It is also troubling that 56 percent of teachers still associate dyslexia primarily with letter reversal. Finally, we are also concerned by the “science of reading gap” in high-poverty schools and at intermediate and secondary grade levels.

2. To what extent did the report confirm your expectations? Was there anything that surprised you about teachers’ responses?

Most notably, the report captures just how far the field has come in a relatively short period of time. One example that was encouraging to read was a classroom application scenario in which a student was having difficulty reading an unfamiliar word. The report states that “81 percent of teachers correctly indicate that the best strategy is to help the student break the word into parts to identify syllables or phonics patterns.” We celebrate this as tremendous growth in our collective understanding of how to support struggling readers.

Although there has been meaningful progress in shifting beliefs and practices, implementation remains uneven. Because of the frequent media attention on evidence-aligned phonics instruction, we expected to see progress in aligning word-reading practices with the science of reading. However, the survey confirms that we still have a long way to go in ensuring that all components of literacy are understood and implemented well. For this to happen, it is important for everyone, from legislators to researchers to the media, to focus on aligning all aspects of reading and writing instruction to the research.

It was surprising to see teachers’ comments on third-grade retention. In speaking with state leaders about this policy, it is often contentious. Yet the report suggests that implementation may be weakening the policy in practice.

We were also surprised that teachers and the report developers saw curriculum-based training as synonymous with training in the science of reading. While some of these programs are educative and teach teachers concepts, and support their understanding of the curriculum, these trainings are often not focused on building knowledge in the science of reading. Some of these curriculum-adjacent trainings may include practices that run counter to the science of reading, and several will only cover aspects of word reading, which may further reinforce the misconception that the science of reading focuses solely on word recognition.

3. After reading the report, what do you see as the biggest takeaway for the science of reading movement? What should we be doing differently?

The report makes clear that we have made real progress, but the work is still far from done. The biggest takeaway is that, while awareness of the science of reading has increased significantly, the typical elementary school teacher’s understanding of what it encompasses remains too narrow.

At The Reading League, we work hard to convey that reading science supports comprehensive, evidence-aligned literacy instruction, including explicit and systematic phonics and decoding, but also phonemic awareness, fluency, morphology, multisyllabic word reading, vocabulary, oral language development, discourse, writing, and reading comprehension. Our Curriculum Evaluation Guidelines identify 80 aligned practices across these domains. When the science of reading is framed narrowly as a phonics initiative, it can inadvertently validate the critics who argue it represents a narrow view of literacy, and it leaves teachers without a complete picture of what their students need. Going forward, the movement must do a better job of communicating this full picture.

4. One of Fordham’s core beliefs is that traditional reading comprehension strategies have diminishing returns—and that the single, most powerful “strategy” is a curriculum that systematically builds students’ knowledge of the world (and the associated vocabulary). Can you help me understand how The Reading League sees this question?

It is true that solid, empirical research supports the importance of building knowledge to enable comprehension. When a student develops a schema for a given topic, they can more easily comprehend more complex texts on that topic. This is a gateway to rigorous expository texts, which is an important goal.

However, when you elevate one strategy as the single most powerful, educators and leaders may latch onto it, believe their students will succeed based on that evidence, purchase a curriculum, and assume the problem is solved. With this view, we are concerned that the pendulum is swinging too far and that educators may abandon strategy instruction, which is also important when taught in an evidence-aligned manner.

In fact, even the meta-analysis cited in the report The Role of Background Knowledge in Reading Comprehension: A Critical Review supports both knowledge-building and strategy instruction.

“Findings from this review suggest that children would benefit from exposure to background knowledge in a specific, explicit and sequenced way (Connor et al., 2017; Kim et al., 2021): a so-called ‘knowledge-rich’ curriculum (Hirsch, 2019) in addition to teaching of comprehension strategies such as summarizing.”

The three words “in addition to” are critically important. What happens when a student learns deeply about birds but then faces a reading passage about mitosis? Their knowledge about birds does not transfer. So while a deep understanding of the topic and related vocabulary is always the hope, it makes sense to give students some automated strategies that can help them parse and comprehend texts on unfamiliar topics.

To be clear, the research does not support teaching strategies through short, disconnected texts, as was the case in the balanced literacy era. However, it does suggest that certain strategies can be an effective source of leverage for students when they are applied in the context of an ELA curriculum that intentionally focuses on building knowledge, or through direct application in science, history, and other content area instruction.

Strategies are particularly effective when they are not taught in isolation but build upon one another using a framework like Dr. Kay Wijekumar’s Knowledge, Acquisition, and Transformation (KAT), which has a strong evidence base (Wijekumar, K et al., 2012). This is not a single strategy instruction approach, but an approach that leverages text structure to help students more easily understand the text’s essential ideas. From there, the student uses this understanding to develop a summary, which is then used to further students’ reading comprehension and to help them make inferences more easily. When practiced consistently in across texts, students can master those routines and apply them on their own.

Strategies and scaffolds to support students’ comprehension when reading rich and challenging texts should not be omitted from our instruction.

5. It’s obviously difficult to gauge teacher knowledge via survey. Is there anything else that you wish we’d asked teachers? What’s the most important question that you think remains unanswered?

Reid Lyon often shares that one thing he would have done differently during Reading First would have been to work more closely and directly with teachers. He and his team knew what worked in a research setting, yet sometimes it was not actually able to be implemented.

Thinking through this lens, it would be helpful to know from teachers what has been the most helpful knowledge to gain, where implementation gets tricky, and what can be done to sustain this work. This guidance cannot come only from top-down sources, but must be a collaborative and reciprocal process among educators, educational leaders, and researchers to avoid initiative overload and burnout.

There are still several unanswered questions, of course. When The Reading League was named, the word “league” was chosen very intentionally. Not one of us knows everything. It takes researchers, experts, educators, leaders, media, and legislators to tell a complete story of what will work when it comes to teaching kids to read.

It is our responsibility to ensure we remain grounded in the evidence and do not listen to ego or sensationalism that might take our eyes off this important prize. As Neil deGrasse Tyson said, “The good thing about science is that it’s true whether or not you believe in it.” The question before us, then, is whether we are willing to break down silos and row in the same direction—toward the evidence and the science—so that our nation’s literacy outcomes do not continue to decline, but instead grow stronger for generations to come.

Policy Priority:
High Expectations
Topics:
Evidence-Based Learning
Curriculum & Instruction
Governance
Teachers & School Leaders
Michael J. Petrilli
6.11.2026
Stacked coins
Getty Images/marchmeena29
Listen to this article
Loading the Elevenlabs Text to Speech AudioNative Player...

OpenAI, Anthropic, and SpaceX are all planning to go public in coming months, which will create a new crop of billionaires and centi-millionaires—and likely Earth’s first trillionaire. Here’s how Nan Ransohoff put it in a Substack post that’s been making the rounds:

Hundreds of billions of dollars in new philanthropic capital will soon become liquid. The OpenAI Foundation holds 26 percent of OpenAI, worth about $220B at today’s valuation. Anthropic’s seven co-founders have pledged to give away 80 percent of their wealth and have instituted the most aggressive donor matching program for employees in tech history.

She does some back-of-the-envelope math and comes up with an estimate of $50 billion in new philanthropic spending every year. This is six times the annual spending of the Gates Foundation.

My question is how education reformers can convince the new philanthropists to invest in educational improvement. I worry that it may not be easy.

Note, for example, Ross Douthat’s off-hand comment in his New York Times column about this coming gusher of cash:

At its best, the infrastructure established by figures like Gates delivered effective efforts to reduce poverty and fight disease; at its worst, it threw money after fashionable political causes and education fads.

“Threw money after…education fads.” Harsh…but kinda fair?

Or consider what Nan thinks the newly minted zillionaires are going to care about, coming as they do from the world of AI:

Belief 1: AI is fundamentally reshaping civilization and we need to make sure that goes well. There are two major questions at hand: (1) How do we ensure we make it through the AI transition? And (2) if/once we do, how do we ensure humanity flourishes? The first is more downside-oriented, concerned with catastrophic or at least major risk (biosecurity, loss of control, etc.). The second—human flourishing—is more upside-oriented. Flourishing here is broader than the usual short list. It’s longevity and economic abundance, yes—but it also extends into aesthetics, civic life, moral imagination, relationships, and the cultural infrastructure that gives life meaning.

Belief 2: Speed matters. The next X years are critical. There’s tremendous concern especially around the group of risks driving question (1) described above. The importance of speed in mitigating these risks is critical if not existential.

Speed is not something that education, or education reform, is known for. After all, as Sam Altman said (defensively but also accurately) back in February, “It takes about 20 years of life—and all the food you consume during that time—before you become smart.” I’m a big believer in starting reform efforts early, especially in elementary school, but the payoff doesn’t come for a decade or more. Some of these folks will worry that we’ll all be replaced by AI overlords by then.

“Human flourishing,” on the other hand, is something that great schools can definitely contribute to. And it makes sense, especially for high schools and colleges, to worry deeply and urgently about helping graduates through the “AI transition,” both in terms of preparing for jobs that are unlikely to be replaced by bots and in developing the “moral imagination, relationships,” etc. that will allow them to flourish along the way.

But does that mean we need to transform secondary and postsecondary education entirely? Double down on the liberal arts? Lean into career and technical education in fields that will be hard to automate? Everyone has opinions (myself included), but nobody knows for sure.

And what about the meat-and-potatoes school reform agenda? Raising standards, expanding high-quality choices, supporting excellent teachers, spending resources more efficiently and effectively? How do we get the AI billionaires to care about all of that? Especially at a time when student achievement is in the toilet and the conventional wisdom is that “nothing works,” that past philanthropy has “thrown money after education fads” and has little to show for it? I don’t think that’s true. We made a huge amount of progress from the late 1990s till the early 2010s, thanks in part to philanthropy. And lots of things work—even according to stodgy scholars—including charter schools, pre-K, merit pay, and more. But in the competition for philanthropic funding, we are starting with some serious disadvantages.

Editor’s note: This was adapted from an article first published on Mike’s Substack, SCHOOLED.

Policy Priority:
High Expectations
Amber M. Northern, Ph.D.
6.11.2026
Graduates
Getty Images/Rattankun Thongbun
Listen to this article
Loading the Elevenlabs Text to Speech AudioNative Player...

Choosing a college major requires young people to balance their interests, academic ability, future job prospects, and expected financial return. Some majors pay off right away with solid employment outcomes and high earnings, while others take years to fully realize returns—if indeed they ever do. A recent descriptive study sheds light on one little-studied influence on the choice of a college major: family background.

Economists Margaret Leighton and Jamin Speer of the University of St. Andrews in the UK and the University of Memphis, respectively, use data from the American Community Survey (ACS) and Higher Ed Research Institute’s College Senior Survey to examine two proxies for family background—parental education and parental income. How do they influence a student’s choice of college major and how does each correlate to the earnings growth experienced by graduates with that major over time?

Leighton and Speer construct a dataset of college majors’ earnings profiles over the course of a career using a sample of about 140,000 students who were college seniors between 1994 to 2008. Data from ACS include detailed family characteristics. Unfortunately, while the higher ed survey data include hundreds of colleges and universities, they’re by no means representative of the U.S. college population and tend to oversample from private and selective universities. To attempt to correct for this, the researchers replicate their main analysis within two other, smaller datasets that show similar patterns to the larger analysis. They include lots of student-level controls in their model as well as control for differences across institutions. One limitation is they can’t follow the same individuals past their senior year of college, so they only know if students planned to go onto graduate school, not if they actually did. They look at career growth in five-year bands between ages 20 to 64. Their primary outcome is growth in earnings, which is the percentage change in average earnings from early in a career—roughly age 28—and later in a career, at around age 45.

First, the researchers identify the low-earnings-growth (a.k.a. “early return”) majors—such as nursing, education, and social work—and the high-earnings-growth (or “late return”) majors. The latter include medicine, chemistry, biology, and physics.

They find that parental education and parental income, despite being strongly correlated, have different relationships with the choice of major. Parental education level has a strong and consistent relationship with this choice: students whose parents have advanced degrees are more likely to choose majors that pay off later in life. Said another way, these young people appear willing to make less money immediately after college alongside a promise to make more later in life. Parental income level, however, is less related to the choice of major. In fact, while students from higher-income families tend to choose higher-growth majors, that link is insignificant once parents’ education is included as a control.

Importantly, the overall results appear to be driven by students with graduate-educated parents going on to jobs with high growth, and particularly by those who don’t go to graduate school right after college.

Leighton and Speer describe a role model effect even if they don’t call it that. They say that “the years between college and graduate school, in which these same students earn less than students with less-educated parents highlight that students with different backgrounds may have different time preferences.” That’s likely because they have seen their own parents make the same trade off and they have confidence that it will work out for them, too. The takeaway is straightforward: Family background may shape upward mobility not only by opening doors, but also by influencing which paths students believe are worth the wait.

SOURCE: Margaret Leighton and Jamin D. Speer, “Family Background and College Major Choice: Evidence on Major Earnings Growth,” Education Finance and Policy (January 2026).

Policy Priority:
High Expectations
Topics:
Evidence-Based Learning

Pagination

  • First page « First
  • Previous page ‹ Previous
  • Page 29
  • Page 30
  • Page 31
  • Page 32
  • Current page 33
  • Page 34
  • Page 35
  • Page 36
  • Page 37
  • Next page Next ›
  • Last page Last »
Fordham Logo

© 2026 The Thomas B. Fordham Institute
Privacy Policy
Usage Agreement

National

P.O. Box 110
Burke, VA 22009

202.223.5452

[email protected]

Ohio

P.O. Box 82291
Columbus, OH 43202

614.223.1580

[email protected]

Sponsorship

130 West Second Street, Suite 410
Dayton, Ohio 45402

937.227.3368

[email protected]