Mobile Navigation

  • National
    • Policy
      • High Expectations
      • Quality Choices
      • Personalized Pathways
    • Research
    • Commentary
      • Gadfly Newsletter
      • Flypaper Blog
    • Events
    • Scholars Program
  • Ohio
    • Policy
      • Priorities
      • Media & Testimony
    • Research
    • Commentary
      • Ohio Education Gadfly Biweekly
      • Ohio Gadfly Daily
  • Charter Authorizing
    • Application
    • Sponsored Schools
    • Resources
  • About
    • Mission
    • Board
    • Staff
    • Career
Home
Home
Advancing Educational Excellence

Main Navigation

  • National
  • Ohio
  • Charter Authorizing
  • About

Brandon L. Wright
3.5.2026
students raising their hands
Getty Images/Caiaimage/Chris Ryan
Listen to this article
Loading the Elevenlabs Text to Speech AudioNative Player...

The United States is in a period of moral fragmentation and decay, and the extended family—the primary historical source of moral education—has given way to a nuclear family that is stretched thin and, in many cases, itself fractured. Children now spend less of their formative time inside family networks and more of it in schools, daycares, afterschool programs, and summer camps. Yet cultural conflict and politics have left these places less able to shape character at the very moment their role has grown. This is a problem, and private school choice, while no panacea, is the most practical education-policy response.

By “moral fragmentation and decay,” I mean a weakening of the shared norms that make everyday life and democracy work, such as respect for rules, respect for others, empathy, sympathy, and self-restraint. As these have eroded and society has become more atomized, they’ve contributed to declining social trust, eroding participation in civic and community life, polarization, rising contempt for institutions, and more disorder and conflict in the places where people work and learn.

These shifts affect children because they develop character through daily habituation, including repeated expectations, modeled behavior, consistent consequences, and the peer cultures that form around them. A child’s “moral education” is therefore inseparable from the environments where that child spends the most time.

The biggest change is the transformation of family life. Americans still have devoted, loving parents, but the network that once made moral formation easier and more consistent has splintered. Geographic mobility separates grandparents, aunts, uncles, and cousins who used to be present in daily life. Household structure is also less stable for many children, with a large share born to unmarried parents and many experiencing divorce or separation. Meanwhile, the pressures on parents’ time and attention are significant: dual-earner schedules, long commutes, and a digital environment that competes with, and often corrodes, family life rather than supporting it. When adult time, adult presence, and intergenerational reinforcement decline, the work of character formation becomes harder to sustain.

As family life has changed, the time-allocation of childhood has shifted toward institutions, a shift that’s visible in rough hour-counts. Consider two early-childhood pathways. A child cared for primarily by family members and attending half-day preschool from ages three to five might accumulate something like 18,000 hours embedded in family life and 2,000 hours in institutional care by the start of kindergarten. A child who attends full-time daycare and then full-day preschool could be closer to 8,000 hours with family and 12,000 hours in institutional care over the same span. Precise figures vary, of course, but the direction is unmistakable: Long before kindergarten, many children are spending a substantial share of their formative time in institutional settings.

Once kindergarten begins, school alone accounts for roughly 1,000 hours a year for many children, plus before- and after-school care, structured extracurriculars, and summer programs—not to mention tremendous amounts of time on their phones and other devices. By adolescence, many students have spent a majority of their waking weekday hours in places designed primarily for instruction and supervision (or in the case of screen-time, attention and engagement), instead of environments designed for deep, values-centered formation—especially a formation that’s in line with a specific family’s values. Parents are still relevant, of course, but institutional environments now bear much more of the load than in past generations.

If those institutions were well-suited to provide coherent character education, this shift might not matter as much. But in the modern United States, public school systems face three structural constraints that make this difficult.

First, pluralism and politics make agreement on more substantive moral teaching hard to achieve in a public system. Schools tend to default to simple values—be kind, follow directions, wait your turn—because they are the only ones that are politically safe. And as the next paragraph explains, they often struggle to enforce even these. Under these circumstances, schools can’t possibly do all the work that families once did. The result is often a patchwork of implicit values, contested norms, and conflict avoidance.

Second, many schools have moved toward discipline policies that are less corrective and less consistent. Kids learn right and wrong when adults state rules plainly and reliably enforce and model them. When misbehavior is handled unpredictably, or treated as something adults must accommodate rather than correct, students learn that boundaries are flexible and obligations to others are optional. Even when the intent is compassionate, the cumulative effect can weaken the school’s culture of conduct.

Third, modern incentives push schools toward measurable academic outputs and away from sustained character formation. They’re evaluated primarily on test scores and graduation rates, not on the difficult, hard-to-measure, and deeply relational job of building a coherent culture of right and wrong. Teachers receive limited training and support for that sort of work, and school leaders have strong incentives to minimize controversy rather than take clear stances on what virtues a school will explicitly model and promote.

Private schools are less constrained by these forces, which is why programs that give more families the opportunity to attend them are the most promising of available, real-world education policies for offsetting our moral fragmentation and decay. They won’t solve the problems, of course; they’re far too enormous and their causes too many. It’s more like bringing an excavator to a massive landslide—insufficient by itself, but a necessary part of the solution, and therefore important to pursue.

Private school leaders can state a moral mission openly, be it religious or secular, and build a coherent culture around it in ways that district schools often can’t (and in the case of public charter schools, often don’t). They can hire staff who believe in their mission. They can adopt curricula and instructional practices that treat character formation as central rather than as an awkward add-on. And all of this can align with the expectations and values in students’ homes because families opt in rather than being assigned. Moreover, that alignment cuts both ways: If a school drifts from its mission, parents can hold it accountable by leaving.

This is what the moment demands. If moral education requires habituation inside consistent environments, then coherence between families and institutions matters. And a private school community that agrees on what virtues it is trying to cultivate is better positioned to teach them than a public school that has to serve families with fundamentally competing moral commitments.

A predictable objection is that private school choice lacks guardrails. If that’s true, it’s also fixable. Programs can honor family freedom while still protecting the public interest by instituting regulations that require transparency about mission and outcomes, track academic achievement in core subjects, and protect against fraud, abuse, and discrimination (however defined). Some places will require more of these rules, other less. The challenge will be ensuring that any such constraints don’t rob private schools of the qualities that allow for strong character formation. 

Another objection is that choice could intensify social fragmentation. If people self-select into different moral communities, won’t we become even more divided? But we already sort—by neighborhood, housing prices, and social networks—and public schools already reflect those divides. More importantly, a pluralistic society is held together by citizens who have developed strong moral foundations, and who can then bring those virtues into a shared civic space, not by forcing everyone into one contested set of values.

In this sense, private school choice is a central response to a central problem. If schools are going to carry more of the moral-formation load in a strained, fragmented society, then leaders should expand the number of schools capable of doing that work effectively and expand access to them. Policies like education savings accounts, vouchers, and tax credit scholarships—especially when well designed and regulated—do just that.


Policy Priority:
Quality Choices
Topics:
Curriculum & Instruction
Governance
Private School Choice
Teachers & School Leaders
Julia Hayes
3.5.2026
Empty classroom
Getty Images/Wirachai
Listen to this article
Loading the Elevenlabs Text to Speech AudioNative Player...

Principals play a crucial role in managing teacher quality, including hiring, developing, and retaining effective staff while also addressing low-performing teachers. Classroom observations and value-added metrics based on student achievement can help identify ineffective teachers, although data suggest that few teachers actually face dismissal. In practice, principals rely on a mix of formal and informal methods to manage teacher effectiveness.

One informal strategy to remove ineffective teachers is known as “counseling out”—an intentional effort to encourage a teacher to leave the school without initiating formal dismissal procedures. A new study by Nat Malkus and Amy Cummings used interview data from a convenience sample of 50 principals across six traditional public school districts in four U.S. states to explore the prevalence and practice of counseling out. The researchers relied on interview data because formal records do not capture counseling out. Interview data were supplemented with district administrative data on teacher mobility, assignment, experience, and evaluations, which provided contextual information, but did not identify whether departures resulted from counseling out.

Several key findings emerged. A whopping 94 percent of principals reported counseling out a teacher at some point. Rather than being an isolated practice, counseling out appeared to be a significant human resource strategy widely used by school leaders.

Administrative data from the 2017–18 school year showed that 283 teachers (14 percent) who taught in the sampled schools that year did not return the following school year. Of these departures, 210 (74 percent) left voluntarily—principals did not report encouraging their departure, 14 (5 percent) were formally dismissed, and 59 (21 percent) were counseled out—principals intentionally encouraged them to leave. Sixty-four percent of principals confirmed that this was representative of the proportion of teachers who were typically counseled out each year.

Clear differences emerged between the evaluation ratings of teachers who were counseled out and those who voluntarily departed. Evaluation ratings for counseled-out teachers more closely resembled those of teachers who were formally dismissed. Through these evaluations, teachers were rated as low-, middle-, or high-performing. Fifty-three percent of counseled-out teachers received a low rating, compared to 22 percent of all departures. In contrast, only 5 percent of teachers who were counseled out had received a high rating, compared to 37 percent of all departures. Both counseled-out and formally dismissed teachers were intentionally removed by their principals, albeit through different mechanisms.

Principals were asked to describe the process they followed when counseling out a teacher. The most common approach was “critical conversations,” which were used to counsel out 61 percent of teachers. This approach involved frank discussions about teachers’ shortcomings and how those shortcomings could jeopardize their employment, while also offering teachers an opportunity to leave without a formal record that could impact their future employment.

Although the administrative data did not provide information on counseled-out teachers’ subsequent employment, principals were asked whether they knew the whereabouts of those who departed in the 2017–18 school year. Generally, principals had limited knowledge of the destinations of teachers formally dismissed, as they were unlikely to discuss future career plans with those they had terminated. However, principals were able to report on 39 percent of counseled-out teachers; among those, approximately half continued teaching in the same district, suggesting some degree of local career continuity. This raises the possibility that counseling-out may shift ineffective teachers to different schools within the same district rather than removing them from the district altogether, potentially redistributing rather than resolving performance concerns. 

These findings suggest that counseling out is not merely a last-resort measure, but a widely used tool for maintaining teacher quality and influencing dismissals. Rather than relying exclusively on formal termination policies, counseling out allows principals to remove underperforming teachers while reinforcing the importance of teacher evaluation systems for improving school quality and guiding consequential staffing decisions. This dynamic highlights the tension between both formal and informal policies, as formal policies make it difficult to remove persistently underperforming teachers, leading principals to turn to informal strategies, for better or worse.

SOURCE: Nat Malkus and Amy Cummings, “Turnover Tactics: Unveiling the Frequency and Mechanisms of Counseling Out,” Journal of Education Human Resources, 2026-01, Vol.44 (1), p. 98–123 (February 2026).

Policy Priority:
High Expectations
Topics:
Teachers & School Leaders
Jill Hoppe
3.5.2026
College student outside
Getty Images/Sirinarth Mekvorawuth
Listen to this article
Loading the Elevenlabs Text to Speech AudioNative Player...

The end of race-based affirmative action and persistent gaps in enrollment and degree attainment among students from low-income backgrounds have intensified calls for strategies that expand postsecondary access and completion. One such initiative, Advise TN, is a statewide advising program that places college advisors in Tennessee high schools with a history of low college enrollment. They are there to supplement the work of guidance counselors and are employed, trained, and overseen by the Tennessee Higher Education Commission (THEC), not by schools themselves, and are prohibited from engaging in non-advising school duties. Their work includes helping students complete the FAFSA, apply for state-level financial aid programs like Tennessee Promise, submit college applications, and explore non-college options. A new working paper examines whether the program improves students’ postsecondary outcomes.

Researchers from the University of Wisconsin-Madison followed more than 120,000 students across 33 Advise TN high schools, as well as 28 eligible schools that were not accepted due to funding limitations from 2010–11 to 2019–20. Although the program began in 2016, data from 2010–2016 serve as a baseline, capturing student outcomes at these schools before the advising intervention.

The researchers draw on student-level data from TN DATA, which follows students from pre-K through high school, postsecondary education, and into the workforce. These records are combined with four additional administrative and program data sources to compare six outcomes across the two groups of schools: whether students filed FAFSA, Tennessee Promise application rates, college enrollment within one year of high school graduation, college persistence, degree attainment, and post–high school employment among students who do not enroll in college.

Advise TN produced substantial gains early in students’ transition to postsecondary education. FAFSA filing rates increased by 7 to 8 percentage points, applications to Tennessee Promise increased by 3 to 4 percentage points, and college enrollment within one year of high school graduation increased by approximately 3 percentage points. Gains were especially strong for historically underrepresented students, including Hispanic students and those in rural areas (up 6.3 and 6.4 percentage points, respectively), suggesting that intensive advising is particularly effective at reducing procedural and informational barriers that disproportionately affect certain populations.

Importantly, gains are correlated with program design: highest in schools with more frequent meetings, fewer students per advisor (especially 99:1 or lower), and among students who received advising in person or through a hybrid model combining in-person meetings with texts, calls, or emails. Students who only interacted with advisors remotely showed no increases in college enrollment.

Despite initial college enrollment boosts, however, the researchers find no significant causal impacts on college persistence, degree attainment, or post-high school employment. While there is suggestive evidence of a small (1.9 percentage point) increase in degree attainment in the earliest years of the program, these effects are not consistent across cohorts. For students who never enrolled in college, Advise TN did not appear to alter employment outcomes following high school graduation.

Later graduating cohorts in the study (e.g., high school class of 2019) were enrolled in college during the Covid-19 pandemic, a period that disrupted college persistence and completion nationwide. Despite this, the study does not explicitly address how the pandemic may have affected student outcomes, so it may underestimate Advise TN’s impact. Future research incorporating additional post-pandemic cohorts will help clarify whether Advise TN is more effective at boosting persistence and degree attainment without the context of a global pandemic. An in-depth analysis of post-college employment outcomes could help reveal whether Advise TN leads to longer-term gains.

Nevertheless, without sustained gains in persistence or completion, Advise TN risks inflicting significant harm on both individuals and the state with increased student debt and lost time. Policymakers must seriously weigh whether the program’s enrollment gains justify its costs, particularly when historically underrepresented students enroll in college and leave without a credential.

High school-based college advising can be effective at helping students clear the administrative and informational barriers that stand between them and college enrollment, but may be less effective at influencing what happens next. Without continued support after high school graduation, even well-designed advising programs can open the door to college without ensuring students can finish, leaving low-income students at risk of unnecessary, debilitating debt and lost time that might be better spent pursuing alternative pathways to the workforce.

SOURCE: Taylor Odle and Isabel McMullen, “When and Why Does College Advising ‘Work:’ Evidence from Advise TN,” Annenberg Institute at Brown University (December 2025).

Policy Priority:
High Expectations
Topics:
Evidence-Based Learning
Teachers & School Leaders
Jeff Murray
3.4.2026
Gadfly Bites logo
Listen to this article
Loading the Elevenlabs Text to Speech AudioNative Player...

News stories featured in Gadfly Bites may require a paid subscription to read in full. Just sayin’.

  1. School districts are not the only ones out there looking to shave time off the calendar, it seems. Meet the “mini-mester”, a newish and expanding effort to condense community college course content into as little as 8 weeks. The key it seems is asynchronous coursework, completed whenever students with job and family commitments can get to it. This piece tells us mini-mesters already exist at community colleges and a national nonprofit looking to boost their use has chosen five Ohio institutions which they will support (and evaluate) as they pilot their own versions. (The Ohio Newsroom, 3/4/26)

  2. Northeast Ohio’s News-Herald outlet is the first to tell us about Ohio House Bill 715, a newly-introduced measure that aims to add data and reporting requirements to the Ohio Department of Education and Workforce for private schools accepting students using EdChoice and other voucher programs. These requirements include total enrollment, the number of scholarship students, where those students attended the previous year, and the amount of state funding the school received; the number of voucher students in each school, broken down by family income; and a comparison of the academic performance of voucher students with similar students in nearby schools via some mechanism still TBD. (The News-Herald, 3/3/26)

Did you know you can have every edition of Gadfly Bites sent directly to your Inbox? Subscribe by clicking here.

Policy Priority:
School Funding
Topics:
Governance
Jessica Poiner
3.2.2026
Youth apprenticeships blog image
Getty Images/dk_photos
Listen to this article
Loading the Elevenlabs Text to Speech AudioNative Player...

One of the hallmarks of a high-quality career pathway is work-based learning (WBL). Defined as a coordinated sequence of experiences that provide students with hands-on education in the “real” world, WBL opportunities are sort of like putting training wheels on a bike—kids get a taste of what it’s like to work in a specific career, but they do so with extra support and under the watchful eye of someone who’s already mastered the skills.

In Ohio, WBL options include internships, apprenticeships or pre-apprenticeships, simulated work environments, and entrepreneurship. Which of these is best for an individual student depends on a variety of factors. But apprenticeships are arguably the most intriguing, as they are earn-and-learn opportunities. They offer students the chance to explore a career, develop soft and industry-specific skills, and receive mentorship from experienced professionals, all while getting paid. They often culminate in industry-recognized credentials or postsecondary credit. And they benefit employers, too; they can help build a stronger, more diverse talent pipeline, reduce employee turnover, and offer a return on investment.

Although it has a solid structure for adults, Ohio has some work to do on youth apprenticeships. Most students and families don’t even realize they’re an option. Those that do often discover that meaningful opportunities aren’t available in their region or career field. If Ohio wants to capitalize on the potential of apprenticeships, it needs to do better.

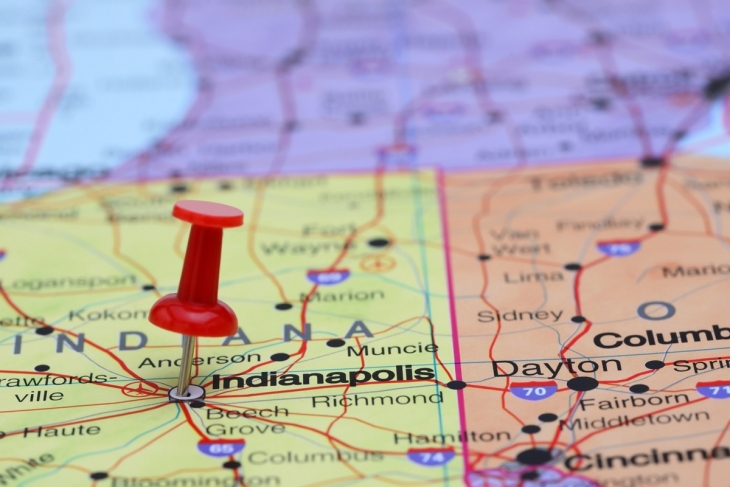
Indiana shows us how. The Hoosier State’s Modern Apprenticeship Program (MAP) connects high school juniors in central Indiana with paid, real-world work experience in high-demand industries. Because MAP aims to prepare students for “sustainable employment,” it focuses on industries that drive the local economy—advanced manufacturing, business operations, the construction trades, education, financial services, healthcare, and information technology. The program, which is year-round and occurs during and after school, is open to all students who are on-track to graduate and doesn’t require any previous experience.

Although there is no financial cost for students to participate, MAP does require a three-year time commitment. In the first year, students typically take classes at school in the morning and then work 10–16 hours a week at their apprenticeship. During the second year—a student’s senior year of high school—apprenticeship time increases to 20–24 hours a week. In their third year, once they’ve graduated from high school, students have three options:

  1. Attend a local college full-time and work part-time with their employer.

  2. Attend a local college part-time and work full-time with their employer.

  3. Work full-time with their employer and continue working on an industry-recognized certification or credential.

According to EmployIndy, the workforce intermediary that oversees MAP, the program recently totaled 152 apprentices across 53 employers. Approximately 91 percent of apprentices stay with their employer after completing the program. And for every $1 they invest, employers see an average return of $1.47. Participating students receive classroom and on-the-job training, mentorship, and valuable experience, all while earning money (pay starts at $13 an hour and increases incrementally) and getting a head start on college or career. Moreover, because the program focuses on employers that drive the local economy, the broader community benefits, as well.

In short, MAP is proving beneficial for everyone involved. Given its success, Ohio leaders should be eager to establish a similar program here. The good news is that going all-in on high school apprenticeships won’t require reinventing the wheel. In fact, Ohio already has a blueprint courtesy of its High School Tech internship program, which was launched by the governor’s Office of Workforce Transformation (OWT) in 2021. As part of this initiative, employers who hire high school interns in tech-related roles can be reimbursed up to 75 percent of intern wages, with a cap at $5,000 per intern. The program is administered by competitively selected regional intermediaries that are responsible for conducting outreach to businesses and educational entities as well as recruiting, interviewing, and placing interns.

Apprenticeships—especially MAP’s three-year program—are a lot more in-depth and time-intensive than Ohio’s internship program, which employs students just for a summer. In fact, that’s likely why MAP’s participation number is relatively small in comparison (152 apprentices in Indiana compared to nearly 1,000 interns in Ohio during the summer of 2024). And unlike the High School Tech internship, MAP is a regional program, not a statewide one. But both programs are run by regionally-focused intermediaries. And while they differ in how much time and effort they require from students and employers—and how much planning and support they’ll need to get off the ground—they’re both valuable investments in students and communities. 

The ultimate goal of career-connected learning is to provide students with pathways that offer a combination of rigorous academics and high-quality training that leads to a stable, well-paying job. Apprenticeships are a key part of accomplishing that goal, and Indiana has provided Ohio with an excellent roadmap. Here’s hoping Ohio leaders seize the opportunity.

Policy Priority:
Standards & Accountability
Topics:
Career & Technical Education
Chester E. Finn, Jr.
3.2.2026
U.S. Department of Education building
Thomas Hawk/Flickr
Listen to this article
Loading the Elevenlabs Text to Speech AudioNative Player...

Thank you, Amber! My colleague Amber Northern, Fordham’s longtime senior vice president for research, has done American education a great service by recommending a future for the Institute for Education Sciences that goes far beyond undoing the damage done by DOGE a year ago.

On sabbatical from Fordham for seven months and—at the invitation of Secretary McMahon—detailed to the U.S. Department of Education under the Intergovernmental Personnel Act (IPA), Amber, with help from a solitary research assistant (plus beaucoup interested parties, some invited, some self-invited), produced a 95-page report, subtitled “a strategy for relevance and renewal,” which the powers-that-be, after some dithering, finally made public on Friday at mid-day. Endorsements from those powers were cordial but guarded, as you can see in the accompanying press release, though acting IES director Matthew Soldner separately issued a thoughtful and supportive message via blog.

That’s because, as best one can tell from outside, the administration itself has made no decisions about what actually to do with IES—as it gradually seeks to “eliminate” the Education Department itself, so far by cutting staff, attempting to cut budgets, and outsourcing various programs and duties to other agencies. This silence—or indecision, political wariness, whatever—serves, of course, to make the entire education field less trusting and confident regarding future developments. (Meanwhile, Congress keeps adding funds to various IES activities—and other Department programs—that the White House keeps trying to shrink or zero out.)

How to think about reconstructing IES’s central function within that unwanted department—especially with vast uncertainty as to whether Congress will ever update the aging (2002) Education Sciences Reform Act that created IES? Many of the reforms proposed by Amber could be undertaken under current law, but several major recommendations would require legislative action “should Congress choose to reauthorize ESRA.” These include building a lot more flexibility for states into the “regional labs” program and empowering IES to do direct procurements of cutting-edge projects rather than struggling through the department’s glacial grants-and-contracts unit.

At the core of Amber’s recommendations for the future of IES are six “big shifts.” You can (should) read them for yourself, both in the executive summary and longer justifications, but here’s the gist, with some comments by me.

1: Rather than spreading resources across many disconnected projects, IES should focus on the most urgent education challenges, informed by state and district leaders.

Focusing scarce resources on urgent (and upcoming) challenges makes all kinds of sense. Who should decide what those are is more complicated. The “informed by state and district leaders” part was to be expected, considering the administration’s pledge to return education to the states. One must ask, however, whether gathering advice in that way can ever yield a coherent and worthwhile agenda for a federal agency that should instead (in my view) be leading states and districts into the future, while also helping with a finite list of current challenges that are actually amenable to research and/or data. At the same time, I’m mindful of angst in the field that entrusting such priorities to whatever administration is in power will lead (as we’ve seen at CDC, FDA, etc.) to idiosyncratic and politicized choices. The least bad governance resolution that I can see—built into the 2002 authorizing legislation—is to appoint top-notch, independent leadership for IES plus a robust, apolitical National Board for Education Sciences that includes wise folk from states and localities, as well as science, statistics, and education practice. But “independence” isn’t likely to appeal to the present administration—and perhaps beyond—in this era of the “unitary executive.”

2: Instead of funding multiple data collections and longitudinal surveys that may be redundant or outdated, the National Center for Education Statistics (NCES) should develop a streamlined and coordinated data strategy while preserving and strengthening its vital core functions, such as the Nation’s Report Card.

If you don’t read anything else in this report, focus on the 20 pages that address the National Center for Education Statistics (NCES), the beating heart of IES, the part that can trace its origin to Lincoln’s time, the place from which we get most of the data on which everything else depends—including those state and local policies so dear to the administration—and the part of NCES that DOGE did the worst damage to. (Gutting veteran statistical experts is leading, for example, to some deterioration in the quality of state data collection, which is a prerequisite for reliable national data.) It’s important to note, though, that Amber’s recommendations go so much further than rebuilding. They amount to a full overhaul of NCES’s core functions (and trimming the non-core and duplicative kind) and are especially smart about longitudinal data and NAEP—the Nation’s Report Card. If nothing else in this report gets acted upon, may it please be the overhauls spelled out here!

3: Rather than focus on individual or project-specific grants within a single state, institution, or jurisdiction, IES should prioritize multi-state awards to help scale the most promising interventions, resources, and policies.

Obvious, desirable, and commonsensical (but why hasn’t that been past practice?)

4: Direct the focus of the research work towards practicality, innovation, and relevance.

Another one that’s hard to quarrel with, though it leaves open the question of who decides. (See Big Shift #1.)

5: IES should build mechanisms by which the applied research and technical assistance work of its Regional Educational Labs (RELs) is responsive, timely, and coordinated, as well as shared across the country.

For 40 years, I’ve questioned the value of the “regional labs,” and in the present era, they’re less needed than ever. But they’re embedded in statute, they’ve got lobbyists and protectors, and apparently nobody has the stomach to go to war against them. That being the case, read the fine print of Amber’s recommendation because it would build in a lot of needed flexibility for states to make use of the labs.

6: Narrow the scope of the What Works Clearinghouse (WWC) to the development of practice guides and tools and ensure that its evidence base is better utilized.

The WWC was a great idea, now spread too thin and often lacking certainty about what actually does work. So tighten it and get it to concentrate on what it does best.

Finally, let me cite Amber’s wise words as to why rehabilitating and modernizing IES is worth doing and the “bedrock” principles that such an overhaul should preserve:

Executing on the big shifts in the prior section will be a heavy lift. These are not nips and tucks, as IES is struggling in multiple ways to remain relevant and responsive. But let’s also remember that it is an entity worth redemption and revitalization, precisely because its work has the potential to empower those who deliver education to the American people, meaning state and local leaders, school leaders, teachers, and the broader public, including parents.

Some of the bedrocks of IES revitalization that must carry forward include its independence, scientific integrity, statistics infrastructure, and rigorous research across diverse settings.

Well done, Dr. Northern (and welcome back to Fordham)! The country and education field owe you big thanks. Now may the “powers that be” seize this baton and carry it across the finish line. If they can do that while allowing for the “independence,” “scientific integrity,” and “rigor” that IES and the field need, it will more than make up for the damage done a year ago. It will, in fact, do American education a great deal of good.

Policy Priority:
High Expectations
Topics:
Accountability & Testing
Evidence-Based Learning
Governance
Teachers & School Leaders
Jeff Murray
3.2.2026
Gadfly Bites logo
Listen to this article
Loading the Elevenlabs Text to Speech AudioNative Player...

News stories featured in Gadfly Bites may require a paid subscription to read in full. Just sayin’.

  1. The spotlight is on tiny little Steubenville City Schools again via this update of a National Public Radio piece from April 2025 and a revisit to the Sold a Story podcast episode about how “astonishing” and unusual long-term success in teaching reading to youngsters in a high-poverty school is. Steubenville has bucked the trend for enough years now that its success is considered “permanent” and thus it is even more worthy of study and emulation than ever before. I am confident that the teachers and families down there will just keep on doing what they’re doing, but can you imagine the coverage and headlines should their outcomes slip even a little bit in the future? I shudder to think. (Reveal, 2/28/26)

Did you know you can have every edition of Gadfly Bites sent directly to your Inbox? Subscribe by clicking here.

Policy Priority:
School Funding
Topics:
Governance
Aaron Churchill
2.27.2026
Ohio report card - overall calc blog image
Getty Images/Sergey Aksenov
Listen to this article
Loading the Elevenlabs Text to Speech AudioNative Player...

This is the fourth and last piece in a series that examines elements of Ohio’s school report card that could use refinement (previous articles covered chronic absenteeism, early literacy, and college and career readiness).

A wave of news stories and commentary have raised alarms about the grade inflation plaguing American high schools and universities. Report cards chock-full of easy A’s hide the truth from parents, weaken incentives to learn, create cultures of low expectations, cheapen grades and the diplomas based on them, and may even diminish students’ long-term economic prospects.

Unfortunately, grade inflation has also crept into Ohio’s school report card system (and other states, too), with many of the same consequences accruing to students, parents, and the general public. Peachy school ratings are most apparent and troubling in the “Overall” ratings given to Ohio schools.

The Overall rating and its mechanics

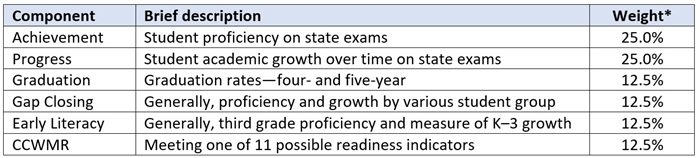
For more than two decades, Ohio has issued an Overall rating to districts and schools. This “summative” mark is supposed to offer a clear and user-friendly picture of academic performance across the various report card measures. Table 1 shows the current framework used to combine results. Each component contributes a certain weight to the Overall calculation, with “Achievement” (student proficiency) and “Progress” (academic growth) receiving the greatest emphasis. Starting in 2023, Ohio began issuing Overall ratings via a 1- to 5-star system.

Table 1: Ohio’s report card components and weights for calculating an Overall rating

Ohio report card - overall calc blog table 1
Notes: (*) Weights are adjusted proportionally when a component does not apply to a school. CCWMR = College, Career, Workforce, and Military Readiness. This document contains more technical detail about each component.

The Overall rating offers an essential bottom-line that helps the general public make sense of the disparate ratings and education data. The weighting system is sensible, too, as it rightly ensures that student proficiency and growth drive the ratings. Stars are transparent and easy to understand, albeit softer-sounding (for mediocre to low performers) than the state’s previous A–F system.

The inflationary problem, however, lies in the technical details. Specifically, the way Ohio translates the points earned on the various components into an Overall rating. Simply put, the method results in higher Overall ratings than what we would expect based on schools’ underlying results.

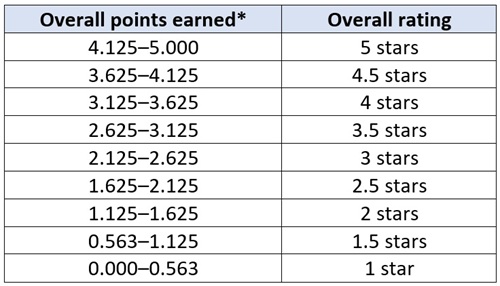
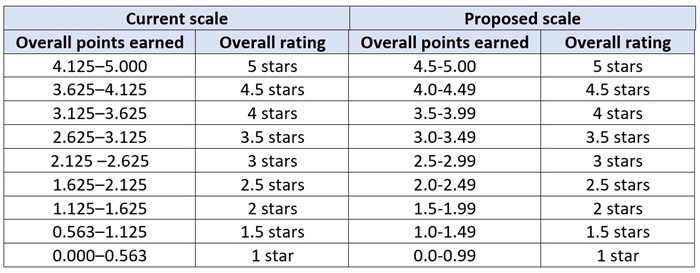
Table 2 displays the grading scale, with the left column representing the total points earned on the components and the corresponding Overall rating on the right. It’s hard to see at first, but upon close inspection, there is a significant misalignment between the points earned (based on the components) and the star rating. For instance, a school receiving 4.125 points receives 5 stars, even though its point total is closer to 4.5 stars. At the bottom of the scale, a school earning 0.75 points receives 1.5 stars, even though the 1-star rating is the nearest mark.

Table 2: Grading scale for the Overall rating

Ohio report card - overall calc blog table 2
Note: (*) The overall points earned is a weighted average number of points earned across the report card components. Schools receive 0 to 5 points for each component (except Progress) in quarter-point increments, based on the underlying data. For Progress, schools receive 1 to 5 points in whole-point increments based on their star rating. For more technical detail, see this document.

How the grading scale inflates ratings

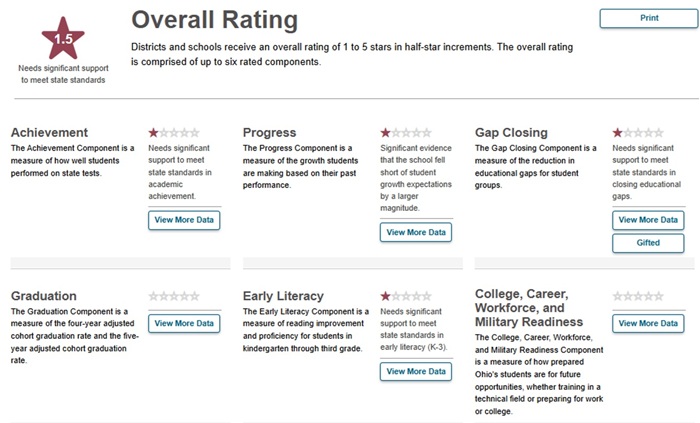
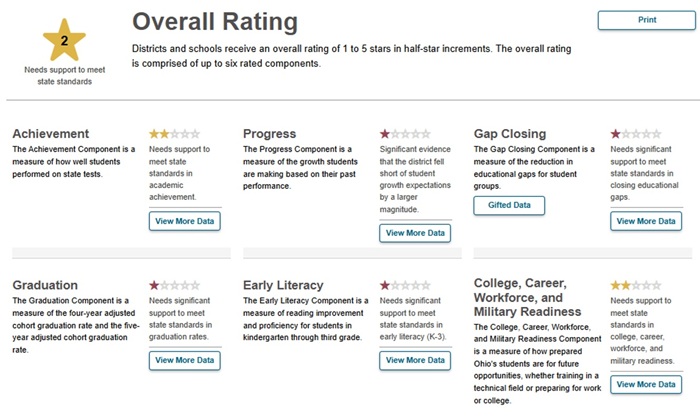
What are the real-world implications of this grading scale? Consider the report card for Valerie Elementary School in Dayton. It receives 1-star ratings on all of its components, yet strangely enough, receives a 1.5-star Overall rating. Another oddball is Lima City Schools. Despite receiving 1-star ratings on four of six components (including a heavier weighted one), the district ended up with a 2-star Overall rating.

Figure 1: Valerie Elementary (top) and Lima City Schools (bottom) report card, 2024–25

Ohio report card - overall calc blog figure 1a


Ohio report card - overall calc blog figure 1b

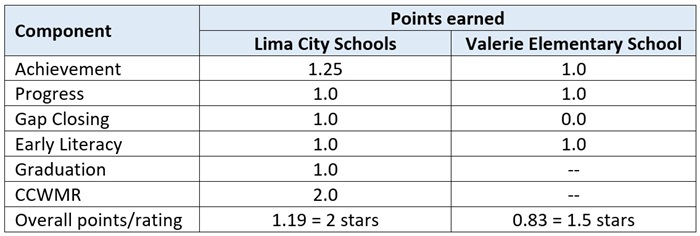
These counterintuitive Overall ratings are the direct result of the grading scale. As Table 3 shows, Lima City Schools earned 1.19 overall points, but that total was generously “rounded up” all the way to 2 stars. Valerie’s 0.83 points generated 1.5 stars, even though the point total was closer to the 1-star mark.

Table 3: Examples of Overall rating calculations

Ohio report card - overall calc blog table 3
Note: The table displays the points earned for each component—not the star ratings. The note below Table 2 has details about the points system.

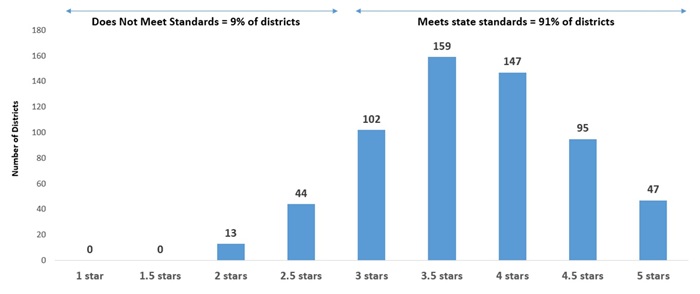
The lenient grading system gives schools statewide a roughly half-star boost. As Figure 2 shows, far more districts received top marks last year than low ratings. In fact, not a single district received 1 or 1.5 stars. The chart also indicates that 91 percent of districts received an Overall rating of 3 stars or above, which state law interprets as “meeting or exceeding state standards,” while just 9 percent of districts received less than 3 stars.

Figure 2: District-level Overall ratings, 2024–25

Ohio report card - overall calc blog figure 2

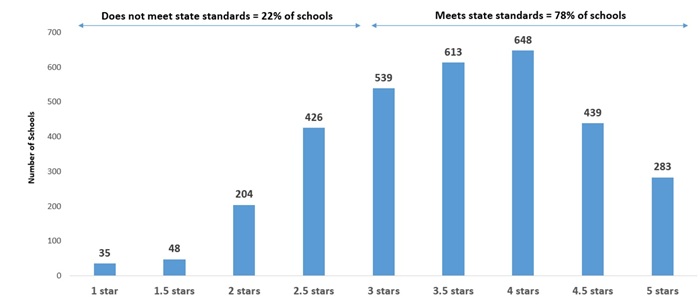
At a school level, Figure 3 shows that 78 percent of Ohio schools received 3 stars or above versus 22 percent below that mark. Just 2.5 percent of schools received an Overall rating of 1 or 1.5 stars. Roughly one third of the low-rated schools were early elementary schools for which the more conventional Achievement and Progress ratings did not apply.

Figure 3: School-level Overall ratings, 2024–25

Ohio report card - overall calc blog figure 3

Raising the bar

Much like inflating student grades is not a “victimless crime,” taking it easy on schools also hides the truth from parents and the public. Ohio’s Overall rating system deems 9 in 10 districts as “meeting state standards,” a rate that is out-of-touch when only 6 in 10 students achieve proficiency on state exams and many have struggled to recover academically post-Covid. Softened ratings also allow low-performing districts and schools to escape public scrutiny and accountability from local communities. For instance, Lorain and Dayton school districts registered abysmal proficiency rates of 25 and 27 percent, respectively, and demonstrated no evidence of academic progress last year. Yet both received 2 stars Overall—a semi-decent rating that papers over students’ academic challenges and the ineffective instruction they receive from their schools. Without a red flag, few community members will likely be stirred to ask questions or push for improvements. Parents may be lulled into thinking their child’s district or school is satisfactory when superior options are at hand.

Ohio needs to bring its Overall ratings back to reality. The simplest approach is revising the grading scale, which the Ohio Department of Education and Workforce can modify through administrative rule. Table 4 shows a straightforward option that would raise performance benchmarks and alleviate some inflationary pressure. Under this framework, 4.5 to 5.0 points would be needed to earn an Overall 5-star rating, 4.0 to 4.5 points would generate 4.5 stars, and so forth. This grading scale would more tightly align component ratings with the Overall star ratings, while also removing the artificial bump that schools systematically receive. For instance, under the proposed framework, Valerie would have received 1 star and Lima 1.5 stars Overall—marks that are more consistent with their underlying component ratings.

Table 4: Proposed change to the Overall grading scale

Ohio report card - overall calc blog table 4

The Overall rating is the most important and visible way that Ohio communicates school quality to parents and the general public. Schools that merit solid Overall ratings should receive them, and failing schools should be clearly identified as needing significant help. Unfortunately, the state’s current method for producing its summative rating misses the mark. Ohio policymakers need to recalibrate the Overall grading scale to give parents and communities an honest bottom-line assessment of school and student performance.

Policy Priority:
Standards & Accountability
Topics:
Accountability & Testing
The Education Gadfly
2.27.2026
Gadfly Guy
Listen to this article
Loading the Elevenlabs Text to Speech AudioNative Player...

WHAT WE’RE READING

“More than 70 percent of the parents said they trust grades more than tests for making decisions about their own child, and fewer than 9 percent said they had more confidence in tests,” writes Jill Barshay, examining results from a new study that looks at how parents respond to grades and test scores, in a review that’s well-timed to our ongoing conversation about grade inflation. —The Hechinger Report

—

Sam Bowman argues against social media bans, suggesting the internet is more like books, magazines, and TV than alcohol or tobacco, and particularly helpful for curious students around the world. —The Washington Post


Editor's note: This was first published on Mike Petrilli's Substack, SCHOOLED, a twice-weekly free Substack and email newsletter restarting the education-reform conversation.

Click here to subscribe for:

  • Sharp analysis of the week’s biggest K–12 debates

  • Curated commentary from across the ed-policy world

  • Lively discussion—including reader reactions and pushback

The Education Gadfly
2.27.2026
Gadfly Guy
Listen to this article
Loading the Elevenlabs Text to Speech AudioNative Player...

CHEERS:

In 2010, Michael Bloomberg and Joel Klein partnered with IBM to design a dual-enrollment program that let students earn a high school diploma and associate degree concurrently, with mentorship and paid internship opportunities that led to jobs in high-demand fields. Stanley Litow reflects on the success of P-TECH schools and calls for replication across the country. —The 74

—

Clinics run by Nationwide Children’s Hospital in Columbus are screening young children for reading struggles starting at age 3, part of a growing recognition that early literacy intervention can’t wait for kindergarten. —Makiya Seminera, The Associated Press

JEERS:

“Undocumented students can attend public schools for free thanks to the 1982 U.S. Supreme Court decision in Plyler v. Doe, which held that denying children an education based on immigration status violates the Constitution’s equal protection clause. That ruling remains binding federal law” …yet the Heritage Foundation “published a policy document on February 17 calling on states to intentionally enact laws or rules restricting free public education for undocumented students and calling on the highest court to overturn the landmark decision.” —Ileana Najarro, Education Week

—

“In a unanimous decision, the Kentucky Supreme Court affirmed a lower court’s ruling that charter schools, as structured under HB 9, fall outside Kentucky’s constitutionally defined ‘common school’ system. Because of that, justices said, the General Assembly cannot direct public tax dollars to charter schools without first obtaining voter approval.” —Kelsey Souto, WKYT

—

States are increasingly mandating cursive instruction, even though the claimed benefits don’t hold up to scrutiny. “As everyone who has ever written by hand knows, cursive is not the only way to do it. The other way, of course, is print writing. It seems cursive’s proponents are taking a general research claim—that writing by hand is better for learning than typing—and conflating it with the more specific claim that writing in cursive is better.” —Greg Fournier, Education Next


Editor's note: This was first published on Mike Petrilli's Substack, SCHOOLED, a twice-weekly free Substack and email newsletter restarting the education-reform conversation.

Click here to subscribe for:

  • Sharp analysis of the week’s biggest K–12 debates

  • Curated commentary from across the ed-policy world

  • Lively discussion—including reader reactions and pushback

Pagination

  • First page « First
  • Previous page ‹ Previous
  • Page 51
  • Page 52
  • Page 53
  • Page 54
  • Current page 55
  • Page 56
  • Page 57
  • Page 58
  • Page 59
  • Next page Next ›
  • Last page Last »
Fordham Logo

© 2026 The Thomas B. Fordham Institute
Privacy Policy
Usage Agreement

National

P.O. Box 110
Burke, VA 22009

202.223.5452

[email protected]

Ohio

P.O. Box 82291
Columbus, OH 43202

614.223.1580

[email protected]

Sponsorship

130 West Second Street, Suite 410
Dayton, Ohio 45402

937.227.3368

[email protected]