As the sector’s gatekeepers, charter school authorizers are responsible for ensuring that schools in their purview set students up for success. But can authorizers predict which schools will meet that standard?
To find out, University of Southern California assistant professor Adam Kho, and his coauthors, Shelby Leigh Smith (USC) and Douglas Lee Lauen (UNC), examine the extent to which authorizers’ evaluations of charter school applications predict the initial success of the schools that are given the green light.
Overall, the results suggest that authorizers can distinguish between stronger and weaker applicants–even if they don’t have a crystal ball.
Download the full report or read it below.
Foreword
By David Griffith and Amber M. Northern
Like everyone else, we education reformers would love to have a crystal ball. Yet, in practice, predicting the performance of schools, like almost every other form of prediction, is inherently challenging.
Still, it’s essential that we do our best, particularly when it comes to forecasting the performance of proposed charter schools. After all, despite the growing pile of research that suggests charter schools outperform traditional public schools on average, the U.S. has too many mediocre or downright bad charters and too few truly excellent ones.
That’s why the National Association of Charter School Authorizers (NACSA) has developed various resources that outline “best practices” for its members (and other authorizers) to use when reviewing the plans of would-be schools. But as sensible as these practices are, they are largely the product of accumulated wisdom and experience. And there are certain questions, such as whether some practices make a bigger difference than others and where those reviewing charter school applications should focus their attention, that they cannot answer.
Thus, the need for empirical research on the evaluation of proposed charter schools by authorizers. Yet there has been strikingly little investigation of this vital subject, with the exception of a 2017 Fordham report, Three Signs That a Proposed Charter Schools is at Risk of Failing,[1] and NACSA’s subsequent expansion of that analysis.[2] For example, to our knowledge, there is essentially no research on one of the most fundamental questions—namely, whether the applications that authorizers rate more highly tend to become schools that perform more strongly.
One reason for that is bulky, non-comparable data. Actual charter applications are rather cumbersome, and their format varies from one authorizer to the next. But an even bigger challenge is sample size. Nationally, only a handful of entities have authorized enough schools to make a rigorous quantitative analysis possible.
Which brings us to North Carolina, where the state’s sole authorizer, the State Board of Education, has now presided over the creation of more than one hundred schools[3] and the closure of more than twenty-five low-performing or struggling schools[4] since the abolition of the statewide cap in 2011, making it the exclusive overseer of one of the largest charter school portfolios in the land.[5]
That made us wonder what we might learn from North Carolina’s charter authorizing experiences. After all, the Fordham Foundation in our home state of Ohio serves as a non-profit authorizer to ten charter schools (a role it has played for nearly two decades) that collectively educate over 6,300 students. And, despite the fact that our performance on that front is consistently deemed “effective” by the Ohio Department of Education and Workforce Development, we haven’t always gotten it right when it comes to identifying the diamonds in the new-school-application rough. Thus, the results of this study are more than “research” to us.
Those results came to us courtesy of Adam Kho, an assistant professor and rising star at the University of Southern California who is well known for his work on school turnaround and charter schools and who, like us, was interested in examining how authorizers might increase the likelihood that new schools get a strong start.
With the assistance of his coauthors, Shelby Leigh Smith and Douglas Lee Lauen, and the North Carolina Department of Public Instruction, Adam constructed a unique dataset that includes the ratings external reviewers gave to specific portions of proposed schools’ written applications; the votes members of the state’s Charter School Advisory Board took after reviewing those applications (and interviewing the most promising candidates); and the outcomes of students in newly approved schools.
Because the data are limited to the period after North Carolina lifted its charter cap and the pandemic struck, Adam and company were able to analyze the evaluations and votes that determined the fate of four cohorts of applications and then follow those schools that were approved for one to four years after they opened. That amounts to 179 applications, fifty-three approved applicants, and forty-three schools that actually managed to open their doors.
So, what did they find?
First, schools that more reviewers voted to approve were more likely to open their doors on time but no more likely to meet their enrollment targets. In other words, there is some evidence that reviewers were able to identify applicants that had their ducks in a row (though many schools that received fewer votes from reviewers also opened on time).
Second, schools that more reviewers voted to approve performed slightly better in math but not in reading. In other words, reviewers’ collective judgment also said something about how well a new school was likely to perform academically (though again, most of the variation in new schools’ performance was not explained by reviewers’ votes).
Third, ratings for specific application domains mostly weren’t predictive of new schools’ success, but the quality of a school’s education and financial plans did predict math performance. Importantly, these domain-specific ratings were based exclusively on evaluations of schools’ written applications (unlike reviewers’ final votes, which also reflected their interviews with applicants and whatever other information was at hand).
Finally, despite the predictivity of reviewers’ votes, simulations show that raising the bar for approval would have had little effect on the success rate of new schools. For example, reducing the share of applications that were approved from 30 percent to 15 percent wouldn’t have discernibly boosted approved schools’ reading or math performance, nor would increasing the number of “yes” votes required for approval. (Note that it is impossible to assess the implications of lowering the bar for approval, since the requisite schools were never created.)
What does all of that imply for authorizing in North Carolina, the seven other states with a single (statewide) authorizer, and the thirty-six states with some other combination of state and/or local authorizers?
Given the diversity of approaches that states have taken to authorizing—and their geographic and demographic diversity—caution is warranted. But in our considered opinion, which is also informed by Fordham’s own authorizing work, the findings suggest at least three takeaways.
First, authorizers should pay close attention to applicants’ education and financial plans. Per Finding 3, the quality of these plans significantly predicts the resulting schools’ math performance (unlike other elements of the application, such as the perceived quality of a school’s mission statement). Based on Fordham’s experiences as an authorizer, our sense is that’s no coincidence, as instructional prowess and budgetary competence are quite simply “must-haves.”
Second, authorizers should incorporate multiple data sources and perspectives. Like a strong cover letter, a well-written charter school application is a sign that an applicant deserves serious consideration. But, of course, the decision to approve should also reflect those intangibles—largely but not exclusively gleaned from face-to-face interviews—and the age-old adage that two heads are better than one.
Finally, authorizers must continue to hold approved schools accountable for their results. After all, we know that the quality of charter schools, like the quality of individual teachers, varies drastically once they are entrusted with the education of children. So, if we can’t reliably weed out low performers before they are approved, the only surefire way to ensure that charters fulfill their mission is to intervene when their performance consistently disappoints (meaning, in this case, that chronically low-performing schools should be drastically overhauled or closed).
To be clear, the latter is not our preferred outcome. But so long as a minority of approved charters underperforms, we see no alternative.
Someday, perhaps, the guidance that empirical research provides to authorizers will make the process for approving new schools feel more scientific and less dependent on human judgment—or on that crystal ball that so often fails us. Until then, we’ll just have to take it one application at a time.
Introduction
Dozens of studies have demonstrated that charter school performance varies dramatically. Even within communities where charters clearly outperform traditional public schools on average, there are often any number of charters that perform worse. Consequently, analysts have moved beyond the question of whether or not charters are more effective on average to the question of why some charters do better than others and how best to predict which schools will be successful.
As the charter sector’s gatekeepers, authorizers are responsible for ensuring that schools in their purview set students up for success. To that end, they provide various forms of scrutiny and technical assistance, decide whether existing schools’ charters should be renewed, and—perhaps most important—set the bar for the approval of new schools. Yet, while prior research has examined how the content of charter applications predicts the academic performance of newly created schools,[6] there is almost no research on the actions taken by the charter authorizing body during the approval process. Such information might help authorizers improve those processes with the goal of strengthening their school portfolios. Accordingly, this study examines the extent to which the ratings of application reviewers and their votes on authorization predict the success—or, at least, the initial success—of schools that are authorized.
More specifically, the study answers the following research questions:
- Does the share of reviewers who vote to approve a charter school application predict indicators of initial success such as opening on time, meeting enrollment targets, and year-to-year growth on standardized tests?
- Do charter schools experience more initial success if they have higher ratings for specific domains of their written application (e.g., their education, governance, or financial plans)?
To answer these research questions, we use data on application ratings and votes from the North Carolina Charter School Advisory Board (CSAB), as well as seven years of student-level administrative data. To our knowledge, this study is the first to examine how well authorizers’ ratings of applications predict charter school success.
Background
Only a handful of studies have examined how the characteristics and behaviors of charter school authorizers predict the success of the schools they authorize. Of these, about half have focused on how the type of charter authorizer (e.g., state agency, local school district, or higher educational institution) relates to student achievement in the schools that get authorized. Specifically, two earlier studies concluded that there was little variation in school quality among authorizer types (with the exception of nonprofit organizations, which perform worse than other types).[7,8] In contrast, a more recent study finds that schools authorized by the mayor’s office perform better than those authorized by higher education institutions.[9]
In addition to this work, a few studies have examined the specific features of the application document or process that predict approval. For example, an examination of charter applications in the Recovery School District in New Orleans found that external evaluator ratings of applications strongly predicted charter approval (whereas naming a specific principal in the application, prior experience operating another school, and board member experience were more weakly related).[10] Similarly, a study conducted by the National Association of Charter School Authorizers found that certain types of schools (e.g., classical and “no excuses” schools) were more likely to be approved, as were schools affiliated with a network and those with support from a philanthropic or community organization.[11]
Finally, a 2017 report by the Fordham Institute looked for characteristics of charter school applications that predicted school failure, as measured by proficiency rates below the twenty-fifth percentile and academic growth below the fiftieth percentile.[12] Ultimately, the report identified three risk factors: lack of identified leadership, proposing to serve at-risk students without sufficient academic supports, and child-centered curricula (e.g., Montessori).
In sum, most prior studies have focused on the content of school applications, rather than the evaluations and/or votes of the authorizing body, and the one study that did consider evaluator ratings only considered the odds of charter approval. To our knowledge, no study has examined how authorizers’ ratings of applications predict charter school success.
The North Carolina Context
The story of North Carolina’s charter sector begins with the passage of the Charter School Act in 1996. The following year, twenty-seven charter schools opened, and the number of operational schools continued to increase until 2001, when the sector first encountered the statewide cap of 100 charter schools established by the Act. After a decade of essentially no growth, that cap was lifted in 2011, at which point the state received a large influx of charter applications (see Table 1). Since then, the number of charters in North Carolina has grown to more than 200, serving nearly 10 percent of the state’s public school population.[13] By law, every one of those schools was approved by the Tar Heel State’s one and only authorizer, the State Board of Education. In other words, North Carolina is one of just eight states (out of the forty-five with charter laws) where the state education agency or a similar state-level board is the sole authorizer.[14]
During the study period, which stretches from the abolition of the statewide cap to the arrival of Covid-19 (i.e., from 2012–13 to 2018–19), charter applications were first submitted to the state’s Office of Charter Schools, where they were evaluated for completeness and then reviewed and assigned a rating of “pass or fail” for each domain by up to fourteen external evaluators, who were selected by the Office of Charter Schools based on their experience operating existing charter schools. Next, members of the CSAB reviewed applications and external-reviewer ratings and conducted first-round “clarification interviews” with applicants, the most promising of which received a second “full interview.” Finally, based on the contents of the application, the external reviewers’ ratings, and the information gathered in interviews, CSAB members voted on whether or not to recommend the application for approval, with members who had a conflict of interest recusing themselves. Applications that received a simple majority of “yes” votes (51 percent) were forwarded to the State Board of Education (SBE), which accepted CSAB’s recommendations over 90 percent of the time.
The CSAB members were appointed by the state’s General Assembly and the State Board of Education and served on a voluntary basis for a maximum of two four-year terms. CSAB consisted of eleven voting members, all of whom were required to demonstrate an understanding of and commitment to charter schools as a strategy for strengthening public education to be appointed.[15] In practice, nearly all CSAB members had experience working in North Carolina’s charter schools, with two-thirds having served as the director, founder, and/or principal of a charter school.[16] Both CSAB members and external reviewers completed trainings on the scoring process and how to norm their assessments.
The study period spans two CSAB terms, with a transition between those reviewing applications for charter openings in school years 2014–15 and 2015–16. With the exception of this transition, the board remained fairly stable. Moreover, several members from the first term also served in the second term.
In 2023, as a result of changes to North Carolina law, CSAB was reconstituted as the Charter School Review Board (CSRB), which now bears primary responsibility for charter school authorization. Schools that are rejected by CSRB can appeal that decision to the State Board of Education.
Data
To address our research questions, we used two primary datasets. First, we collected charter school applications from the North Carolina Department of Public Instruction (NCDPI) website, which included scores on individual domains for each application as well as overall review votes from CSAB members.[17] Of the six reviewed domains, five were included in the analysis:[18]
(1) Mission and Purposes described the mission, purpose, and goals of the proposed charter school, as well as the targeted student population.
(2) Education Plan described the proposed charter school’s standards, curriculum, and instructional design, including specific instructional plans for “at-risk” students and students with disabilities, as well as its discipline policies.
(3) Governance and Capacity described the structure and responsibilities of the governing organization (e.g., school board); the projected staff required including hiring, management, evaluation, and professional development plans; plans for enrollment, marketing, and parental and community involvement.[19]
(4) Operations described school plans for transportation, school lunch, insurance, health and safety, and facilities.[20]
(5) Financial Plan described the budget for the school, including expected income and expenditure projections for the first five years of operation.
For each domain, anywhere from two to fourteen external reviewers scored each section of the application as “pass” or “fail.”[21] After the “full” interviews, CSAB members voted on whether the school as a whole should be recommended for approval, with ten board members in the average vote and at least seven board members participating in each vote.
We combined the application rating data with student-level administrative data maintained via a partnership between NCDPI and the Education Policy Initiative at Carolina, which include information on the demographic characteristics and achievement of all students in North Carolina charter schools, as well as characteristics of schools, including grade span and urbanicity.
Our analysis focuses on the seven years after the state charter school cap was lifted but before the Covid-19 pandemic (i.e., 2012–13 through 2018–19). Because the charter school application process requires time, applications that were submitted in the first year after the charter cap was lifted (i.e., 2012–13) did not result in charter school openings until at least 2015–16. Consequently, we focus on the four cohorts of applications that were submitted between 2012–13 and the summer of 2017, which would have allowed schools to open in 2018–19.
Table 1 shows the number of applications submitted, recommended by CSAB, and approved by the State Board of Education in each year, as well as the number of schools that opened after being approved. Per the table, in the first round of applications after the charter cap was lifted, seventy-one proposals were submitted with the intention to open in two years if approved. However, only twelve were recommended by CSAB for SBE approval, and only eleven were approved, of which ten opened by the target year (i.e., 2015) and one opened the following year.
Perhaps as a result of this low approval rate, in the following three years, fewer applications were submitted, and CSAB’s recommendation rate increased. On average, CSAB recommended approximately one-third of the applications it received for approval, and SBE continued to approve nearly all the applications recommended by CSAB. However, on-time opening rates decreased significantly for later cohorts, with as few as 30 percent of approved charters opening on time two years after submission (i.e., application year 2015).
Table 1. North Carolina charter applications by year
| APPLICATION YEAR (YEAR TO OPEN) |
APPLICATIONS SUBMITTED |
APPROVED BY SBE |
RECOMMENDED BY CSAB | OPENED ON TIME |
OPENED LATE |
NEVER OPENED |
| 2013 (2015) | 71 | 12 | 11 | 10 | 1 | 0 |
| 2014 (2016) | 42 | 20 | 17 | 11 | 3 | 3 |
| 2015 (2017) | 28 | 11 | 10 | 3 | 3 | 4 |
| 2017 (2018) | 38 | 15 | 15 | 8 | 4 | 3 |
Methods
Our analysis of the predictiveness of authorizer evaluations is based on two measures of authorizer intent:
(1) The percentage of CSAB board members who voted to recommend an application for approval.
(2) The percentage of external reviewers who gave a specific domain of the written application a rating of “pass” as opposed to “fail.”
Our measures of charter school success include four operational outcomes:
(1) Opening: a binary variable that is equal to “1” if a charter school that was approved to open did so successfully and “0” otherwise.
(2) Opening on time: a binary variable that is equal to “1” if an approved charter school opened in the year identified in its application (as opposed to opening late or not opening at all).
(3) Meeting the enrollment target: a binary variable that is equal to “1” if an approved school met or exceeded the year-one enrollment target specified in its application and “0” otherwise.
(4) Proportion of enrollment target met: a continuous variable that is equal to a charter school’s year-one enrollment divided by the enrollment target specified in its application.
In addition to these outcomes, we also consider the year-to-year growth that students in newly created charter schools exhibited on standardized reading and math tests in the first few years that the schools were operational. Depending on when a school opened, these variables may include anywhere from one to four years of growth data.
Because the average application received ten votes, for the purposes of the relevant figures, we rescale the estimates of the predictivity of CSAB board members’ votes to represent the change in a given outcome that is associated with a ten-percentage-point increase in support (i.e., the change associated with one additional “yes” vote). Similarly, we rescale the estimates of the predictivity of external reviewers’ ratings to represent the change associated with a ten-percentage-point increase in the pass rate (though because the typical application was reviewed by five to nine individuals, a ten-percentage-point increase in this variable does not translate into one additional “pass”).
To address the research questions, we use a combination of ordinary least squares regression and linear probability models. In general, these models control for observable school characteristics (e.g., urbanicity, school level, and enrollment). However, for the achievement analyses, we also control for observable student characteristics (e.g., grade, gender, race, and free- and reduced-price-meal status).
For a full description of the methods, see the Technical Appendix.
Findings
Our analysis yields four findings: First, schools that more reviewers recommended for approval were more likely to open their doors (and to do so on time) but no more likely to meet their enrollment targets. Second, students in schools that more reviewers recommended for approval made more year-to-year progress in math (but not in reading) in the first years of their existence. Third, external reviewers’ ratings of specific domains of the written application were generally not predictive of operational outcomes or initial achievement. Finally, despite the predictivity of board members’ overall recommendations, raising the bar for approval would have had little (if any) impact on schools’ initial success rate.
We discuss each of these findings in greater detail below.
Finding 1: On average, schools that more reviewers voted to approve were more likely to open their doors but no more likely to meet their enrollment targets.
As noted, our analysis of charter school success includes four operational outcomes: opening, opening on time, meeting the enrollment target, and the proportion of the enrollment target met.
Per Figure 1, schools were more likely to open (and more likely to do so on time) if more CSAB board members voted for approval. Specifically, one additional “yes” vote was associated with a nine-percentage-point increase in a school’s probability of opening and a ten-percentage-point increase in a school’s probability of opening on schedule.
In contrast, there is no relationship between the number of “yes” votes a school received and its chances of meeting its year-one enrollment target, nor is there a significant relationship between the number of “yes” votes a school received and the proportion of its enrollment target that it met.[22]
Figure 1. Charter schools that more reviewers recommended for approval were more likely to open but no more likely to meet enrollment targets.
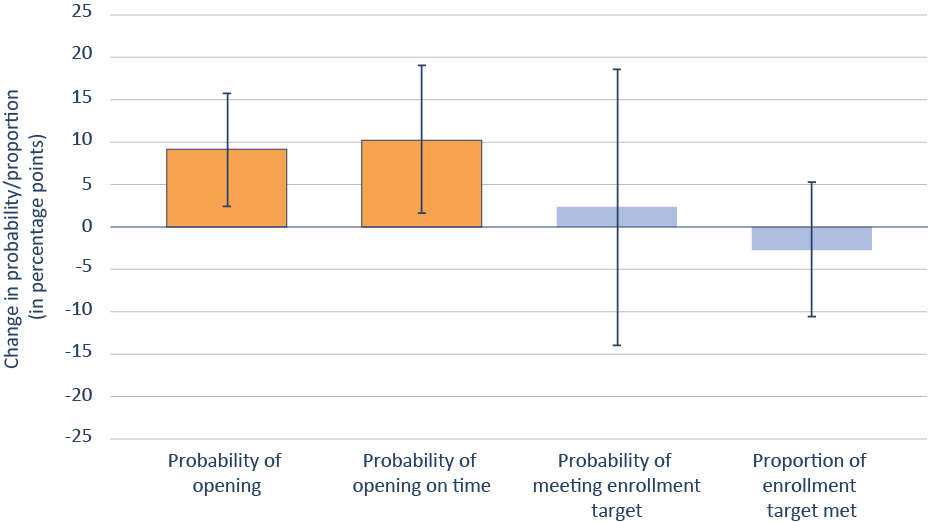
Notes: This figure shows an approved school’s probability of opening, opening on time, and meeting the year-one enrollment target specified in the charter application, as well as the proportion of the year-one enrollment target met as a function of a ten-percentage-point increase in CSAB “yes” votes. Models control for school level, urbanicity, and the projected enrollment in year one and include an application-year fixed effect. Vertical black bars show the 95 percent confidence intervals. Statistically significant results at the 95 percent confidence level have a solid black border and darker shade.
Finding 2: On average, students in schools that more reviewers voted to approve made more progress in math but not in reading.
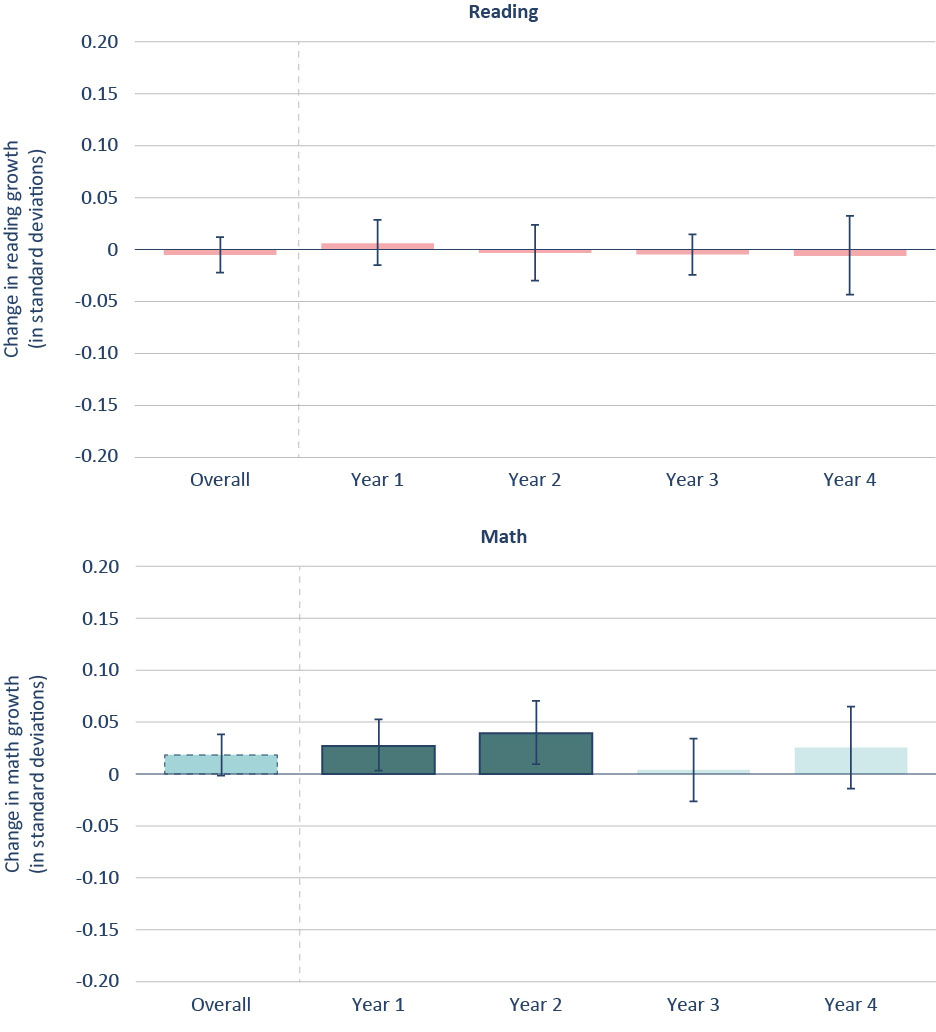
Per Figure 2, students in schools that more CSAB members recommended for approval did not make faster progress in reading. However, upon closer inspection they did make faster progress in math in the first two years of operation.
Specifically, one additional "yes" vote was associated with a 0.03 standard deviation increase in math growth in year one and a 0.04 standard deviation increase in year two. In contrast, there is no relationship between the proportion of board members who voted to approve a school and the progress its students exhibited in math in years three and four.
Note that these estimates are ultimately associational in nature. Despite the fact that we are controlling for prior achievement and other observable student characteristics, we can’t rule out the possibility that the number of “yes” votes a school receives is correlated with unobservable characteristics of students that could affect how fast they progress.
Figure 2. On average, students in charter schools that more reviewers recommended for approval made more progress in math but not in reading.
Finding 3: In general, ratings for specific application domains weren’t predictive of new schools’ success.
As noted, prior to the more holistic evaluations conducted by CSAB, each domain of a school’s written application was assigned a rating of “pass” or “fail” by up to fourteen external reviewers based solely on the materials in the application.
For the most part, these individual domain scores were not predictive of school opening or enrollment outcomes. However, a few significant or marginally significant relationships did emerge between reviewers’ assessments of specific applications domains and students’ academic progress in the first few years of a school’s existence (see Figure 3).
Specifically, a ten-percentage-point increase in the share of external reviewers who gave a school’s education plan a “pass” rating was associated with an 0.12 standard deviation increase in math growth. Similarly, a ten-percentage point increase in the share of “pass” ratings for “Financial Plan” was associated with an 0.03 standard deviation increase in math growth. In contrast, a ten-percentage-point increase in the share who assigned a “pass” rating for a school’s “governance and capacity” was associated with an 0.16 standard deviation decrease in reading growth.
In addition to these results, a higher “operations” pass rate was associated with a large increase in math growth, while a higher “mission and purposes” pass rate was associated with a large decrease in math growth; however, both results are only significant at the 90 percent confidence level.
Of the relationships discussed, the one between the quality of a school’s education plan and the progress that its students make in math is the most intuitive and seems most likely to hold lessons for those charged with evaluating future applications.
Figure 3. There is no consistent relationship between external reviewers’ evaluations of specific application domains and charter schools’ reading and math performance.
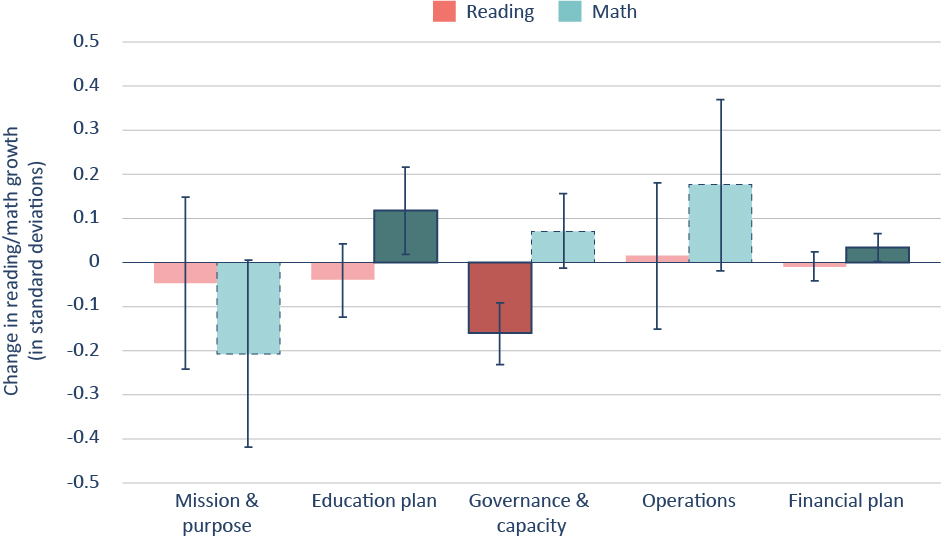
Notes: This figure shows the achievement gains as a function of a ten-percentage-point increase in individual domain “pass” ratings. We control for student gender, race, free- and reduced-price-meal status, special education status, and English-language-learner status, as well as school urbanicity, level, total enrollment, and percentage of students by race, free- and reduced-price-meal status, special education status, and English-language-learner status. We include year and grade fixed effects. Standard errors are clustered at the school level. Vertical black bars show the 95 percent confidence intervals. Results that are significant at the 95 percent confidence level have a solid black border and darker shade. Results that are significant at the 90 percent confidence level have a dashed border.
Finding 4: Despite the predictivity of reviewers’ votes, simulations show that raising the bar for approval would have had little effect on the success rate of new schools.
Given the predictivity of CSAB members’ votes to approve, it was natural to next explore whether raising the bar for charter application approval would have produced better outcomes. Specifically, we conducted exploratory analyses to test three potential approaches to raising the bar:
(1) Raising the required percentage of CSAB “yes” votes. During the timeframe of this study, applications receiving “yes” votes from at least 51 percent of CSAB members were recommended to the State Board of Education for approval. But what if such a recommendation had required a supermajority?
(2) Lowering the percentage of approved applications per year. Overall, CSAB recommended approximately one-third of the applications it received for approval. But what if it had only recommended a quarter of applications? Or one in five? Or one in ten?
(3) Capping the number of approved applications per year. In each year of the study period, somewhere between ten and twenty applications were recommended for approval. But what if the board had limited itself to one application per year? Or three? Or five?
To be clear, neither the percentage of applications that were approved nor their total number was a formal consideration for CSAB during the study period. But nothing prevents us from using these criteria in hypothetical scenarios (note that we assume that CSAB ratings approximate State Board of Education approvals in these scenarios).
Accordingly, Figure 4 shows the predicted changes in the measures of operational success as each of the hypothetical approval criteria becomes more stringent. Per the figure, the probability that an approved school opens increases slightly as the various criteria become more stringent, as does the probability that it opens on time. For example, if approval had required a “yes” vote from all CSAB board members as opposed to a simple majority, about 90 percent of approved schools would have opened as opposed to 80 percent. In contrast, there is no significant change in the probability that a school meets its enrollment target. Nor is there any change in “percent of enrollment target met” (though for ease of interpretation, we do not include this outcome in the figure).
Figure 4. As hypothetical criteria for charter application approval become more stringent, the probability that an approved school opens and/or opens on time increases slightly.
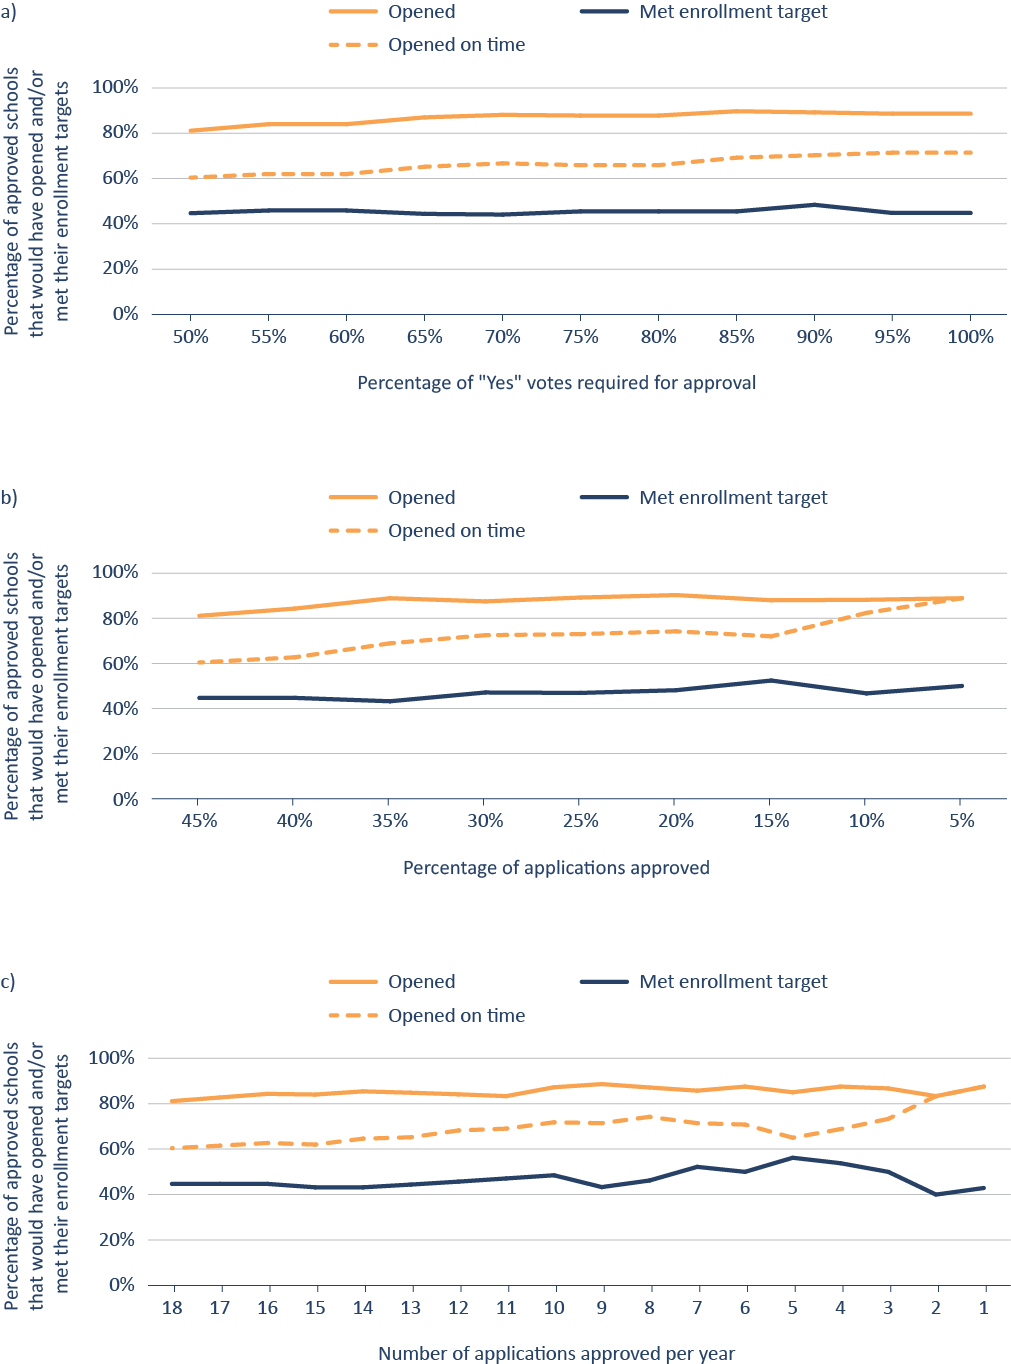
Notes: This figure shows the percentage of approved schools that would have opened, opened on time, and met the year-one enrollment target specified in the charter application as a function of hypothetical approval criteria. In each graph, the approval criterion becomes more stringent moving from left to right.
Similarly, Figure 5 shows the difference between the year-to-year math and reading progress of students in newly opened charter schools and the year-to-year progress of comparable students in existing schools as a function of criteria for approval, where the zero line indicates comparable growth between the two groups. For example, in Figure 5a, students in new charter schools where at least 55 percent of reviewers voted to approve made approximately 0.02 standard deviations less year-to-year progress in reading and approximately 0.06 standard deviations less year-to-year progress in math compared to comparable students in existing schools. This pattern generally holds such that newly opened charter schools perform worse than existing schools under all but the most stringent approval conditions. However, because prior research indicates that both students in newly created charter schools and individual students who are new to charter schools tend to improve over time—and that low-performing charter schools are more likely to close—it doesn’t necessarily follow that the standard for approving new schools should be tightened.[23-26]
That’s certainly the case when it comes to the percentage of CSAB “yes” votes required for approval, where there is no evidence that a stricter standard would have made a difference (Figure 5a). For the other two criteria (percentage of application approved and number of applications approved), the difference between newly approved charter schools and existing schools does shrink (at least in reading) but only when the hypothetical standards become very strict (Figures 5b and 5c)—for example, when only 10 percent of applications are approved (as opposed to 33 percent) or when only five to six applications are approved each year (as opposed to ten to fifteen). Moreover, even with these stricter standards, the improvement in performance is small (e.g., about 0.02 standard deviations).
In short, it’s not clear that stricter approval criteria would have led to meaningfully better achievement outcomes in newly created charter schools. Our data do not allow us to examine the converse—that is, how looser approval criteria would have affected new schools’ success rate—because the schools required for such an analysis were never created.
Figure 5. More stringent approval criteria would have done little to close the gaps between new charter schools’ initial reading and math performance and that of preexisting public schools.
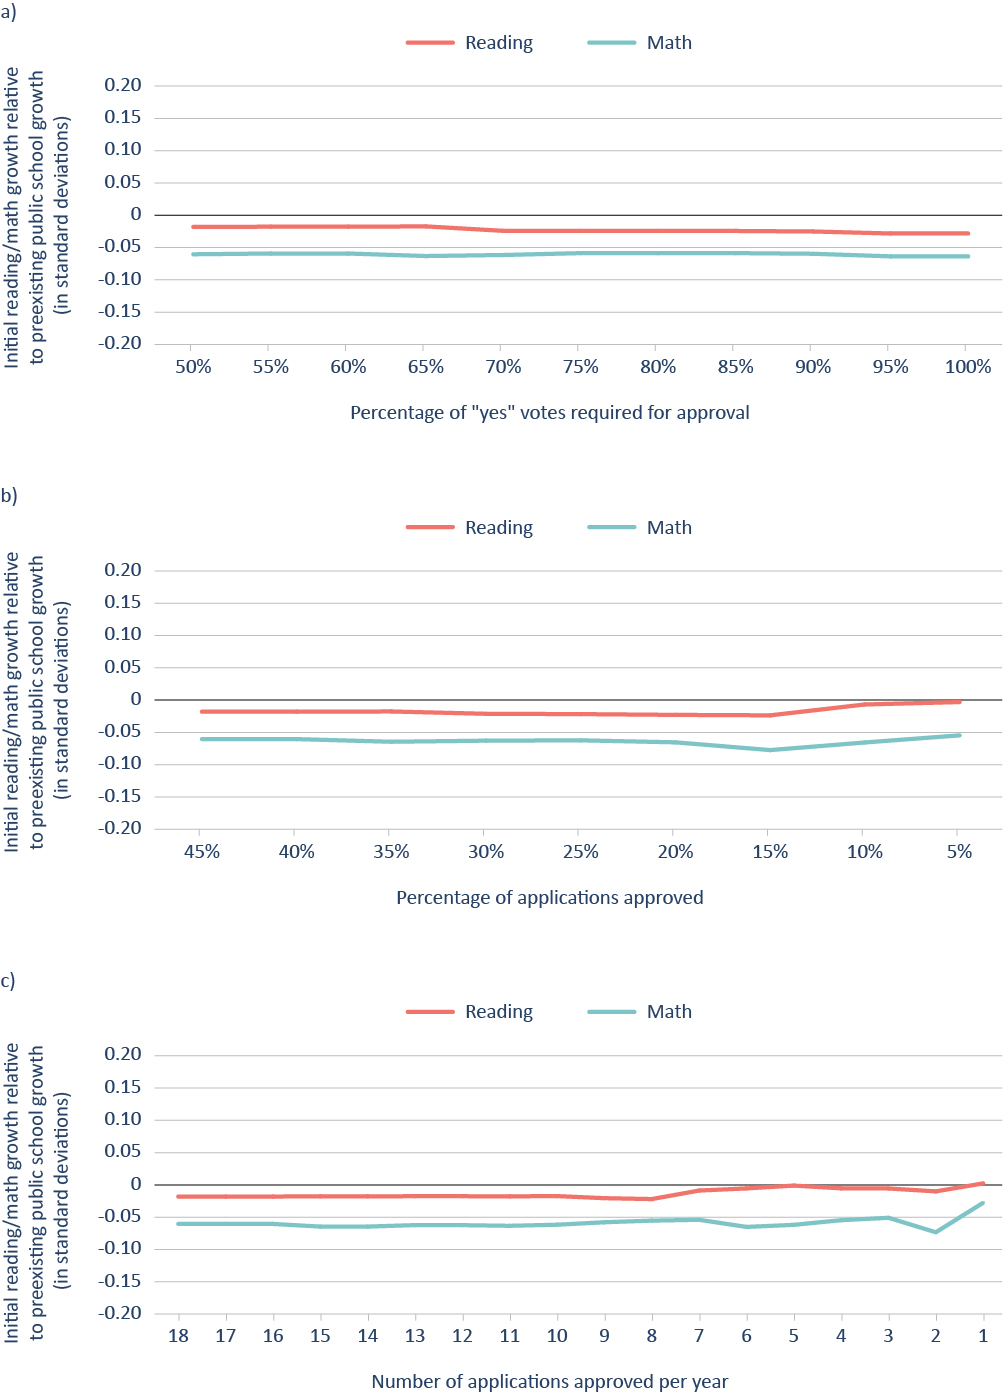
Notes: This figure shows the difference between the year-to-year reading and math progress of students in newly opened charter schools one to four years after opening and the year-to-year progress of comparable students in existing schools as a function of hypothetical approval criteria. The zero line indicates comparable growth between the two groups. In each graph, the approval criteria become more stringent moving from left to right.
Takeaways
1. In general, CSAB was able to differentiate between stronger and weaker applications. Per Findings 1 and 2, the number of board members who voted to recommend an application for approval is predictive of approved charter schools’ results for opening, opening on time, and initial math achievement, suggesting that the board’s composition and process allowed the individuals who comprised it to make informed judgments about which charter schools were likely to succeed.
2. Board members’ professional judgment is at least as important as whatever appears in a school’s written application. Per Finding 3, there are few statistically significant and intuitive relationships between external reviewers’ ratings of specific domains of a charter school’s application and the various measures of success. Overall, the fact that vote share is a significant predictor of success but most domain ratings are not suggests that other criteria (e.g., interview data and data beyond the application process) are factoring into approval decisions.
3. Raising the bar for approval wouldn’t significantly improve charters’ chances of success. Per Finding 4, even a very slight increase in initial quality would require a drastic reduction in quantity, which does not seem advisable given newly created schools’ tendency to improve.[27] Although we are unable to assess the implications of approving more schools, any consideration of lowering the bar should include consideration of the capacity of supporting and/or regulatory bodies to assist newly approved schools with the start-up process. Overall, our impression is that the authorizing process North Carolina followed during the study period struck the right balance, suggesting the newly constituted CSRB would do well to stay the course.
Limitations
Perhaps the biggest limitation of this study is its one-sided-ness: By definition, schools that don’t open can’t be included in an analysis of observed performance. Consequently, we will never know if CSAB board members or external reviewers were right to reject them. All we can do is investigate the relationships between authorizers’ evaluations and the performance of those schools that were ultimately approved.
In addition, it is important to recognize that students are not randomly assigned to charter schools. Consequently, we cannot rule out the possibility that our estimates of academic growth—or of the consequences of “raising the bar”—reflect characteristics of students that we do not observe in the data.
Finally, while a majority of CSAB board members voted on each application, there was some variation in which members were absent from votes. Consequently, there may be some concerns about the stability of the percentage of reviewers who voted to approve.
 Technical Appendix
We use a combination of ordinary least squares regression and linear probability models to answer our research questions.
Research question 1: Does the share of reviewers who vote to approve a charter school application predict indicators of initial success such as opening on time, meeting enrollment targets, and year-to-year growth on standardized tests?
For research question 1, we model our analysis of school-level outcomes as follows:
ys = β0 + β1passrates + SsBj + θa + est
where ys is our measure of success of school s. We operationalize success in several different ways. At the school level, we include a binary of opening, opening on time (as opposed to opening late or not opening at all after approval), meeting the year-one enrollment target as identified in the application, and the proportion of the year-one enrollment target met. While the school-level outcomes are limited to one observation per school, we include student-level measures of success, which we operationalize as reading and math achievement. Reading and math scores are standardized by year. Each school can have up to four years of data. For example, for the earliest set of applications, submitted in 2013, we have four years of data from approved schools opening in 2015–16 and in operation through 2018–19; for 2014 applications, we have three years of data from 2016–17 through 2018–19; and so on.
Our main independent variable of interest, passrates, represents the proportion of “yes” votes by CSAB members on whether the application should be recommended for approval. We include school-level covariates, represented by the vector Ss including the urbanicity, level (elementary, middle, high), and the projected enrollment for year one as a proxy measure for preparation efforts. Lastly, it is possible that reviewers may be influenced by factors specific to each year (e.g., the number of applications submitted). Thus, we include a fixed effect for the application year.[28]
We model our analysis of student-level achievement as follows:
yigst = β0 + β1passrates + yigst-1 + SstBj + XigstBk + 𝛾t + δg + θa+ eist
where yigst represents the standardized test score for student i in grade I in school I in year I. With the inclusion of prior-year test scores, yigst-1, we can interpret the outcome as student achievement gains. Xigst represents a vector of student characteristics, including gender, race, free- and reduced-price-meal status, special education status, and English-language-learner status. Sst represents a vector of school characteristics, including urbanicity, level, total enrollment, and percentage of students by race, free- and reduced-price-meal status, special education status, and English-language-learner status. We also include year, grade, and application-year fixed effects. Standard errors are clustered at the school level.
Our key coefficient of interest is β1, which represents the change in outcome as a result of increasing the proportion of CSAB “yes” votes by 100 percentage points. We rescale the estimates to represent a more likely (and possible) scenario; because the average application received ten votes, we rescale the estimates to represent the change in the outcome as a result of a ten-percentage-point increase in CSAB “yes” votes (e.g., 60 percent to 70 percent), which translates to one additional “yes” vote.
Research question 2: Do charter schools experience more initial success if they have higher ratings for specific domains of their written application (e.g., their education, governance, or financial plans)?
To answer research question 2, we model our analyses similarly to Equations (1) and (2) but replace passrates with five key independent variables, each representing the percentage of “pass” votes for each of the five domains: mission and purposes, education plan, governance and capacity, operations, and financial plan.
Exploratory Research Question: How would adopting a stricter approval standard have affected the success rate of newly created charter schools?
In our exploratory analyses, we calculate the percentage of approved schools that would have opened, opened on time, and met their enrollment target (conditional on opening), as well as the percentage of the enrollment target the average school would have met in the first operating year (conditional on opening) across the observable ranges of three different criteria – the percentage of CSAB “yes” votes, the percentage of approved applications per year, and the number of approved applications per year. To determine which schools were included in the sample as those criteria became more restrictive, we ranked the applications first by the percentage of CSAB “yes” votes they received and then (in the case of ties) by their average pass rate across the five domains of the written application.
For student growth outcomes, we calculated the difference between the year-to-year achievement gains of students in new charter schools and comparable students in existing schools in the same district. For the purposes of this analysis, comparable students are those in the same district and grade who have the same gender, race, free- and reduced-price meal status, special education status, and English learner status, as well as comparable reading and math scores from the prior year.[29]
ENDNOTES
[1] Anna Nicotera and David Stuit, “Three Signs That a Proposed Charter School Is at Risk of Failing,” Thomas B. Fordham Institute, April 2017, https://fordhaminstitute.org/national/research/three-signs-proposed-charter-school-risk-failing#:~:text=No%20description%20of%20how%20the,organization%20to%20run%20the%20school.
[2] Anna Nicotera et al., “Will a New Charter School Fail? Look at the application,” National Association of Charter School Authorizers, 2017, https://qualitycharters.org/wp-content/uploads/2017/10/Will-a-New-Charter-School-Fail_PowerPoint.pdf.
[3] North Carolina Department of Public Instruction, “Closed Charter Schools 1999-2022 Complete,” 2022, https://www.dpi.nc.gov/closed-charter-schools-1999-2022-complete-listpdf/open/.
[4] Ibid.
[5] Jamison White, “How are Charter Schools Held Accountable,” National Alliance for Public Charter Schools, December 19, 2023, https://data.publiccharters.org/digest/charter-school-data-digest/who-authorizes-charter-schools/.
[6] Anna Nicotera and David Stuit, “Three Signs That a Proposed Charter School Is at Risk of Failing,” Thomas B. Fordham Institute, April 2017, https://fordhaminstitute.org/national/research/three-signs-proposed-charter-school-risk-failing#:~:text=No%20description%20of%20how%20the,organization%20to%20run%20the%20school.
[7] Deven Carlson, Lesley Lavery, and John F. Witte, “Charter school authorizers and student achievement,” Economics of Education Review 31, no. 2 (April 2012): 254–67, https://doi.org/10.1016/j.econedurev.2011.03.008.
[8] Ron Zimmer, Brian Gill, Jonathon Attridge, and Kaitlin Obenauf, “Charter school authorizers and student achievement,” Education Finance and Policy 9, no. 1 (January 2014): 59–85, https://doi.org/10.1162/EDFP_a_00120.
[9] Joseph J. Ferrare, R. Joseph Waddington, Brian R. Fitzpatrick, and Mark Berends, “Insufficient accountability? Heterogeneous effects of charter schools across authorizing agencies,” American Educational Research Journal 60, no. 4 (2023): 696–734, https://doi.org/10.3102/00028312231167802.
[10] Whitney Bross and Douglas N. Harris, How (and how well) do charter authorizers choose schools? Evidence from the Recovery School District in New Orleans (New Orleans, LA: Education Research Alliance for New Orleans, Tulane University, 2016), https://educationresearchalliancenola.org/files/publications/Bross-Harris-How-Do-Charter-Authorizers-Choose-Schools.pdf.
[11] National Association of Charter School Authorizers, “Reinvigorating the pipeline: Insights into proposed and approved charter schools,” retrieved September 20, 2023, https://qualitycharters.org/research/pipeline.
[12] Anna Nicotera and David Stuit, “Three Signs That a Proposed Charter School Is at Risk of Failing,” Thomas B. Fordham Institute, April 2017, https://fordhaminstitute.org/national/research/three-signs-proposed-charter-school-risk-failing
[13] North Carolina State Board of Education, Department of Public Instruction, Report to the North Carolina General Assembly: 2022 annual charter schools report (Raleigh, NC: North Carolina Department of Public Instruction, 2023), chrome-extension://efaidnbmnnnibpcajpcglclefindmkaj/https://www.dpi.nc.gov/charter-schools-2022-annual-report/download?attachment.
[14] National Association of Charter School Authorizers, “Charter school authorizers by state,” retrieved September 21, 2023, https://qualitycharters.org/state-policy/multiple-authorizers/list-of-charter-school-authorizers-by-state.
[15] North Carolina General Assembly, “Article 14A, Charter schools,” retrieved September 21, 2023, https://www.ncleg.net/EnactedLegislation/Statutes/HTML/BySection/Chapter_115C/GS_115C-218.html.
[16] The one CSAB member without leadership experience in charter schools has experience in North Carolina’s higher education system.
[17] In some cases, applications and/or ratings were unavailable through public sources. To locate these, we worked with the NCDPI Office of Charter Schools. We then triangulated these data with minutes from the State Board of Education meetings to ensure that CSAB vote counts were accurately reported. In the few cases where there were discrepancies between the application review and minutes data, we consulted with the Office of Charter Schools to resolve these discrepancies.
[18] The sixth domain was Application Contact Information. We excluded this domain as all schools received favorable ratings for providing contact information.
[19] Governance and capacity domain scores were not available for applications submitted in the 2013–14 school year.
[20] Applications submitted in the 2012–13 school year included governance and capacity and operations in the same domain. However, because they were still scored separately, we were able to differentiate between the two.
[21] The vast majority of applications (86 percent) had four to nine reviewers, 5 percent had fewer than four reviewers, and 9 percent had more than nine reviewers.
[22] In general, our estimates do not differ by characteristics such as urbanicity or school level; however, the estimates for opening and opening on time appear to be driven by urban charter schools, which were eighteen percentage points more likely to open and open on time when one additional CSAB member recommended them for approval.
[23] Tim R. Sass, “Charter schools and student achievement in Florida,” Education Finance and Policy 1, no. 1 (2006): 91–122, https://doi.org/10.1162/edfp.2006.1.1.91.
[24] Lisa P. Spees and Douglas Lee Lauen, “Evaluating charter school achievement growth in North Carolina: Differentiated effects among disadvantaged students, stayers, and switchers,” American Journal of Education 125, no. 3 (2019): 417–51, https://doi.org/10.1086/702739.
[25] Ron Zimmer et al., Charter Schools in Eight States: Effects on Achievement, Attainment, Integration, and Competition (Santa Monica, CA: RAND Corporation, 2009), https://www.rand.org/pubs/monographs/MG869.html.
[26] Margaret E. Raymond, James L. Woodworth, Won F Lee, and Sally Bachofer, As a matter of fact: The national charter school study III 2023 (Stanford, CA: Center for Research on Education Outcomes, 2023), https://ncss3.stanford.edu/wp-content/uploads/2023/06/Credo-NCSS3-Report.pdf.
[27] Ibid.
[28] Further analyses yielded small differences in opening and achievement outcomes across application years. Therefore, we include application-year fixed effects to account for differences across cohorts. However, our main results are robust across the inclusion or exclusion of the application-year fixed effect.
[29] For each year and grade, we split students’ prior year performance into twenty quantiles. Students are “comparable” if they are in the same quantile.
Acknowledgments
This report was made possible through the generous support of the John William Pope Foundation as well as numerous individuals whose efforts are reflected in the final product. By far the most important of the latter are Adam Kho and his coauthors, Shelby Leigh Smith and Douglas Lauen, whose persistence and professionalism in the face of the inevitable challenges we greatly appreciate. In addition to the authors, we would like to thank Alex Quigley for his guidance, perspective, and support of the project from its inception through its publication, as well as R. Joseph Waddington for his clear and timely feedback on the research methods. At Fordham, we thank Chester E. Finn, Jr., Michael J. Petrilli and Kathryn Mullen Upton for providing feedback on the draft, Stephanie Distler for managing report production and design, and Victoria McDougald for overseeing media dissemination. Finally, we thank the North Carolina Department of Public Instruction's Office of Charter Schools for providing the opportunity to conduct this research and for their support throughout this research.
