For two decades, Ohio’s school report card has shined a light on student outcomes in the state’s 3,000 plus public schools and 600 plus districts. It offers key academic results on state assessments and other markers of educational success, allowing parents and community members to gauge the quality of local schools. The report card framework, however, has evolved in response to changes in federal education policy and—more importantly—based on feedback from Ohioans. In 2021, state lawmakers passed reforms that fine-tuned the state’s report card model. What are those changes and how were they implemented in fall 2022? This publication dives into Ohio’s revamped report card and examines results from the first year of implementation. Download the full report or read it below.
Executive summary
For two decades, Ohio’s district and school report cards have been the linchpin to a transparent and accountable public school system. Report cards provide key information about how students perform on the year’s state assessments and how they are growing academically over time. In more recent years, Ohio has added measures of high schoolers’ postsecondary readiness as well as elementary school students’ progress in reading. These data—along with user-friendly ratings based on them—assist parents who are making school decisions for their children, and they provide communities with annual checkups on the academic quality of their local schools. In some circumstances, state policymakers rely on report cards to identify low-performing schools that need intervention and additional supports.
Given these critical purposes, Ohio needs a report card that provides a clear and accurate picture of school performance across the state. We at Fordham have long been staunch supporters of the goals and aims of Ohio’s report card, but we’ve also shared concerns about how its prior version was functioning. In a 2017 paper, we outlined how the system had gotten bogged down with too many measures and ratings, didn’t adequately differentiate school performance, and placed excessive emphasis on “status” measures that tend to correlate with demographics.[1] Others, largely representing school administration groups, levelled harsher criticisms and some offered proposals that would have undermined the overarching goals of the report card.
After several years of debate, Ohio lawmakers overhauled the school report card in 2021. The reform legislation—House Bill 82 of the 134th General Assembly—won near-unanimous approval in both chambers, and Governor DeWine signed it into law.[2] We, along with other education groups, supported the legislative action. But it’s no secret that strong reforms on paper can go awry during implementation. This paper takes a closer look at Ohio’s redesigned report card in its first year of implementation (the 2021–22 school year). What are the key changes, and how were they put into practice?
In brief, the main revisions include the following.
First, it shifts from A–F school ratings to a five-star system. Although letter grades remain the most widely understood grading system, school officials criticized them and pushed for their removal. Feeling pressured, lawmakers weighed several alternatives and ultimately decided to go with star ratings, a system that continues to offer a clear sense of school performance, perhaps without being as politically charged. In 2021–22, Ohio assigned star ratings to schools on five components—Achievement, Progress, Graduation, Gap Closing, and Early Literacy—with a sixth component rating (based on postsecondary readiness) tentatively slated for 2024–25.
Second, the reforms wisely preserve and refine schools’ Overall rating, Ohio’s longstanding “bottom line” evaluation that combines schools’ performance on the various components. This mark continues to offer parents and the public a user-friendly summary of school quality, while, in a policy improvement, placing heavier weight on the Achievement and Progress ratings—the two central components of the state report card. Overall ratings were withheld in 2021–22 but will appear next year.
Third, the legislation makes dozens of technical adjustments to streamline the system and strengthen its various components. The notable revisions include (1) removing the duplicative “indicators-met” dimension of the Achievement component, thus yielding a clearer focus on the key performance-index (PI) measure; (2) adding a value-added “effect-size” growth measure in the Progress component that allows us to better pinpoint highly effective or ineffective schools; and (3) overhauling the Gap Closing calculations to ensure that schools are held accountable for both the achievement and academic growth of designated student groups (e.g., economically disadvantaged). Changes such as these are discussed further in the report.
This analysis also uncovers one issue that still needs more work: the insufficient rigor of the Gap Closing component. Last year, more than 60 percent of districts and schools received four- or five-star ratings on this measure, despite significant learning losses and widening achievement gaps coming out of the pandemic.[3] Such rosy results can be explained by a couple of decisions made by the state board of education and the department of education during implementation. First, while setting the grading scale was not easy given the significant changes to the component, the scale—in hindsight—ended up being too soft. Schools could meet less than half—just 45 percent—of the performance indicators and still receive four stars. Additionally, the achievement targets for subgroups were set too low. For instance, 75 percent of schools met the state’s PI goals for economically disadvantaged pupils, even as those very students suffered large learning losses. Moving forward, policymakers should increase the rigor of this component and make certain that it offers an honest picture of how effectively schools are educating all student groups.
To its credit, Ohio is moving to a report card that offers transparent ratings to parents and the public, treats schools more evenhandedly, and has a stronger technical foundation. It’s one that state leaders should be proud of and confidently stand behind. With some smart tweaks as the new framework is implemented, Ohio will finally have a report card that is built to last.
Analysis of Ohio’s revamped school report card
After several years of debate, Ohio lawmakers overhauled the state’s school report card in 2021 via House Bill 82 of the 134th General Assembly. The legislation preserves several core strengths of the previous system, including (1) upholding Ohio’s longstanding commitment to using objective measures of performance on state exams; (2) maintaining the PI and value-added measures as the key indicators of pupil achievement and growth, respectively; and (3) preserving the state’s Overall rating, which combines results across multiple report-card components to generate a user-friendly summary for parents and the public.
Yet it’s also different. The most visible shift is replacing A–F letter grades for districts and individual schools with a five-star rating system. Appearing on the 2012–13 to 2018–19 report cards, letter grades moved Ohio to a more widely understood rating system than the state’s prior approach, which had relied on ambiguous labels such as “continuous improvement.” School officials, however, bitterly criticized letter grades and pressed to scrap ratings altogether or reinstate vague labels. Others (including Fordham) raised concerns that such opaque approaches would hide the ball. In the end, state lawmakers reached a reasonable compromise. The new five-star system continues to offer a transparent picture of school quality, one that parents and the public can easily grasp, while taking some of the sting out of the ratings.
The reform legislation also made numerous technical changes that streamline and improve the system. These refinements were undertaken in response to concerns from Fordham and other education groups that the report card wasn’t functioning properly. Fortunately, legislators were willing to roll up their sleeves and make the fixes needed to strengthen the report card. Table 1 reviews the most important changes, with more detailed analysis of five key components in the pages that follow. Discussion about the Overall rating, including tweaks made to the methodology for calculating it, appears here.
Table 1: Summary of Ohio’s report-card components and recent changes to them
Component 1: Achievement
Student achievement on state assessments has long formed the backbone of Ohio’s report-card system—rightly so, as measures of achievement offer Ohioans a clear sense of where students in their local districts and schools currently stand academically. They shed light on the basic question of whether students are struggling in core academic subjects or exceeding state standards.
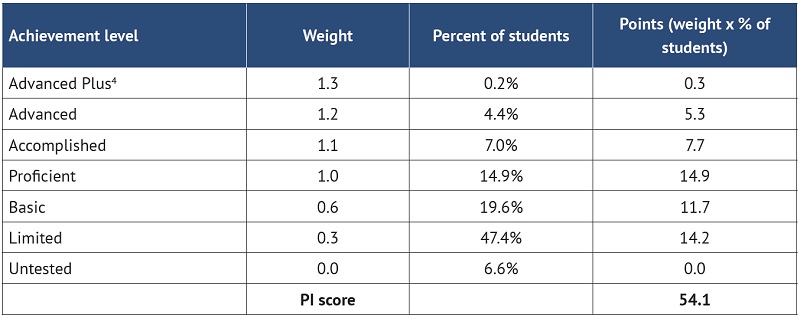
For many years, Ohio has deployed two measures—proficiency rates and PI scores—to present a picture of student achievement. As noted in the table above, the recent reforms eliminated the use of proficiency rates via “indicators met” in the rating system (though these rates are still reported). Instead, Ohio now relies entirely on the PI to determine Achievement ratings. The two measures are highly correlated—schools with high PI score tend to have high proficiency rates (and vice versa)—so removing one of them streamlined the rating system. In contrast to the more simplistic proficiency rate, the PI uses weights that provide more credit to schools when students achieve at higher levels. In an accountability setting, this structure encourages schools to pay attention to all students—including high and low achievers—rather than incentivizing a narrow focus on students around the proficiency bar. The table shows the calculations using 2021–22 data from Columbus City Schools, the largest district in Ohio.
Table 2: Illustration of the PI calculations[4]
Though the index’s weights have remained consistent over time, the recent legislation slightly alters the way scores translate into ratings. Previously, schools’ PI ratings were based on their score divided by the maximum number of points possible (120), not considering “Advanced Plus.” Now they are determined by dividing scores by the average of the top 2 percent of districts or schools statewide (107.3 for districts and 109.1 for schools in 2021–22).[5] This “curve,” which was championed by school administrator groups, slightly boosts Achievement ratings and explains why—despite the decline in scores statewide[6]—more schools received high marks on the Achievement component in 2021–22 compared to 2018–19.
Figure 1: Distribution of Achievement ratings in Ohio schools, 2018–19 and 2021–22
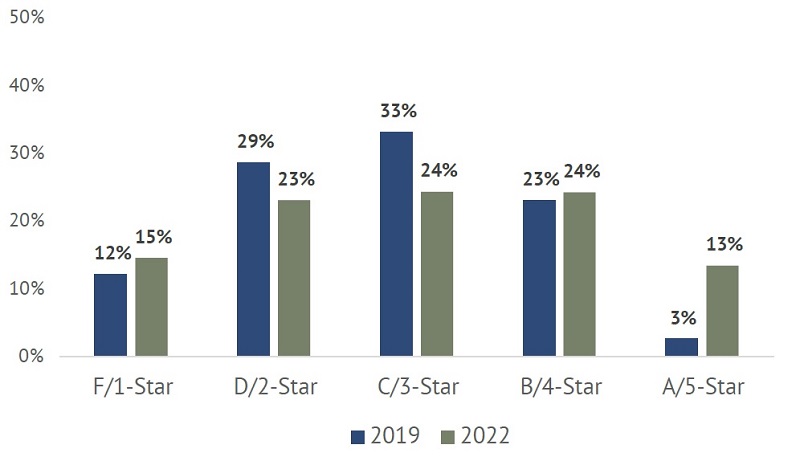
Note: The 2019 ratings are for the PI—not the Achievement component ratings from that year, as it combined the PI
Note: The 2019 ratings are for the PI—not the Achievement component ratings from that year, as it combined the PI
and indicators-met ratings. This allows for a direct comparison with the 2022 Achievement ratings that are now based
solely on PI scores.
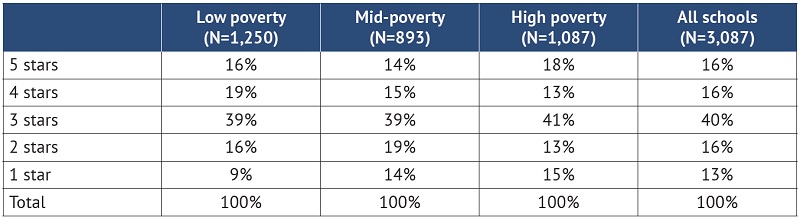
While achievement measures provide insight into where students stand, they disadvantage high-poverty schools. That reality reflects persistent achievement gaps that are partly driven by socioeconomic factors. The PI scores and Achievement ratings for 2021–22 continue to follow this pattern. Figure 2 shows that schools with higher percentages of economically disadvantaged students tend to have lower PI scores. Table 4 reports that most high-poverty schools receive one- or two-star Achievement ratings (86 percent), while just 5 percent of low-poverty schools receive such marks.
Figure 2: PI scores versus economically disadvantaged students in Ohio schools, 2021–22
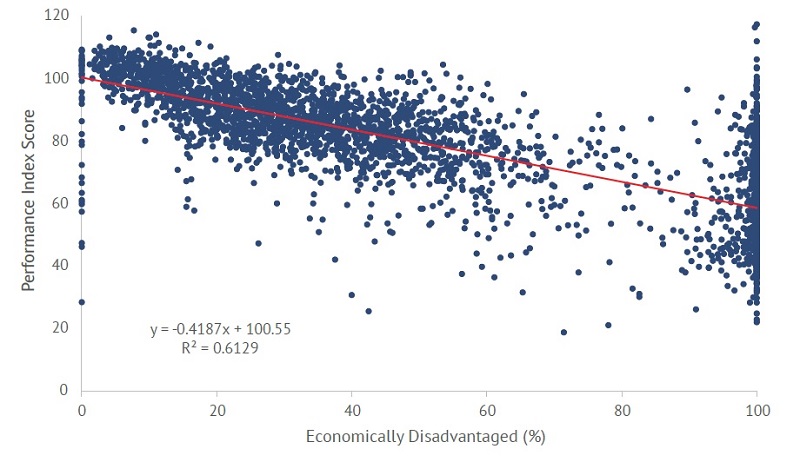
How to read the figure: Each dot represents a school’s percentage of economically disadvantaged students and its PI score. As indicated by the red line, there is an inverse relationship between the two data points—as schools’ disadvantaged rates increase, their scores tend to go down. Note: Economically disadvantaged students are identified via eligibility for free- and reduced-price meals. However, due to a federal policy shift, known as the Community Eligibility Provision, certain schools may now offer subsidized meals to all students—regardless of income—allowing some schools to report 100 percent economically disadvantaged students. That explains the large numbers of schools at the 100 percent economically disadvantaged point on the chart.
How to read the figure: Each dot represents a school’s percentage of economically disadvantaged students and its PI score. As indicated by the red line, there is an inverse relationship between the two data points—as schools’ disadvantaged rates increase, their scores tend to go down. Note: Economically disadvantaged students are identified via eligibility for free- and reduced-price meals. However, due to a federal policy shift, known as the Community Eligibility Provision, certain schools may now offer subsidized meals to all students—regardless of income—allowing some schools to report 100 percent economically disadvantaged students. That explains the large numbers of schools at the 100 percent economically disadvantaged point on the chart.
Table 3: Achievement ratings by poverty tier in Ohio schools, 2021–22
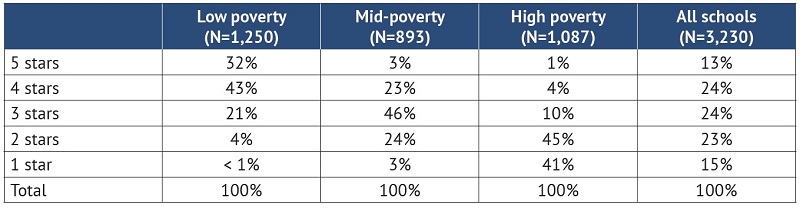
Note: Any school whose student population is 0–33.3 percent economically disadvantaged is considered low poverty;
Note: Any school whose student population is 0–33.3 percent economically disadvantaged is considered low poverty;
any school whose student population is 33.4–66.7 percent economically disadvantaged is mid-poverty; and any
school whose student population is 66.8–100 percent economically disadvantaged is high poverty.
Component 2: Progress
Recognizing the limitations of evaluating school performance solely based on achievement metrics, analysts have developed student growth measures as a way to create a more even playing field for schools serving children of differing backgrounds. These measures rely on statistical techniques that gauge a school’s contribution to changes in student achievement over time. Because these methodologies control for a student’s prior achievement, schools of all poverty levels have more equal opportunities to demonstrate academic growth. To offer a simplified illustration of this type of method, consider a high-poverty school whose average student starts the year at the twentieth percentile. At the end of the year, this student scores at the twenty-fifth percentile. That five-percentile gain is recognized under a growth model, even though this student still hasn’t reached proficiency.
For more than a decade, Ohio has used a “value-added” growth model.[7] Under Ohio’s former report-card system, the state relied on the value-added index score to determine Progress ratings. While that score indicates whether students’ gains or losses are statistically significant, it doesn’t offer a clear sense of their magnitude. This was less than ideal. A large district, for instance, could eke out a miniscule gain of one percentile yet receive a top rating because of the strong statistical evidence (due to its large numbers of students) that the gain was different from zero. To gauge the size of the impact more appropriately, Ohio began implementation of a value-added effect size in 2021–22, which is now paired with the traditional index score to determine Progress ratings. Taken together, the two measures now offer a better depiction of whether a school’s impact on pupil growth is both statistically and practically significant.
The following table displays how Ohio combines the two measures to determine Progress ratings for individual schools. It’s a two-step process in which the state first considers the index score—using a largely similar framework as before[8]—and then applies the effect size to differentiate four- versus five-star schools and one- versus two-star schools.
Table 4: Progress rating framework for Ohio schools
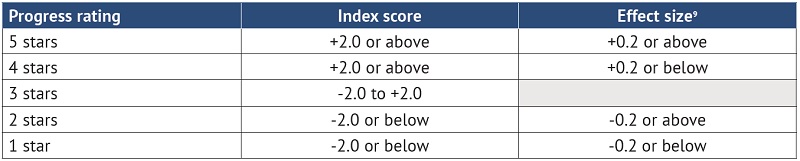
Note: In 2021–22, the range of index scores was -30.3 to +28.2, with 77 percent of Ohio schools’ index scores
Note: In 2021–22, the range of index scores was -30.3 to +28.2, with 77 percent of Ohio schools’ index scores
ranging between -5.0 and +5.0. The range of effect sizes was -1.73 to +1.21, with 86 percent of Ohio schools’ effect
sizes ranging between -0.3 and +0.3. The two measures are generally correlated, and there are no cases of a school
receiving a positive index score and negative effect size (or vice versa).
The Progress ratings confirm that the new framework better pinpoints high and low performers. Under the former system, Ohio identified almost four in five schools as either A’s or F’s. With the application of the effect size, fewer schools are now at the “tails” of the distribution: 13 percent were assigned one-star Progress ratings, and 16 percent received five stars. It’s important to note that in 2021–22, schools could post strong Progress ratings even though their students still lagged their prepandemic peers in achievement. If a school did comparatively well (relative to other schools) in moving their students ahead from 2020–21 to 2021–22, it would have received a solid rating.
Figure 3: Distribution of Progress component ratings in Ohio schools, 2018–19 and 2021–22
Note: The 2018–19 ratings are based on the schoolwide value-added index scores (not the umbrella Progress rating)
Note: The 2018–19 ratings are based on the schoolwide value-added index scores (not the umbrella Progress rating)
and do not apply the “subgroup demotion” that was used only in that year.
Historically, Ohio’s value-added system has produced poverty-neutral results that help to identify high- and low-performing schools serving students of varying demographics. That pattern surfaced again in the 2021–22 data. Figure 4 reveals almost no correlation—indicated by the flat regression line—between a school’s value-added index scores and its percentage of economically disadvantaged students. The same holds true for the effect size results.
Figure 4: Value-added index scores (top) and effect sizes (bottom) versus economically disadvantaged in Ohio schools, 2021–22[9]
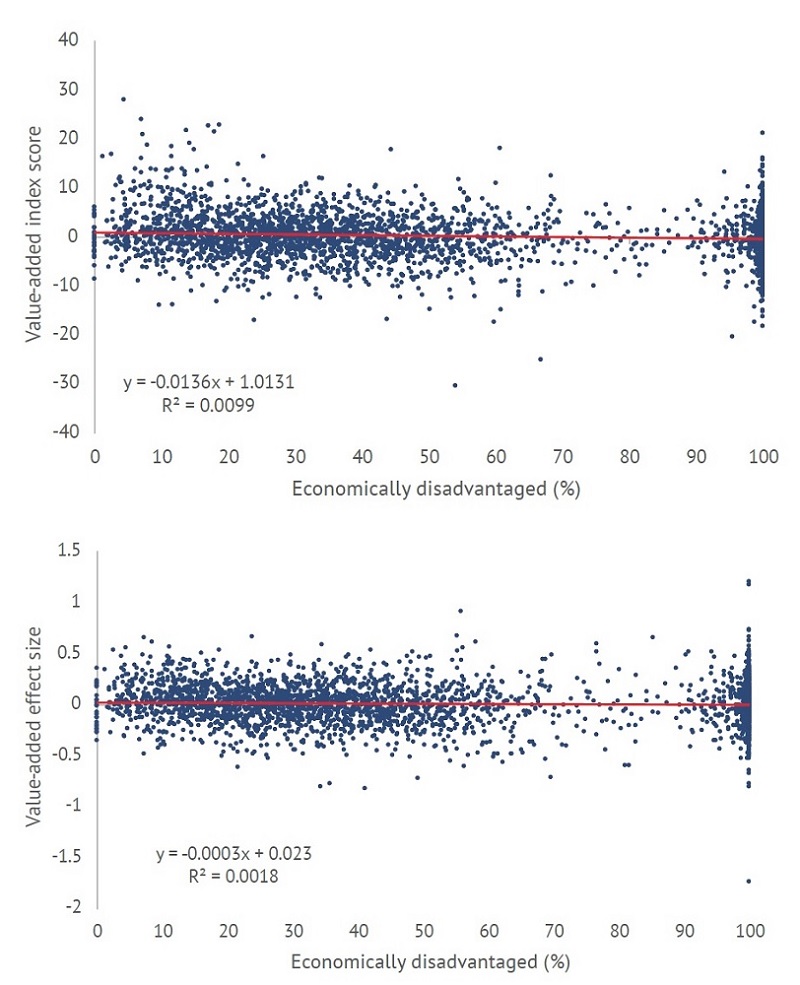
How to read the figure: Each dot represents a school’s percentage of economically disadvantaged students and its
How to read the figure: Each dot represents a school’s percentage of economically disadvantaged students and its
value-added index score and effect size. As indicated by the flat red line, there is virtually no link between a school’s
disadvantaged rate and its value-added results. Low-poverty schools are about as equally likely to receive a high or
low value-added score; the same is true for high-poverty schools.As for the component ratings, schools of all poverty levels fare about equally well. Table 5 shows that 18 percent of high-poverty schools received five-star Progress ratings, a slightly larger proportion than low- and mid-poverty schools. Conversely, 15 percent of high-poverty schools received one-star ratings, while 9 percent of low-poverty schools did.
Table 5: Distribution of Progress ratings by poverty tier in Ohio schools, 2021–22
Note: Any school whose student population is 0–33.3 percent economically disadvantaged is considered low poverty;
Note: Any school whose student population is 0–33.3 percent economically disadvantaged is considered low poverty;
any school whose student population is 33.4–66.7 percent economically disadvantaged is mid-poverty; and any
school whose student population is 66.8–100 percent economically disadvantaged is high poverty.
Component 3: Graduation
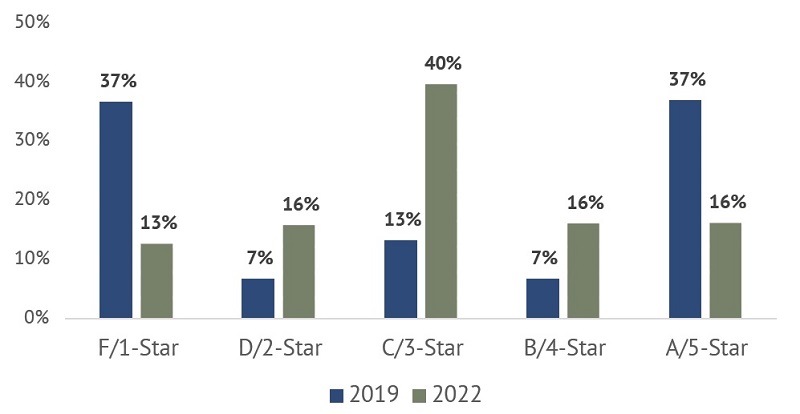
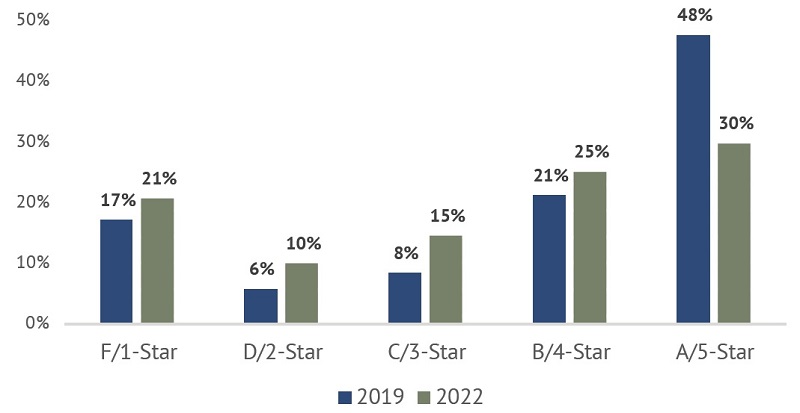
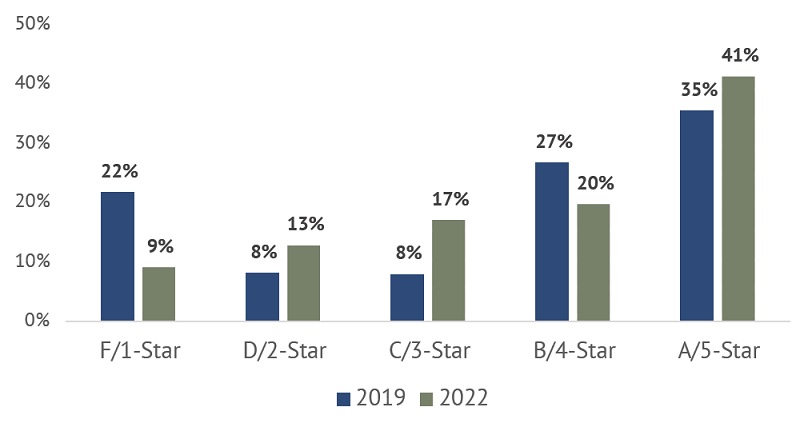
Very little changed within the Graduation component in the recent overhaul, as it continues to rely on both the four- and five-year graduation rates to determine the rating. The grading scale, however, was slightly tweaked—likely an effort to comply with a new provision that requires the state board of education to set grading scales in a way that avoids identifying more than 50 percent of schools in any single rating category.[10] As figure 5 shows, almost half of Ohio high schools received A’s on the Graduation component in 2018–19, so the board slightly raised the bar. This slight adjustment reduced the percentage of high schools receiving five-star ratings to 30 percent in 2021–22.[11]
Table 6: Grading scale for the Graduation component, 2018–19 and 2021–22[12]
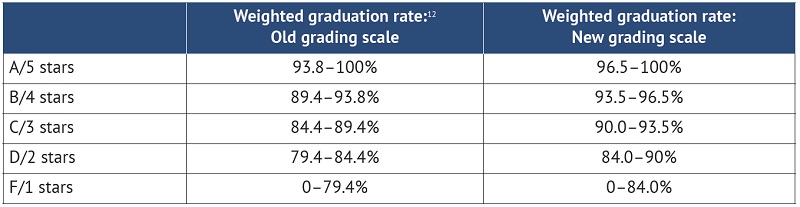
Figure 5: Distribution of Graduation component ratings, Ohio high schools, 2018–19 and 2021–22
Component 4: Gap Closing
The Gap Closing component focuses on the outcomes of specific student subgroups that are identified in federal and state law (i.e., economically disadvantaged, English learners, special education, and race/ethnicity). This “disaggregated” look at results helps to ensure that historically disadvantaged students are not being overlooked and their results are not masked by overall school averages. Unfortunately, the structure of the old Gap Closing component was unnecessarily complex[13] and failed to properly account for both the achievement and growth of the various subgroups.[14] The term Gap Closing is also something of misnomer, as it also includes traditionally high-achieving subgroups and doesn’t directly gauge whether gaps are closing or not. There were efforts to change the component name in the reform legislation, but they did not pass.
Though conceptually similar—Gap Closing continues to focus on subgroup outcomes—state lawmakers overhauled the component in the recent legislation. Instead of a complicated scoring system, the new framework deploys a more straightforward methodology that looks at all the subgroups and gives schools credit when they meet an achievement or growth target.[15] Table 7 shows the system in action, using data from Columbus City Schools. To illustrate, the table shows only the English language arts (ELA) achievement and growth results—the same format is used to evaluate subgroup performance in math as well as four-year graduation rates. It also displays five “special” elements within the Gap Closing component, including three that focus on gifted students.
Table 7: Illustration of the new Gap Closing calculations [16] [17] [18] [19]
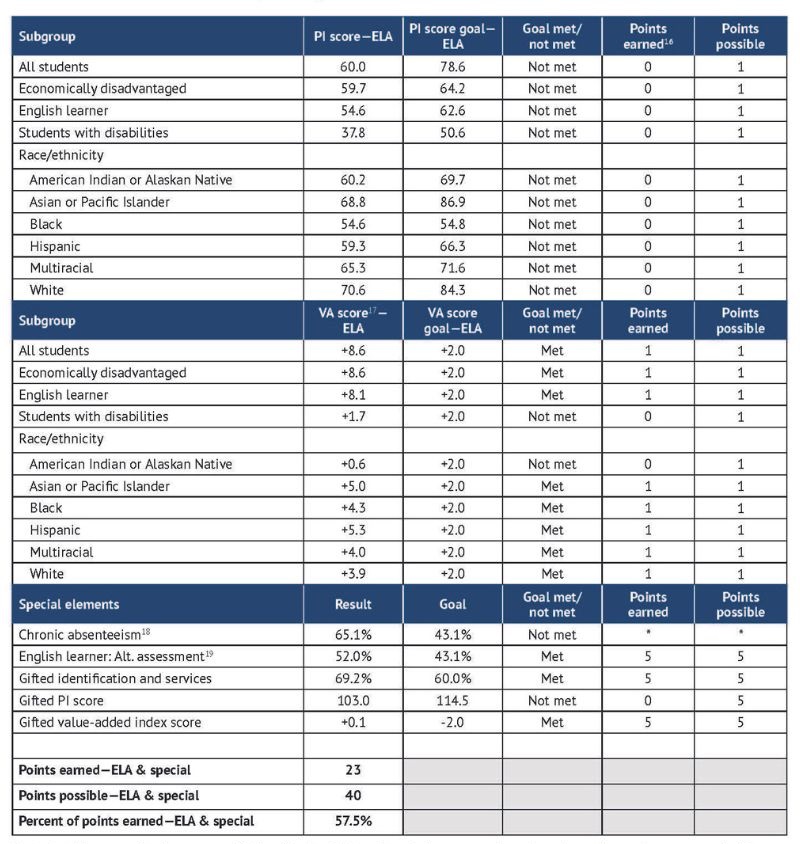
Note: In this example, there are sufficient “n sizes”—i.e., the minimum number of students in a subgroup needed for a
Note: In this example, there are sufficient “n sizes”—i.e., the minimum number of students in a subgroup needed for a
school to be evaluated—for all subgroups. However, every subgroup will not apply in most districts and schools due to
insufficient number of students in certain groups. For Gap Closing, the minimum “n size” is fifteen.Given the learning losses and widening achievement gaps, the most surprising result from the 2021–22 report card is the number of schools that received high Gap Closing ratings. As Figure 6 indicates, 61 percent of Ohio schools received four- or five-star ratings on this component and more schools received top marks on this component than in 2018–19, a year when achievement was higher.
Figure 6: Distribution of Gap Closing component ratings, 2018–19 and 2021–22
Two factors—both issues that emerged during implementation—help to explain such results:
- First, a soft grading scale buoyed these ratings. While the restructuring of the component made it difficult to project scores and set a grading scale, the state board ended up setting the bar too low. Schools could miss 40 percent of the performance indicators and still earn five stars, and they could miss a majority of them (55 percent) and receive four.[20] Under administrative law, the board must review the component grading scales within the next two years. As part of that process, it should implement a more rigorous Gap Closing scale.[21]
- Second, the subgroup PI targets set by the Ohio Department of Education (ODE) are also too low. As table 8 shows, more than 70 percent of Ohio schools met the achievement goal for economically disadvantaged students and more than 60 percent met goals for Black and Hispanic students, despite the learning losses and widening achievement gaps for these groups. While these goals will rise over time, they still don’t set rigorous expectations. None of the subgroup goals for 2024–25 match their pre-pandemic achievement levels, sending the message that the state is willing to tolerate learning losses into the second half of this decade (see the Appendix for the state’s amended performance goals).
Table 8: Percentage of schools meeting math and ELA PI goals by subgroup[22]
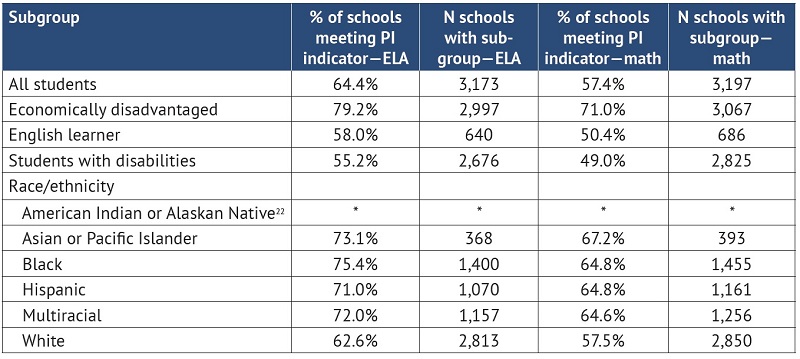
Note: The slightly larger number of schools with subgroup math versus ELA scores is likely due to the administration
Note: The slightly larger number of schools with subgroup math versus ELA scores is likely due to the administration
of two math assessments in high school versus one in English.Overall, the implementation of the new Gap Closing measure was good but imperfect. Structurally, the component is clearer and simpler, making it easier for the public and policymakers to see which student groups are achieving performance goals and which ones need more help. The balanced emphasis on subgroup achievement and growth is also commendable. State policymakers, however, must increase the rigor of the component by recalibrating the grading scale and increasing the PI targets. This will better identify schools in which all student groups are faring well academically as well as which ones are falling short and require more assistance.
Component 5: Early literacy
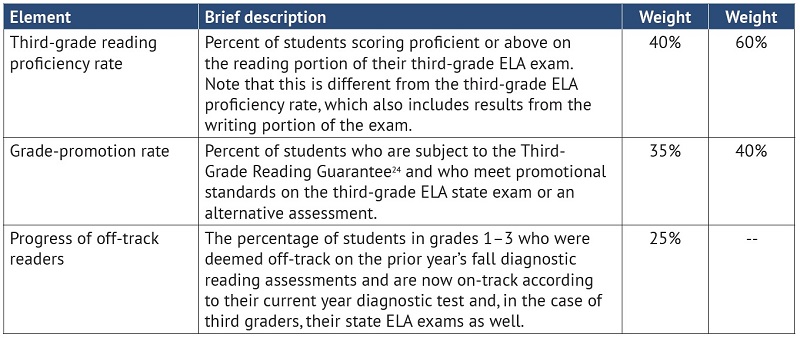
Much like Gap Closing, legislators also overhauled the Early Literacy component in the recent reforms. Seeking to create a more comprehensive picture of early literacy, they added two measures to this rating: third-grade reading proficiency rates and grade-promotion rates. These two measures are now incorporated alongside the existing “off-track” progress measure. Schools’ results on these measures are then combined into a weighted average, with greater emphasis given to third-grade reading proficiency, promotional rates, and off-track progress in that order. When schools are exempt from the off-track progress dimension,[23] the weights are 60 percent proficiency and 40 percent promotion rates.
Table 9: An overview of the Early Literacy component[24]
In 2021–22, almost universal grade promotion occurred, as the state waived conventional third-grade reading standards for the year.[25] Just over three in five Ohio third graders passed their reading exams last year, while the off-track reader progress rates were rather low. The sky-high promotion rates offset the poor rates of progress, and the median district and school’s weighted average settled just above the reading-proficiency rate.
Figure 7: Median district and school-level early-literacy rates, 2021–22
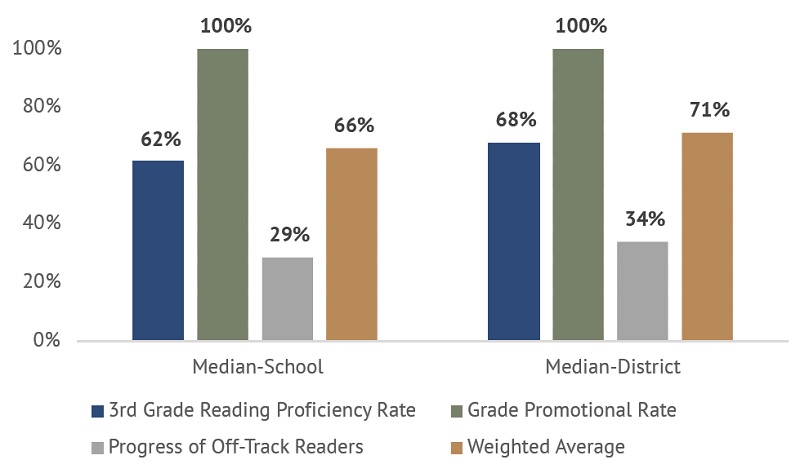
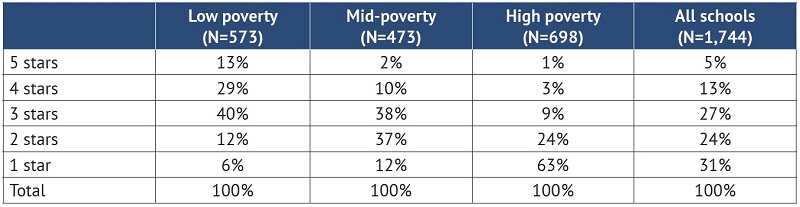
Even with the “easy” promotion rate dimension, a slight majority of Ohio schools received one- or two-star ratings last year. High-poverty schools tended to struggle most on Early Literacy, with 63 percent of them receiving one star. As noted above, the disappointing rates of off-track readers’ progress in many Ohio schools account for these ratings—and the grading scale isn’t to blame. In fact, to achieve a three-star rating, a school would need to move just 35 percent of its off-track readers to on-track status, provided they register 95 percent promotion and 65 percent proficiency rates.
[26] That performance expectation isn’t unreasonable, especially given the critical importance of ensuring that all children read fluently by the end of third grade.
Figure 8: Early Literacy ratings, Ohio schools, 2018–19 and 2021–22
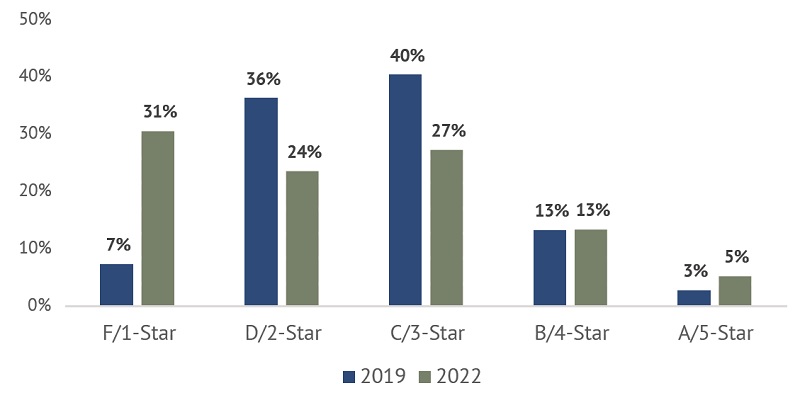
Table 10: Distribution of Early Literacy ratings by poverty tier, Ohio schools, 2021–22
Note: Any school whose student population is 0–33.3 percent economically disadvantaged is considered low poverty;
Note: Any school whose student population is 0–33.3 percent economically disadvantaged is considered low poverty;
any school whose student population is 33.4–66.7 percent economically disadvantaged is mid-poverty; and any
school whose student population is 66.8–100 percent economically disadvantaged is high poverty.
Coming soon: Overall ratings and an overhauled postsecondary readiness component
The component ratings—and data that underlie them—all help the public, educators, and policymakers dig into a district or school’s strengths and weaknesses. But for many Ohioans, especially those who aren’t as familiar with education metrics, the Overall rating offers an invaluable “bottom line” of school quality. Although the 2021–22 report card did not feature an Overall rating, it will return next year, having last appeared in 2018–19.
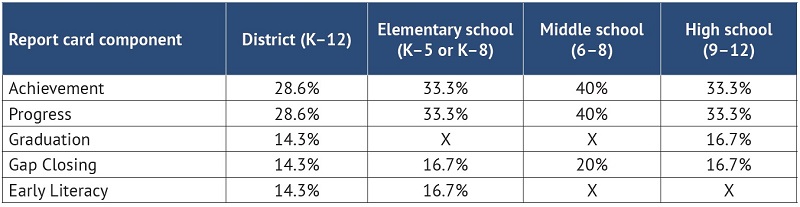
Lawmakers did tweak the methodology for combining the results into a single mark. The new weighting system rightly places more emphasis on the core Achievement and Progress components. By law, they are now given twice the weight of the other components, whereas they had previously received about 1.2 to 1.3 times the weight of the others.[27] Based on their component results, schools will receive a total number of “overall points,” which will then be used to determine the summative rating.[28] Unlike the component ratings, which are given as whole stars, the Overall mark will include half-star ratings.
Table 11: The Overall rating system for school districts and selected school grade spans
Note: Overall ratings using these weights will first appear for the 2022–23 school year. Pending approval by a
Note: Overall ratings using these weights will first appear for the 2022–23 school year. Pending approval by a
legislative committee, the College, Career, Workforce, and Military Readiness (CCWMR) component will be implemented as a graded component starting in 2024–25, and the weights will be adjusted (CCWMR will receive the same weight as Gap Closing, etc.).
Further out, Ohioans can look forward to an overhauled College, Career, Workforce, and Military Readiness (CCWMR) component. This is a revamped version of the component formerly known as Prepared for Success that will include new indicators of college and career readiness, such as how many students enlist in the military after high school and how many students complete an apprenticeship during high school. Although Ohio released relevant data in 2021–22—e.g., ACT or SAT remediation free, industry credentials, and AP or IB pass rates—it did not use them to generate a component rating. ODE is tasked with reviewing these data and proposing a grading scale for the component; a legislative committee is responsible for approving it as a rated component starting in 2024–25.
Conclusion and recommendations
With legislative reforms now on the books, the 2021–22 school year marked a new day for Ohio’s school report card. This iteration promises fairer and more accurate school ratings and—with any luck—less political contention about the system. Through the five-star rating system, the updated framework continues to offer Ohio parents and the public a clear picture of schools’ academic quality. For policymakers and community leaders, the report card offers a trove of data and multiple ratings that allow them to track trends and gauge the strengths and weaknesses of local schools.
Overall, the new report card is big step in the right direction for Ohio. Hence, our first recommendation to state lawmakers is this: Please stay the course. On too many occasions, Ohio has adopted promising education policies only to backpedal in the early years of implementation. We hope this doesn’t happen here. To their credit, Ohio lawmakers, state board members, and Department of Education leadership have worked together to design and implement a high-quality report card, perhaps one of the finest in the nation. It would be a grave disservice to Ohioans if these efforts were weakened or undone by future policymakers.
Second, Ohio should follow through and complete the full implementation of the College, Career, Workforce, and Military Readiness component by making it a rated element starting in 2024–25. With significant changes to this dimension, the legislative reforms smartly call for a transitional period in which postsecondary readiness data are reported but not used to produce ratings. In order for a rating to appear in fall 2025, statute requires the Joint Committee on Agency Rule Review to approve ODE’s system for implementing this rating. When up for review, we urge approval. The component rating will offer the public a clear sense of how districts and high schools fulfill one their core academic missions—to ready young people for their next step in life, whether college or career. Approval will also ensure that postsecondary readiness contributes to the Overall rating of a district or high school.
Third, the state board of education and ODE need to increase the rigor of the Gap Closing component. This element plays an integral role in the report card, as it ensures that schools pay attention to academic needs of all student groups. Although the reforms establish a stronger Gap Closing framework, its implementation was imperfectly executed. To strengthen the component, the state board of education should increase the performance standards (i.e., “cut scores”) that schools must achieve to earn top Gap Closing ratings. In addition, ODE should also reevaluate its low subgroup PI targets. With these tweaks, a more honest picture of how effectively schools are serving all students should begin to emerge.
For two decades, the report card has shed light on how Ohio’s 1.6 million students fare academically and how effectively the state’s roughly 600 districts and 3,300 public schools move the achievement needle. That sunlight is still needed today, as achievement gaps continue to persist (and have even widened, in the post-pandemic era) and thousands of students still struggle to exit high school with the academic skills necessary for college and career. Fortunately, Ohio’s policymakers have recognized the critical role of the report card and worked hard to strengthen it. Their efforts have created a better-functioning report card that now offers parents and the public a clearer and better look at academic performance across Ohio. That’s something we can all cheer about.
Acknowledgments
I wish to thank to my Fordham Institute colleagues Michael J. Petrilli, Chester E. Finn, Jr., Chad L. Aldis, and Jessica Poiner for their thoughtful feedback during the drafting process. Jeff Murray provided expert assistance in report production and dissemination. Special thanks to Pamela Tatz who copy edited the manuscript and Andy Kittles who created the design. All errors, however, are my own.
- Aaron Churchill
Thomas B. Fordham Institute
ENDNOTES
[3] For analyses of learning losses between 2018–19 and 2021–22, see Vladimir Kogan, Academic Achievement an Pandemic Recovery in Ohio (Columbus, OH: The Ohio State University, September 2022), and Aaron Churchill, “Assessing the academic wreckage of the pandemic in Ohio,” Ohio Gadfly Daily, Thomas B. Fordham Institute, September 29, 2022.
[4] To be in the Advanced Plus category, students must be on a formal acceleration plan, take an above-grade-level assessment, and achieve a score of advanced. Just 0.9 percent of Ohio students achieved this level in 2021–22.
[5] The district top 2 percent average is used for district ratings; the school-level average is used for individual school ratings.
[6] In 2018–19, the statewide average index score was 84.7; in 2021–22, it was 79.3. The “grading scale” for the PI did not change during this period and doesn’t explain the bump in ratings.
[7] For a high-level explanation of value-added measures generally, see Isaac M. Opper, Value-Added Modeling 101: Using Student Test Scores to Help Measure Teaching Effectiveness (Santa Monica, CA: RAND Corporation, 2019). For more specific information about Ohio’s value-added model, see SAS, Statistical Models and Business Rules (Cary, NC: SAS Institute, 2020), and SAS, Common Questions about Ohio’s Value-Added Student Growth Measure (Cary, NC: SAS Institute, 2019).
[8] Under the former system, the cut points for value-added ratings were index scores of A = +2.0 or above; B = +1.0 to +2.0; C = -1.0 to +1.0; D = -1.0 to -2.0; and F = -2.0 or below.
[9] Districts must achieve an effect size of +0.1 or above to receive five stars and -0.1 or below to receive one star.
[10] Ohio Revised Code 3302.03(D)(4)(b).
[11] Lower graduation rates are also a possible explanation, though the statewide four-year graduation rate was higher in 2021-22 than in 2018-19 (87 versus 85 percent), as were five-year rates (89 versus 86 percent).
[12] The previous report-card system relied on a “points” system to combine the four- and five-year graduation rates into a composite score to determine the component rating, so I calculate the weighted four- and five-year average graduation rates that are equivalent to the new system. The “cut points” for the old system are available at ODE, Appendix B: ESSA Sections A.1-A.4.
[13] The old system employed a “points” type system that awarded full credit if a particular subgroup achieved PI and graduation rate targets and then, through a complex calculation, provided “partial credit” if a subgroup missed the target but demonstrated year-to-year improvement on these measures. A full description of the former Gap Closing component is available at Ohio Department of Education, 2019–2020 AMO Gap Closing Measure (Columbus, OH: Ohio Department of Education, 2020).
[14] In the old system, a school that failed to achieve a PI goal could receive full credit if that subgroup had a value-added index score of +1.0 or above. The problem with this type of “either-or” system is that it allows poor student achievement or growth to be ignored.
[15] ODE significantly adjusted downward the PI goals in response to pandemic learning loss, and those goals are found in its amended ESSA plan. The goals, however, will gradually increase each year. The value-added goals are tied to the Progress rating system and do not change from year to year. Detailed information about the current Gap Closing component is available at Ohio Department of Education, 2021–2022 School Year: Gap Closing Component—Technical Documentation (Columbus, OH: Ohio Department of Education, 2022).
[16] No partial points are awarded, including for the special elements that are worth five points.
[17] The value-added effect size is not applied in the subgroup growth system.
[18] The chronic absenteeism element was not included in the 2021–22 Gap Closing calculations but will be added starting in 2022–23. It will be worth five points. Schools can meet the chronic-absenteeism indicator by either achieving a rate below the state’s target for the year or posting lower rates compared to the year prior.
[19] The English learner: Alt. assessment element is a federally required measure looks at the percentage of English learners who make progress on an alternative literacy assessment.
[20] The Gap Closing grading scale was overhauled in the new report card. The scale is as follows: 5 stars = 60–100 percent; 4 stars = 45–60 percent; 3 stars = 30–45 percent; 2 stars = 10–30 percent; and 1 star = 0–10 percent.
[21] Ohio Administrative Code 3301-28-10(M).
[22] Only one school had enough Native American or Native Alaskan students to have a PI score reported for this subgroup
[23] Under state law, if less than 10 percent of a school’s Kindergarten students are deemed off-track, this element does not apply.
[24] Ohio law exempts certain English learners and special-education students from the Third Grade Reading Guarantee’s grade promotion standards. In 2018–19, the most recent year the promotional requirements were in effect, 6.2 percent of third graders were exempt. For more about the Guarantee and its promotional standards, see Ohio Department of Education, Guidance Manual on the Third Grade Reading Guarantee: School Year 2019–2020 (Columbus, OH: Ohio Department of Education, 2020).
[25] Third-grade reading promotional standards go back into effect in 2022–23.
[26] The weighted average in this example is 68 percent. The Early Literacy grading scale is as follows: 5 stars = 88–100 percent; 4 stars = 78–88 percent; 3 stars = 68–78 percent; 2 stars = 58–68 percent; and 1 star = 0–58 percent.