The past two school years have been anything but normal due to pandemic disruptions, with student achievement showing the strain. State testing results from 2020–21 released last September revealed that Ohio students had lost approximately one-third to a full year of learning relative to pre-pandemic cohorts. Those data, however, were not a complete “census” of achievement, as larger-than-usual numbers of students were untested. Those data also couldn’t yet capture any bounce-back from schools’ academic recovery efforts.
Now with state assessment results from 2021–22 in hand, we’re getting a clearer sense of where students stand academically as we enter a post-pandemic era. In an important analysis, Professor Vlad Kogan of Ohio State University has already examined whether achievement in Ohio rebounded from the dips seen in 2020–21. He finds some bounce-back in reading but—dishearteningly—almost no recovery in math. Allow me to offer another accounting of the academic toll of the pandemic, and its especially severe impacts on disadvantaged pupils.
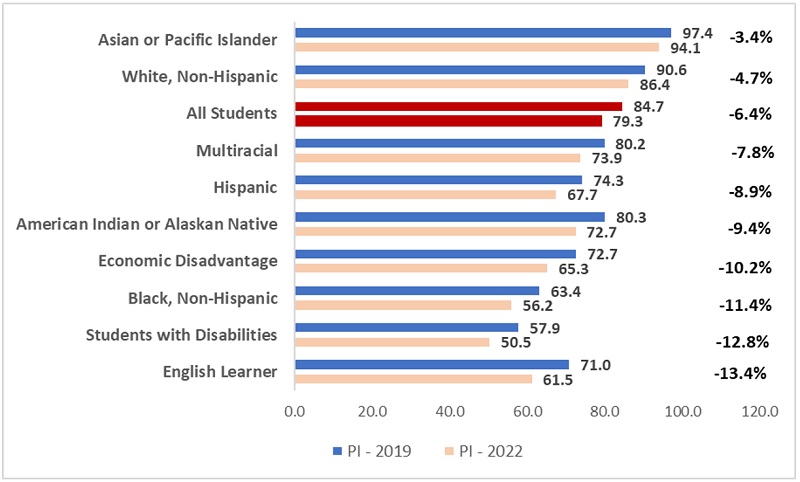
We begin with the big picture. Figure 1 displays the statewide performance index (PI) score for all students taking state exams, along with a breakdown of scores by the various student groups defined in federal and state law. The learning losses are clear. The overall statewide PI score fell from 84.7 to 79.3 from 2018–19 (the last pre-pandemic year) to 2021–22, a 6.4 percent slide. All the more striking is the large, double-digit declines among economically disadvantaged students, Black students, students with disabilities, and English learners—losses that widened the massive achievement gaps that existed before the pandemic. For instance, as measured by PI scores, Ohio’s Black-White achievement gap was 27.2 points in 2018–19. Now that gap is 30.2 points.
Figure 1: Ohio’s performance index scores, overall and by student group, 2018–19 and 2021–22
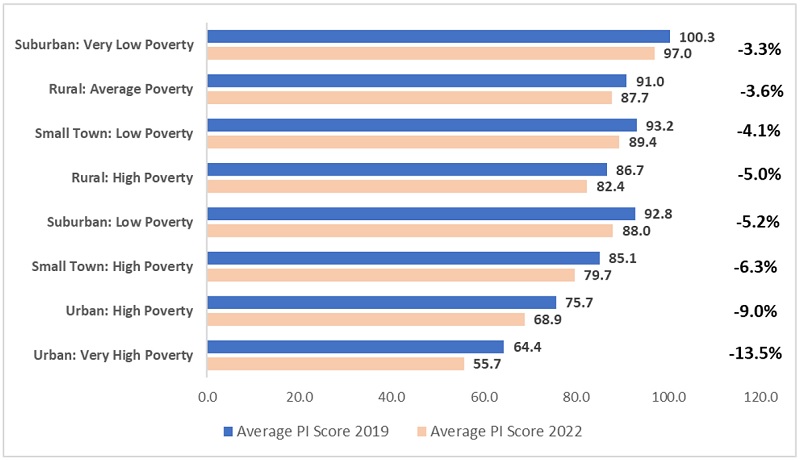
The next chart displays results by typology, a way of grouping schools by their geographic and socio-economic characteristics. Again, the learning losses are stark, but we see more pronounced impacts on students living in Ohio’s urban areas, where more low-income, Black, and Hispanic students reside. The average PI score in the “urban: high poverty” category fell by 9 percent. (This group encompasses inner-ring districts like South-Western and East Cleveland, along with smaller cities such as Lima and Mansfield.) Meanwhile, the largest declines in PI scores are visible in the Ohio Big Eight cities—i.e., the “urban: very high poverty” typology—where achievement fell by a staggering 13.6 percent. (The Big Eight are listed below in figure 4.)
Figure 2: Average performance index scores by typology, 2018–19 and 2021–22
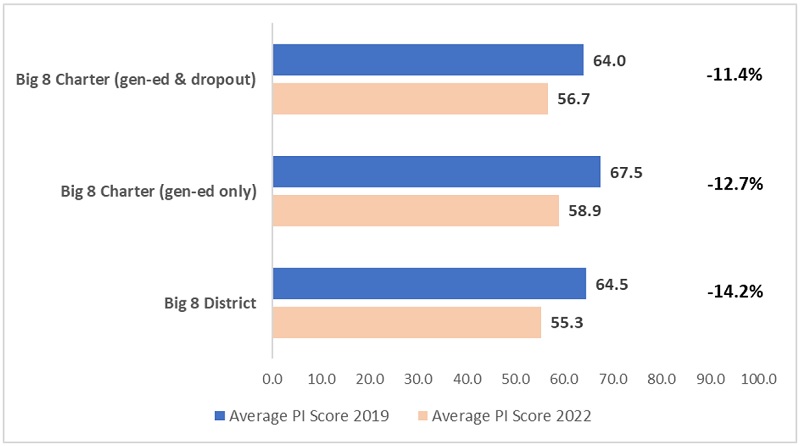
The next two figures focus on the Big Eight. Three in four Ohio charter schools are located in these cities, so we disaggregate the results by sector. Figure 3 indicates that PI scores are broadly similar both pre- and post-pandemic, with a slight edge to charters when one looks only at general-education charters in these cities. Pandemic learning losses are enormous in both sectors—steeper than the statewide average—so no one in these cities can really celebrate. Nevertheless, the Big Eight charter average—including both general-education and dropout-recovery schools—declined less than the Big Eight district average during this period (-11.4 versus -14.2 percent). Within the charter sector, losses were slightly larger in its general-education schools (-12.7 percent), with the less severe overall charter decline reflecting a slight gain in average PI scores for dropout-recovery schools located in these cities.
Figure 3: PI scores for the Big Eight cities, district and charter, 2018–19 and 2021–22
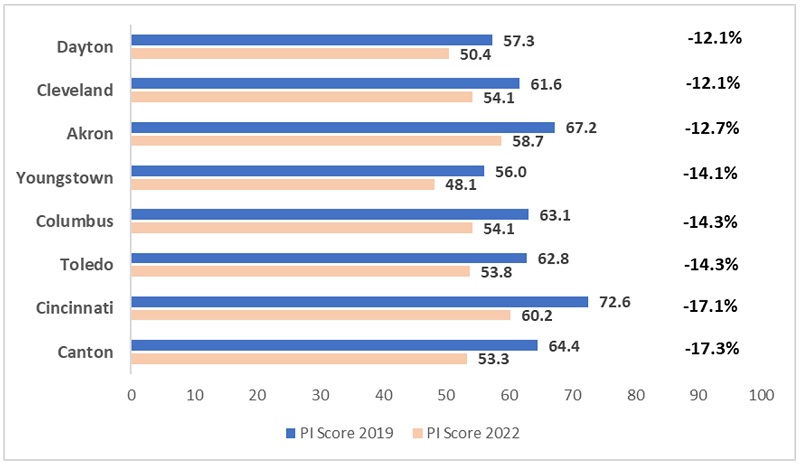
Last, figure 4 focuses on the Big Eight district results. Here, we see some variation in the extent of students’ learning losses. Canton and Cincinnati school districts lost more ground on the PI measure (-17 percent), while Cleveland and Dayton suffered relatively smaller losses during the pandemic (-12 percent). Nevertheless, Cincinnati still outperforms the other districts post-pandemic.
Figure 4: PI scores across the Ohio Big Eight districts, 2018-19 and 2021-22
* * *
The data are clear: Ohio students lost significant ground in math and reading during the pandemic, with disadvantaged students paying the heftiest price. Now the question is whether schools will turbocharge student learning—above and beyond the normal pace—so that the Covid-generation of students doesn’t leave high school ill-prepared. Can Ohio get students back on track? It’s a tall order, but tens of thousands of Ohio students are relying on their schools for the knowledge and skills needed for success in life.