Mobile Navigation

  • National
    • Policy
      • High Expectations
      • Quality Choices
      • Personalized Pathways
    • Research
    • Commentary
      • Gadfly Newsletter
      • Flypaper Blog
    • Events
    • Scholars Program
  • Ohio
    • Policy
      • Priorities
      • Media & Testimony
    • Research
    • Commentary
      • Ohio Education Gadfly Biweekly
      • Ohio Gadfly Daily
  • Charter Authorizing
    • Application
    • Sponsored Schools
    • Resources
  • About
    • Mission
    • Board
    • Staff
    • Career
Home
Home
Advancing Educational Excellence

Main Navigation

  • National
  • Ohio
  • Charter Authorizing
  • About

Ohio Menu

  • Topics
    • Accountability & Testing
    • Advanced Education
    • Career & Technical Education
    • Charter Schools
    • Curriculum & Instruction
    • ESSA
    • Evidence-Based Learning
    • Governance
    • Personalized Learning
    • Private School Choice
    • School Finance
    • Standards
    • Teachers & School Leaders
  • Research
  • Policy
  • Commentary
    • Ohio Gadfly Newsletter
    • Ohio Gadfly Blog
    • Events

The Education Gadfly Weekly

Sign Up to Receive Fordham Updates

We'll send you quality research, commentary, analysis, and news on the education issues you care about.
Thank you for signing up!
Please check your email to confirm the subscription.

Ohio Gadfly—What the Ohio Senate got right (and wrong) in its school funding plan

Volume 19, Number 12
6.6.2025
6.6.2025

Ohio Gadfly—What the Ohio Senate got right (and wrong) in its school funding plan

Volume 19, Number 12
view
Senate budget plan blog image
School Funding

What the Ohio Senate got right (and wrong) in its school funding plan

Going into this year’s state budget debates, the biggest question in K–12 education was how lawmakers would handle school funding. Ohio has been implementing the Cupp-Patterson school funding formula since FY22.

Aaron Churchill 6.6.2025
OhioOhio Gadfly Daily

What the Ohio Senate got right (and wrong) in its school funding plan

Aaron Churchill
6.6.2025
Ohio Gadfly Daily

Recent survey data back Ohio’s push for stronger math instruction

Jessica Poiner
6.9.2025
Ohio Gadfly Daily

Two steps forward, three steps back: Charter schools and the Senate education plan

Aaron Churchill
6.9.2025
Ohio Gadfly Daily

Ohio teachers’ inflation-adjusted salaries are declining due to bad district management

Stéphane Lavertu
6.3.2025
Ohio Gadfly Daily

Ohio’s elementary teacher prep programs need a stronger focus on math

Aaron Churchill
6.2.2025
Ohio Gadfly Daily

A closer look at the research on teacher merit pay

Jessica Poiner
6.2.2025
Ohio Gadfly Daily

Impacts of gender-matching between student and tutor

Jeff Murray
6.10.2025
Ohio Gadfly Daily

The supply side of private school choice programs

Jeff Murray
6.5.2025
Flypaper

Interested party testimony provided on House Bill 96—6/5/25

Chad L. Aldis
6.5.2025
Ohio Gadfly Daily
view
Gallup math survey results blog image

Recent survey data back Ohio’s push for stronger math instruction

Jessica Poiner 6.9.2025
Ohio Gadfly Daily
view
Senate and charters blog image

Two steps forward, three steps back: Charter schools and the Senate education plan

Aaron Churchill 6.9.2025
Ohio Gadfly Daily
view
Teacher salaries declining blog image

Ohio teachers’ inflation-adjusted salaries are declining due to bad district management

Stéphane Lavertu 6.3.2025
Ohio Gadfly Daily
view
Ohio teacher prep - math content blog image

Ohio’s elementary teacher prep programs need a stronger focus on math

Aaron Churchill 6.2.2025
Ohio Gadfly Daily
view
Teacher merit pay research blog image

A closer look at the research on teacher merit pay

Jessica Poiner 6.2.2025
Ohio Gadfly Daily
view
Tutor gender and girls STEM interest SR image

Impacts of gender-matching between student and tutor

Jeff Murray 6.10.2025
Ohio Gadfly Daily
view
tuition and piggy bank

The supply side of private school choice programs

Jeff Murray 6.5.2025
Flypaper
view
Chad Aldis Testimony on House Bill 96 6-5-25 image

Interested party testimony provided on House Bill 96—6/5/25

Chad L. Aldis 6.5.2025
Ohio Gadfly Daily
view
Senate budget plan blog image

What the Ohio Senate got right (and wrong) in its school funding plan

Aaron Churchill
6.6.2025
Ohio Gadfly Daily

Going into this year’s state budget debates, the biggest question in K–12 education was how lawmakers would handle school funding. Ohio has been implementing the Cupp-Patterson school funding formula since FY22. While it has garnered praise from the establishment, its inputs-driven approach has produced expensive funding prescriptions, resulting in a messy formula “phase-in” over the past four years and concerns about its long-term sustainability. Other structural flaws, such as the persistent use of inflated economically disadvantaged rates and guarantees for districts with declining enrollment, have also blemished the plan.

With the budget process speeding to the finish line, we now have three funding plans on the table. In his budget, Governor DeWine fully phased-in Cupp-Patterson, but also proposed to scale back its guarantees and—likely in a cost-conscious move—declined to update the formula “inputs” (e.g., educator salaries and benefits) that have risen significantly in recent years. In a clearer break from Cupp-Patterson, the House essentially froze the formula and put forward a “bridge” plan that would fund the vast majority of districts through a massive guarantee.

This week, the Senate unveiled its school funding proposal. The upper chamber adhered more closely to the governor’s approach—preserving the basic outline of Cupp-Patterson—but with substantive modifications. In a nutshell, it: 

  • Fully phases-in the increased base per-pupil funding called for under Cupp-Patterson (same as governor);

  • Constrains formula costs by declining to update the inputs (same as governor);

  • Removes a smallish guarantee that provides excess funds outside of the formula to a handful of districts (i.e., supplemental targeted assistance, which presently costs the state about $50 million per year).

  • However, unlike the governor’s bolder approach to dialing back guarantees, the Senate fully maintains the largest and most expensive guarantees (i.e., temporary transitional aid and formula transition supplement, which together cost the state roughly $300 million this year);

  • Phases-in a revised funding element intended to support low-income students;

  • Introduces a new performance-based component.

Now to the details…

Overall funding levels

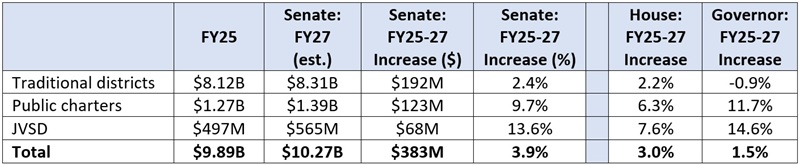
The Senate plan is the most generous of the three proposals, with state foundation aid for public schools increasing by $383 million from FY25 to FY27 (up 3.9 percent). Traditional districts—despite having lost significant enrollments in recent years—receive an average funding bump of 2.4 percent, the highest among the plans. Meanwhile, public charter school and joint-vocational school district (JVSD) funding rises by 9.7 and 13.6 percent respectively under the Senate plan. The increases for these growing sectors clock-in below the governor’s proposal, but above the House plan. For charters, the decline relative to the governor’s plan likely reflects a proposed reduction to their equity supplement—a disappointing move that will be covered in more detail in a forthcoming piece on charter-specific issues.

Table 1: State foundation funding under the Senate plan

Senate budget plan blog table 1
Source: Analyses of Ohio Legislative Service Commission (LSC) funding projections and LSC Redbook for data on the governor’s plan. Note: FY26 estimates are omitted for display purposes. This table includes state foundation funding but excludes state property tax reimbursements, local and federal tax revenues, and several other funding streams. The charter numbers include the equity supplement in both FY25 and FY27, but do not include the high-quality dollars or facilities allowance (a forthcoming piece will discuss charter policy in the Senate plan).

Beyond total amounts, the Senate proposes a few structural changes. The most notable relate to funding for low-income students, guarantees, and performance-based funding.

Disadvantaged pupil impact aid (DPIA)

DPIA is a critical element of the formula. Its goal is to drive additional state aid to schools serving the most low-income students. The funding stream, however, has become a hot mess due to increasingly inaccurate data on “economically disadvantaged” students, as universal federal meals eligibility—the current method to identify poor students—has expanded rapidly across Ohio. Instead of targeting funds to the neediest students, the state has been misallocating DPIA due to large-scale over-identification. Inflated headcounts have led to ill-gotten windfalls for many mixed-income districts, while at the same time reducing DPIA for truly high-poverty schools. 

The Senate plan takes commendable steps forward in fixing DPIA. In FY26, the state would calculate a composite “economically disadvantaged” enrollment, which is 75 percent based on the current (but flawed) meals-driven headcount, and 25 percent based on more accurate “direct certification” headcount, a method that identifies low-income students based on other means-tested programs like SNAP or Medicaid. In FY27, the split would be 65 percent meals-based and 35 percent direct certified. This composite enrollment measure would then drive DPIA to schools.

This is a good start, but it still allows bad data to deliver the majority of DPIA. A more aggressive phase-out would create a 50/50 enrollment split in FY26 and move to full direct certification in FY27. The Senate also did not increase the base DPIA amount (presently $422 per economically disadvantaged pupil). As the bill is finalized, lawmakers should strongly consider increasing the DPIA base. This would compensate for the lower, but more accurate, direct certification rates while also concentrating more dollars on low-income students.

Guarantees

One of the most-discussed issues this year has been guarantees. The conversation started with Governor DeWine coming out strong against continuing to fund “empty desks,” which is what guarantees do when districts with declining enrollments receive these non-formula subsidies. In his budget outline, he ratcheted back the guarantee bases—the historical funding benchmarks under which current state aid cannot fall. The lower bases result in a quicker sunsetting of the guarantee and fewer districts covered by them.

Unfortunately, the Senate did not follow the governor’s lead on guarantee-base reductions. The heftier guarantees premised on FY20 and FY21 state funding levels—with generally higher enrollment data from those years baked in—remain fully intact under its plan. The chamber, however, did remove a smallish guarantee-like element known as “supplemental targeted assistance.” And thankfully, it didn’t go the direction of the House and implement a huge guarantee based on FY25 funding. In LSC funding projections, the Senate plan would entail some modest cuts in more than 100 districts’ state funding (relative to current amounts), though the reductions are not nearly as steep as what the governor has proposed.

Performance-based funding

The Senate funding plan provides additional funds to districts (though not charters or JVSDs) that achieve one of the following: (1) four-or five-star Overall state ratings; (2) three-star and above ratings on the Progress dimension; or (3) increased Progress rating by one or more stars compared to the year prior. Districts receive an additional $26 per pupil times the number of stars they receive on the Overall or Progress dimension, whichever is higher. For example, a district that earns five stars Overall would receive $130 per pupil in performance funding.

At face value, the idea of performance-based funding linked to state ratings has merit. But the way the Senate designed the proposal is flawed. Here’s why:

1) The funds (for both years of the biennium) are awarded based on 2023-24 ratings. The problem here is that districts already know whether they will qualify for these funds. That means the dollars provide zero incentive for districts to improve. Why work any harder for students if the results are already on the books? A performance-based system must be based on prospective ratings to be an effective motivator.

2) The rating criteria are far too lax. Roughly 400 districts—about two in three—met the Overall or Progress rating criteria in 2023–24. When a large majority of districts are eligible, the element isn’t rewarding true excellence. For many districts, the funding would be little more than a nominal payment for being barely better than average. The approach is also regressive, apt to favor high-wealth districts that typically fare better on the Overall rating than less advantaged districts.

3) The funds are given to entire districts, which makes it improbable that they’ll ever be used to reward the educators who helped drive the results. In all likelihood, the funds will go into districts’ general operating budgets to cover day-to-day expenses instead of being distributed as merit-based bonuses. This, too, undermines any intended financial incentive for schools and educators to improve student outcomes.

***

Overall, the Senate plan is superior to the House’s unacceptable guarantee-driven system. It is also superior to the governor’s plan in terms of its transition to a revamped DPIA. But relative to the governor, the Senate plan falls short when it comes to guarantees, a couple of important charter funding streams, and its questionable performance-based component. As policymakers head into conference committee, they should incorporate the best of all three proposals and produce a fiscally responsible, student-centered funding system.

view
Gallup math survey results blog image

Recent survey data back Ohio’s push for stronger math instruction

Jessica Poiner
6.9.2025
Ohio Gadfly Daily

After a very busy spring, lawmakers are rapidly approaching the finish line for the biennial state budget. Among the many key issues they are tackling is how to improve math achievement given that only half of Ohio students are proficient on state tests.

It’s been a bit of a rollercoaster so far. Governor DeWine wisely proposed expanding access to advanced math and implementing universal screeners in early grades, but overlooked promising ideas like identifying high-quality instructional materials (HQIM) and addressing teacher math content knowledge. In April, the House scrapped almost all of DeWine’s math provisions. And then, last week, the Senate restored DeWine’s proposals and added a few smart ones of their own. 

Amidst all this back and forth, some Ohioans might be wondering if improving numeracy policy is worth all the fuss. According to a recent report from Gallup, the answer is unequivocally yes. The national survey, which is part of a larger “Math Matters” series, gathered feedback from a nationally representative sample of 1,471 education leaders (203 superintendents and 1,268 principals) and 808 parents of K–12 students. Let’s examine four big takeaways and how they apply to Ohio.

1. High-quality instructional materials are essential.

Research demonstrates that HQIM can improve student learning and achievement. But the Gallup report wisely notes that teachers “must be knowledgeable about HQIM, and the materials’ implications for student learning, to leverage them effectively.” And unfortunately, survey results indicate that only one in five education leaders are “very familiar” with the concept of HQIM.

One would hope that in Ohio—where HQIM has been a hot topic for years courtesy of the state’s science of reading initiative—principals and superintendents are among those who are “very familiar” with the concept. After all, they’re currently required to select their reading curricula and instructional materials from a state-approved list of HQIM. But that list only exists for reading. There is no such list for math, which means that education leaders could be struggling to select high-quality options.

The Senate’s version of the budget solves this problem. It requires the Department of Education and Workforce (DEW) to establish a list of high-quality math core curriculum and a list of evidence-based math intervention programs. Although public schools wouldn’t be required to use what appears on the state’s list, they would have to report their math core curriculum and instructional materials to the state. This is an important transparency measure that will help state leaders and advocates determine how many schools are using HQIM in math.

2. Current and future teachers need better training in math.

Research indicates that when professional development (PD) is aligned to curriculum and content it better supports teachers. That, in turn, can lead to improved student outcomes. The Gallup survey finds that about 59 percent of education leaders report that their math-related PD is completely or mostly aligned with their curriculum. Meanwhile, more than a third (39 percent) of leaders would rate the quality of their school or district math-related professional learning as fair or poor.

The Gallup survey doesn’t mention teacher preparation, but that’s equally important. A recent report from the National Council on Teacher Quality (NCTQ) found that when it comes to how much time preparation programs spend training teacher candidates in math content, more than a third (36 percent) of Ohio’s elementary programs earned a grade of D or F for failing to provide sufficient instruction. Moreover, Ohio’s current teacher licensure standards allow an elementary teaching candidate who fails the math section of the state’s composite content knowledge exam to still teach math as long as they earn an overall passing score.

Taken together, the issues uncovered by Gallup and NCTQ suggest that many Ohio teachers—both current and future—aren’t receiving the kind of training they need. Bolstering pre-service teacher training efforts (see here and here for ideas) and providing content-aligned PD (like what Ohio is already doing in reading) would go a long way toward addressing these issues.

3. Ohio must address its teacher data problem.

According to Gallup, reports of staffing challenges are “widespread” across content areas but are the worst in math. Forty-eight percent of education leaders say that finding well-qualified math teachers is “very challenging,” compared to 42 percent for science, 21 percent for English language arts, and 13 percent for social studies. Meanwhile, some schools are struggling more than others. Education leaders serving low-income communities, rural areas, and middle or high schools are more likely than their peers to say they experience challenges while hiring math teachers.

It’s likely these discrepancies also exist in Ohio. But we have no way of knowing for sure, because Ohio doesn’t collect data on teacher vacancies. If the Senate’s version of the budget becomes law, that will change. After the House eliminated it, lawmakers in the upper chamber wisely restored DeWine’s proposal for DEW to collect and publish data on teacher vacancies. The Senate also strengthened the governor’s proposal by requiring DEW to report vacancy data at the district and school level and for charters and STEM schools. This information will be crucial in helping state and local leaders pinpoint potential teacher shortages not only in math, but other subjects, too.

4. Parents need more information from schools.

According to the Gallup results, only about half of parents receive regular communication from schools about what their child is learning in math. Forty-three percent report receiving “infrequent” communication, including 17 percent who say they receive no information at all.

Communication isn’t the only thing that parents find lacking. Although research shows that high-quality, frequent math tutoring can improve achievement, only 31 percent of parents report that their child receives one-on-one or small group math tutoring. Even fewer (13 percent) say it occurs more than once per week. Among the 69 percent of parents whose children are not enrolled in tutoring, almost half would enroll their student if it were available.

The Senate’s version of the budget could help Ohio parents on both fronts by requiring public schools to provide academic intervention services to students who score limited on math and reading state tests. Schools would also be required to develop an improvement and monitoring plan for each student who qualifies for intervention services in math, and to involve parents in developing that plan. (A similar policy already exists for reading.) These plans, which must be implemented until a student achieves current grade-level skills, must include high-dosage tutoring opportunities. Although these communication and intervention efforts wouldn’t happen for all kids—only students who score limited qualify—focusing on struggling students is a step in the right direction.

***

Over the next few weeks, policymakers will have to find a way to reconcile three very different budget proposals put forth by the governor, the House, and the Senate. In numeracy, at least, the choice should be simple: The Senate’s plan, which solves several problems highlighted by the Gallup survey, is the best path forward.

view
Senate and charters blog image

Two steps forward, three steps back: Charter schools and the Senate education plan

Aaron Churchill
6.9.2025
Ohio Gadfly Daily

Earlier this week, the Senate released its version of the biennial state budget, which includes education proposals on school funding, literacy and math, career pathways, and more. A previous piece examines how Senate lawmakers handled the funding formula—the mechanism used to allocate the bulk of state aid to districts and public charter schools. This analysis takes a closer look at how the Senate addressed several important charter-specific issues.

In short—relative to the House-passed budget—the Senate went backward by reducing the charter facility and equity supplements, and by allowing for possible reductions to high-quality charter funding. But it went forward by restoring strong performance criteria for the high-quality charter funding and expanding access to unused district facilities.

Before diving into details, some context is required, as it may have slipped the minds of policymakers and readers during the budget hullabaloo.

Ohio has long underfunded its charter schools, expecting them to operate on fewer dollars. Historically, they received about 70 cents on the dollar compared to similar district schools. Such a large gap was egregiously unfair to charter school students—disproportionately economically disadvantaged—who were shortchanged simply because of their choice in public school. This system also made it much harder for charters to compete for talented educators and limited their capacity to provide extra supports to students. Meanwhile, districts received billions in public resources for facilities, while charters got nothing—putting yet another constraint on their ability to serve more students.

Under the leadership of Governor DeWine and recent General Assemblies, Ohio has taken praiseworthy steps to rectify these inequities. Initiatives include a high-quality charter fund, an equity supplement for all brick-and-mortar charters, and a facilities allowance that helps cover a portion of building costs. The state has also attempted to support facility needs by requiring districts to offer underutilized buildings to charters for purchase or lease.

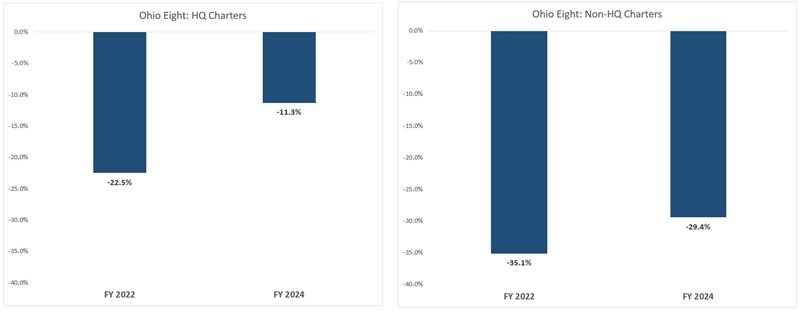
On the operating (non-facilities) side, the high-quality and equity supplements have put a significant dent in the funding gap. The figure below shows that urban charters qualifying for the high-quality funds faced an average shortfall of 11 percent relative to local districts in FY24. This was a much smaller gap than two years prior, and reflects the enhanced quality supplements passed in the last budget. Charters not meeting the criteria for quality dollars still face a sizeable gap relative to districts (-29 percent). However, some of that disparity has been filled by a $650 per pupil equity supplement, which was first provided to all brick-and-mortar charters in FY24.

Figure 1: Average funding shortfall relative to local districts, Ohio Eight charters by high-quality (HQ) status

Senate and charters blog Figure 1
Note: These numbers are from a previous analysis of the charter funding gap. More detail about the calculations is available here. The Ohio Eight refers to Akron, Canton, Cincinnati, Cleveland, Columbus, Dayton, Toledo, and Youngstown.

As for facilities, Ohio provides charters with a $1,000 per-pupil facility allowance. While this allotment has grown since the program was first enacted during the Kasich era, the current amount still falls short of fully covering charters’ facility needs as well as matching traditional districts’ annual spending on operating and maintaining buildings ($1,781 per pupil, excluding construction and debt service). Adding to the challenges, charters have largely been unable to access underused district buildings, as districts have played games to skirt provisions in state law.

In this year’s budget plan, Governor DeWine did another commendable job pushing charter policy in the right direction. He proposed maintaining current funding levels for the high-quality program (and the stringent performance bar to qualify) as well as the equity supplement. The governor also recommended an impressive boost in the facility allowance—upping it to $1,500 per pupil—and put forward a rewrite of the unused facility law that could free more buildings for charters.

To its credit, the House preserved the governor’s proposed funding amounts for the high-quality, equity, and facilities programs. But it erred by stripping out the unused facilities changes. It also included troubling carveouts that would allow more charters to receive quality-school funds even if they fall short of the current criteria.

How did the Senate do? As noted above, its plan is a mixed bag.

Steps forward

  • Unused facilities: The Senate wisely restored the governor’s strengthened language that adds clarity and sunlight to the process that districts must follow when they have an unused facility (vacant or less than 60 percent occupied). In response to concerns about mandatory disposal in legitimate cases of underutilization, the Senate included some smart guardrails and an appeal process to the state. The Senate also added new language allowing private schools, which face similar resource constraints, to bid on an unused facility alongside charters.

  • High-quality charter funding—performance criteria: The Senate wisely undid the House’s modifications to the performance criteria that would make it easier for mediocre schools to qualify for the dollars. As did the governor and House, the Senate maintained the current per-pupil funding amounts.

Steps backward

  • High-quality charter funding—possible “proration”: The Senate prohibits the Ohio Department of Education and Workforce from requesting additional funds from the state controlling board, should the program appropriation be insufficient to pay the full per-pupil allotment. Instead, under the Senate plan, the per-pupil amounts must be reduced (“prorated”) if more charters than expected achieve the performance marks. This would be an unfortunate cut—which has occurred in the past—just because more charters receive strong state ratings.

  • Equity supplement: Both the governor and House maintained the current $650 per pupil equity supplement in their budget proposals. The Senate, however, reduced the amount to $500 and $400 per pupil in FY26 and FY27, respectively. This would be a setback in the progress that Ohio has made to fund all brick-and-mortar charter schools more equitably.

  • Facilities allowance: The governor proposed and the House approved a significant increase in the facilities allowance to $1,500 per pupil. The Senate reduced those amounts to $1,100 and $1,200 per pupil in FY26 and FY27, respectively. While that’s still a bump over the current funding level, it’s disappointing that the Senate slashed the proposed increase.

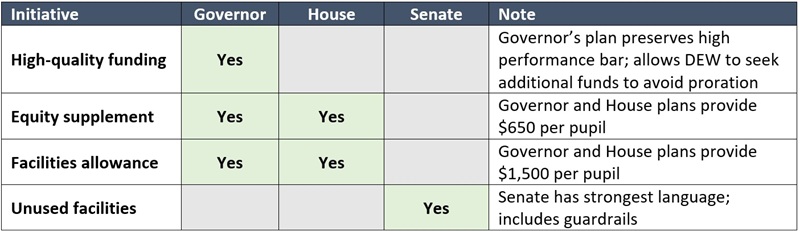
The table below sums up which of the legislative proposals are best when it comes to these four charter initiatives. The green boxes marked “yes” are the ones lawmakers should approve as they hammer out the final budget.

Table 1: Recommended charter proposals for the final budget bill

Senate and charters blog Table 1
Note: Multiple yes’s indicate no difference in proposal.

* * *

In a budget cycle in which lawmakers are clearly seeking to stretch taxpayer dollars to support proven, cost-effective programs, brick-and-mortar charter schools remain a strong investment. As a recent Fordham study on the high-quality program demonstrates, charters have wisely stewarded these funds to strengthen their educational delivery, and students benefited in turn. In the coming weeks, Ohio lawmakers should recommit to excellence and equity by finalizing a state budget that holds charters to high standards and provides fair funding for their students.

view
Teacher salaries declining blog image

Ohio teachers’ inflation-adjusted salaries are declining due to bad district management

Stéphane Lavertu
6.3.2025
Ohio Gadfly Daily

Research demonstrates that teachers are the single most important input in public schooling. Students with more effective teachers experience improvements in a whole range of education and life outcomes relative to students exposed to average (or worse) teachers. Attracting and retaining the most talented teachers is likely the most effective way to help students realize their potential.

That’s why teacher salaries are important. The more schools pay, the more likely they are to attract and retain talented teachers. Headwinds such as recent falloffs in school climate—as well as a long-term decline in the prestige of the teaching profession—make financial incentives even more important in recruiting and retaining effective teachers.

Unfortunately, as Chad Aldeman recently documented, inflation-adjusted teacher salaries have been flat since 2002. Meanwhile, spending on U.S. public schools increased by over 30 percent, adjusted for inflation, over the same time period. The Fordham Institute’s Michael Petrilli recently argued that the reason for stagnant teacher wages is that school districts—under pressure from teachers unions—have focused on hiring more teachers and other staff as opposed to increasing salaries.

Are Ohio’s teacher salaries also stagnant? If so, is it a district management issue, or has public funding become less generous? To answer these questions, I analyzed funding, salary, and staffing data at both the teacher and school levels.

The results in a nutshell: Adjusting for inflation, funding for Ohio public schools has consistently increased, but teacher salaries have declined since the 2018-19 school year. Further analysis indicates that this decline occurred because local districts have failed to downsize, refusing to reduce the number of teachers and (to a lesser degree) the number of schools, to align with declining student enrollment. If we wish to strengthen Ohio schools by recruiting the best and the brightest, districts must overcome local political forces that put adults’ jobs ahead of student needs.

School-level spending and teacher salary trends in Ohio

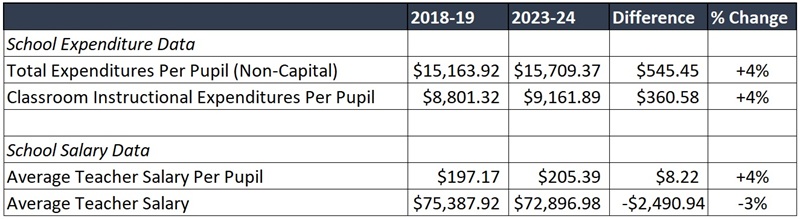
Table 1 (below) reveals that a decrease in public funding is not to blame for the decline in teachers’ salaries. The average Ohio school experienced an inflation-adjusted increase of 4 percent in total non-capital spending ($545 per pupil) between 2018-19 and 2023-24. Looking more narrowly at instructional expenditures (expenditures on salaries for teachers and aides working directly with students), we find a similar 4 percent increase ($360 per pupil) over that same span.

Table 1. School-level spending and average salaries (inflation adjusted, 2024 dollars)

Teacher salaries declining blog Table 1
Note. The table presents averages of school-level variables: total operating expenditures per pupil (including central district office), average teacher salaries, and average teacher salaries per student. Teacher and finance data are available from DEW’s report portal. Inflation adjustments were made using the federal Bureau of Economic Analysis’s Personal Consumption Expenditures Price Index.


The school expenditure data line up with school-level teacher salary data, which indicate a 4 percent increase in the average teacher salary per pupil. Yet, the average teacher salary in these schools declined by 3 percent (approximately $2,500 lower in 2018-19 than in 2023-24). How can this be?

Teacher salaries declined because schools’ teaching staffs expanded relative to enrollments

Statewide, enrollments in district schools declined by 4.9 percent between 2018-19 and 2023-24 (from approximately 1.55 million to approximately 1.47 million students). To right-size a district’s staff and portfolio of schools, the number of teachers and schools also needed to decline by 4.9 percent. Doing so would have enabled districts to increase their teacher salaries by at least 4 percent (the increase in per-pupil public funding indicated in Table 1).

Unfortunately, statewide, the total number of district teachers declined by only 0.7 percent over that span (from approximately 97,800 to approximately 97,100). School closures also failed to keep pace with enrollment losses, as the number of district schools declined by approximately 2.4 percent (from 3,064 to 2,992 between 2019 and 2024). Because the total number of Ohio teachers and schools did not decline by the necessary 4.9 percent, the average school now has more teachers and fewer students than it did during the 2018-19 school year.

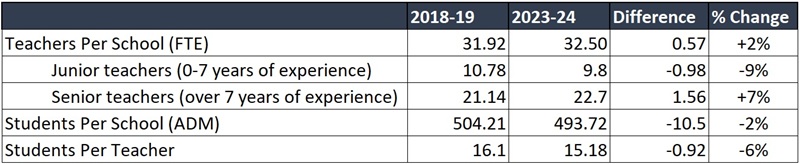
The school-level analysis in Table 2 illustrates the consequences precisely. The average public school now has a 2 percent larger teaching staff than the average school in 2018-19, and it has an enrollment that is 2 percent lower. In other words, the failure to right-size means more teachers in schools that remain open, as well as emptier buildings. Together, these differential trends led to a 6 percent reduction in the average student-teacher ratio in the average district school—one fewer student per teacher.

Table 2. School-level staffing and enrollments

Teacher salaries declining blog Table 2
Note. The table presents averages of school-level variables: average number of teachers per school (FTE), average number of teachers per school with 0-7 years of experience, average number of teachers per school with over seven years of experience, average number of students per school, and average number of students per teacher. Teacher and finance data are available from DEW’s report portal.

Importantly, the data indicate that districts protected the jobs of (relatively expensive) senior faculty, with junior teachers being let go first. The number of senior teachers (those with over seven years of experience) increased by 7 percent whereas the number of junior teachers (those with less than seven years of experience) declined by 9 percent.

Local school governance needs to be fixed

The 3 percent decline in inflation-adjusted average teacher salaries occurred even as total spending on teacher salaries increased by 4 percent. Suppose that districts had kept student-teacher ratios steady since 2019. With the same total budget, the average school could have given all teachers a $3,000 raise, which translates to a raise of 5.3 percent for the average junior teacher and a raise of 3.6 percent for the average senior teacher. Or, even better, suppose they gave the raises to the top 50 percent most effective teachers by rank. That would have been nearly $6,000 per teacher—about 11 percent for relatively effective junior teachers and over 7 percent for relatively effective senior teachers. But Ohio districts didn’t do that. Rather than investing in teacher quality and the long-term future of the educator workforce, they chose to protect the jobs of more senior teachers.

This poor personnel and financial management is unsurprising. District administrators lack managerial discretion. They are constrained by teacher tenure, which makes it difficult (if not impossible) to dismiss even atrocious senior teachers. Thus, predictably, districts were forced to thin their teaching forces by letting go or failing to hire new junior teachers. Current Ohio law also requires districts to adopt salary schedules based on years of experience and education. That means that essentially everyone with the same training and experience must be paid the same amount, regardless of their effectiveness. In other words, even if they wanted to, district administrators generally could not target larger raises to attract or retain the most talented teachers.

Moreover, Ohio’s collective bargaining law enables teachers unions to prescribe in detail how personnel must be managed—the pay schedule, class sizes, procedures for hiring and firing (last in, first out), and procedures for evaluation and classroom assignments. Collective bargaining agreements also often dictate the procedures for closing schools. Pile on top of that unions’ political power (they essentially help elect their own bosses to school boards) and Ohio’s superintendents are almost helpless in their efforts to direct resources toward their most productive ends.

There’s no easy fix. Reforming teacher tenure laws and salary schedules would be a great start. More fundamentally, reforming collective bargaining would be the most effective option, as it is the source of political power that maintains the status quo at the state and local levels. But public-sector unions are formidable political opponents and state lawmakers don’t seem to have the stomach to take them on again. It appears the best we can hope for in the short term is that the need for budget cuts as stimulus money dries up will provide political cover for administrators to let go of the least effective teachers and close half-empty schools. That could free up some funds to better compensate our most talented teachers going forward.

view
Ohio teacher prep - math content blog image

Ohio’s elementary teacher prep programs need a stronger focus on math

Aaron Churchill
6.2.2025
Ohio Gadfly Daily

With students’ math scores still mired in a post-Covid slump—and not so impressive prior to it—Ohio policymakers have begun exploring ways to improve math instruction. Most of the attention focuses on what happens in primary and secondary schools—e.g., high-quality curriculum for all, strong interventions for students who need them, and advanced coursework for those who are ready. Another critical policy lever runs through colleges and universities: Making sure that teaching candidates, including those expecting to work in elementary schools, have the knowledge and skills needed to effectively teach math.

Scholars have long expressed concerns about the mathematical prowess of U.S. teachers. Writing in the Los Angeles Times back in 2019, University of Virginia professor Daniel Willingham stated, “Many elementary teachers don’t understand math very well, and teaching it makes them anxious.” A recent Hechinger Report piece discusses how shaky content knowledge and math anxiety among teachers leads to shallow instruction, less time on the topic, and ultimately, diminished student achievement.

Concern around content knowledge doesn’t imply that elementary teachers struggle to recite basic math facts such as 5 x 5 = 25. Rather, the difficulties lie in the conceptual underpinnings of mathematical facts and procedures. For instance, it’s one thing to compute 0.75 x 0.60 using the standard algorithm. But it’s another thing to immediately intuit the answer is less than 0.75 and arrive at a reasonably accurate estimate using “mental math.” Doing that requires a deeper understanding; e.g., knowing that multiplication doesn’t always yield higher numbers, and that the problem entails splitting 0.75 by slightly less than half.[1]

Teaching children the algorithms and the concepts behind them—not to mention illustrating how math problems apply in the real world—takes considerable mathematical knowledge. As the landmark National Research Council report on numeracy stated, “The mathematics of the elementary and middle school curriculum is not trivial, and the underlying concepts and structures are worthy of serious, sustained study by teachers.”

Unfortunately, most educators don’t undertake the “serious, sustained study” needed for rigorous math instruction. That’s because too many preparation programs skimp on math content, particularly those training future elementary teachers. As evidence, consider a recent report from the National Council on Teacher Quality (NCTQ) which compares the time that prep programs spend training elementary candidates in math content to a minimum coursework standard of 105 hours.[2] The standard is informed by recommendations from the Conference Board of the Mathematical Sciences and the National Council of Teachers of Mathematics, along with an NCTQ-convened panel of math experts and survey input from practitioners. Nationwide, the study finds that undergraduate prep programs provide an average of eighty-five hours of instruction in math content, which is roughly 20 percent less than the recommended minimum. Graduate programs fare worse, averaging just fourteen hours of math content.

The averages, however, mask leaders and laggards among teacher preparation programs. Nationwide, 16 and 2 percent of undergraduate and graduate programs, respectively, meet the hour-based standard for math content and pedagogical coursework (A+ or A’s per the NCTQ analysis). On the other hand, 32 and 89 percent of undergraduate and graduate programs fall far below the standard (D’s or F’s).

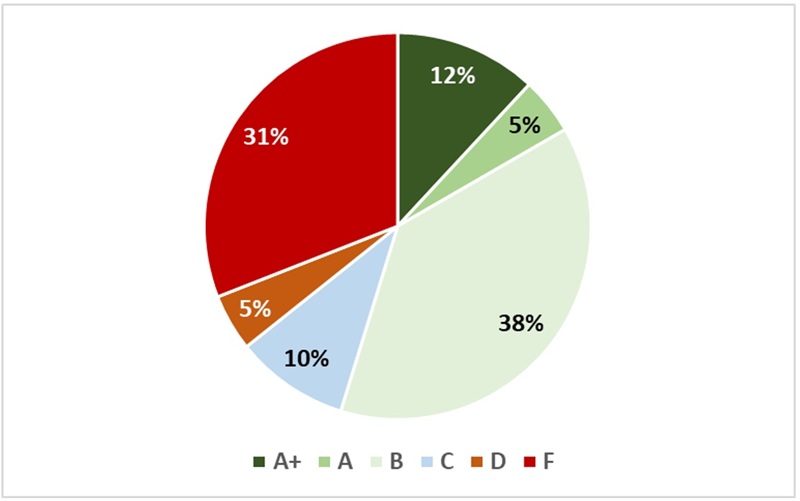
NCTQ finds similarly uneven results in Ohio. Figure 1 shows that just 17 percent of our elementary programs earn A+ or A’s—marks indicating sufficient time on math preparation. Meanwhile, 36 percent receive unacceptable D’s or F’s, with the rest receiving middling ratings.

Figure 1: NCTQ ratings of Ohio teacher preparation programs—elementary math

Ohio teacher prep - math content blog figure 1
Note: NCTQ rates teacher preparation programs based on the instructional hours allocated to math content and math pedagogy. For more on its rating system, see here. The analysis includes forty-two programs in Ohio.

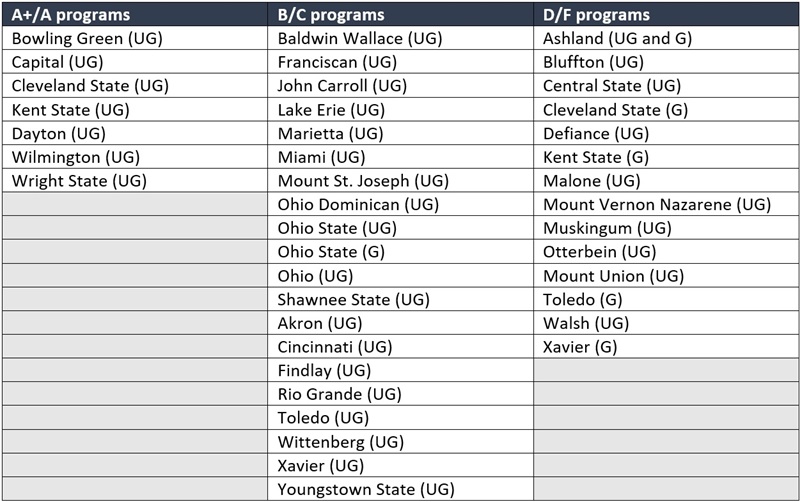
The table below displays the marks for each elementary teacher preparation program in Ohio. On the top end, we find seven exemplars: Bowling Green, Capital, Cleveland State, Kent State, Dayton, Wilmington, and Wright State. The middle of the pack includes some of the state’s largest preparation programs (Miami, Ohio State, Ohio), while several graduate programs and smaller undergraduate institutions bring up the rear.

Table 1: Individual teacher preparation program ratings—elementary math

Ohio teacher prep - math content blog table 1
Note: UG = Undergraduate; G = Graduate

To address shortcomings in math preparation, NCTQ offers a slate of solid recommendations for both leaders of preparation programs as well as state policymakers. Two state-level policy ideas merit special mention.

First, Ohio should articulate teacher preparation standards—something NCTQ indicates has not been done—to encourage effective and consistent elementary math training. Once standards have been developed, state lawmakers should require periodic audits of programs to verify curricular alignment and sufficient math coursework requirements. This would follow the footsteps of Ohio’s recent move to hold prep programs accountable for effective training in the science of reading.

Second, as we at Fordham have also recommended, Ohio should require prospective elementary teachers to pass the math section of the state licensing test in order to teach math. Currently, incoming teachers take a composite content knowledge exam that encompasses literacy, math, social studies, science, and the arts. This means that teachers could fail the math section but pass the overall exam and still be licensed to teach elementary math. Requiring a demonstration of competency before leading math classes should be non-negotiable. A requirement would also push prep programs to ratchet up their math coursework to help candidates pass the licensing exam.

Students benefit greatly when they learn from educators with strong mathematical knowledge. But too many teachers, particularly in our elementary schools, receive inadequate training. To help more children get off to a strong start in math, Ohio policymakers need to address deficiencies in elementary teacher preparation.


[1] This paper has numerous illustrations of pre-service teachers struggling to understand the decimal system.

[2] NCTQ notes that 105 hours of content instruction is equivalent to roughly two and one-third semester-long college courses. The analysis also includes a forty-five hour recommendation for math pedagogical training. Prep programs tend to meet or exceed the pedagogical minimum, but fall short on math content. NCTQ’s program ratings take into account hours versus both content and pedagogy minimums.  

view
Teacher merit pay research blog image

A closer look at the research on teacher merit pay

Jessica Poiner
6.2.2025
Ohio Gadfly Daily

A few months back, Ohio gubernatorial candidate Vivek Ramaswamy caused waves by proposing to pay teachers and school administrators based on merit. In an op-ed in the Wall Street Journal, he blamed both sides of the political aisle for the “bleak reality” of “illiterate, innumerate graduates.” He argued that because teacher quality is the number one school-related factor affecting student progress, teacher pay should be directly tied to learning outcomes rather than seniority or credentials. At a campaign rally, he asserted that “meritocracy in compensation” would help Ohio become a “magnet” for the best educators.

While Ramaswamy maintains he’s not planning to pick a fight with teachers unions, the unions are clearly ready for one. The rest of Ohio, meanwhile, is likely feeling déjà vu because the Buckeye State has started down this road before. In April 2011, Governor John Kasich signed Senate Bill 5 into law. The bill was a controversial and comprehensive overhaul of collective bargaining rights that, among its many provisions, mandated merit pay for teachers based on evaluation results. In November of that same year, after a significant effort spearheaded by labor unions, voters repealed Senate Bill 5 via a statewide referendum.

Conventional wisdom says that Senate Bill 5 failed because of its breadth—the legislation didn’t just include teachers, but also firefighters, police officers, prison guards, and healthcare professionals. If a new proposal focused only on teachers, and only on implementing merit pay without eliminating collective bargaining, would Ohioans feel differently?

It’s far too soon to know. But as this discussion plays out over the next year or so, it will be important to consider not only public opinion, but also the evidence. There is a plethora of research examining the benefits and drawbacks of teacher merit pay, particularly in regard to student outcomes. One of the most comprehensive is a 2020 meta-analysis synthesizing results from thirty-seven studies to determine how teacher merit pay affects student test scores. Among the twenty-six studies conducted in the United States, teacher participation in a merit pay program is associated with a statistically significant increase in student test scores. On average, the effect is larger in math than English language arts.

That’s good news for merit pay advocates. It’s also noteworthy for lawmakers concerned about Ohio’s lackluster performance on national exams or about state test results showing that only half of Ohio students are proficient in math. However, the authors of the meta-analysis are careful to note that the effects vary based on program design and context. If policymakers want to use teacher merit pay as a lever to improve student test scores in Ohio, they’ll need to pay very close attention to program design and implementation.

Fortunately, the meta-analysis offers several approaches for studying merit pay programs. Understanding how these programs have—or haven’t—been successful will be crucial for policymakers as they consider whether it’s time for Ohio to take another crack at teacher merit pay.

Teacher recruitment and retention

Proponents of merit pay argue that it could boost efforts to recruit and retain high-performing teachers. Given all the headlines about Ohio’s teacher shortages, that’s an appealing prospect. But is it true? As part of the meta-analysis, the authors reviewed fourteen studies in their sample that examined teacher turnover. They found six studies reporting improved teacher recruitment and retention, five showing some positive and some insignificant effects, and three identifying mostly no effects. This suggests that merit pay has the potential to decrease overall teacher turnover and increase recruitment—though it’s worth noting again that program characteristics and context matter.

Professional development

A commonly cited critique of merit pay is that it overlooks the importance of professional development (PD). Merit pay programs are designed to motivate high performance, but for some teachers, motivation might not be the issue—instead, it might be a knowledge or skill gap.

The meta-analysis finds that programs coupled with in-service PD have an effect estimate on student test scores that’s larger than the overall effect of merit pay programs. In fact, programs paired with PD produce the largest summary effect estimate among various program characteristics. This evidence, the authors write, “supports the argument that teachers may already be exerting effort but are not sure how to improve their practice.” It is important to note, however, that merit pay programs without a PD component also have a statistically significant effect. This means programs with and without PD can have a positive impact, but the effect is larger when it includes PD. The upshot? Merit pay could be more motivating for teachers if it’s coupled with effective support.

Teacher motivation

The meta-analysis finds “relatively strong” evidence that the effects of merit pay on teacher motivation are aligned with its effects on student test scores. In other words, when a merit pay program motivates teachers, it also tends to produce positive effects on student test scores. No-brainer, right? But the differing effects of various programs suggest that not all merit pay programs are motivating to teachers. This hammers home that while a merit pay program might be beneficial for students, it will only be beneficial if it succeeds in motivating teachers.

The limits of teacher evaluations

One factor that might influence teacher motivation is a distrust of evaluation frameworks. Merit pay opponents argue that it’s difficult to measure teacher contributions to student learning, and thus unfair to link student outcomes to teacher pay. If teachers view an incentive program as unfair, it’s likely that their motivation—and the corresponding positive outcomes for students—will diminish.

According to the meta-analysis, programs that use criteria based on multiple measures of teacher effectiveness are associated with an effect size that’s larger than the overall summary effect. Put another way, programs have the biggest impact when merit pay is not based solely on test scores. In fact, while examining studies that use more than one measure of teacher effectiveness, the researchers found that the summary effect is larger among those that use “more sophisticated” teacher effectiveness measures. This finding is supported by multiple studies of teacher perceptions which found that teachers struggle to trust programs based solely on student test scores or value-added measures.

Grade level

According to the meta-analysis, programs at the elementary school level have larger summary effects than those in middle school. Unfortunately, there aren’t enough high school studies for reliable estimates in those grades. But larger summary effects at the elementary level suggest that merit pay is “most effective when teacher efforts are expected to be more tightly correlated with targeted student outcomes.” In short, time and opportunity matter. In elementary schools, teachers are typically responsible for one classroom of students all day, and thus have more time to concentrate on fewer students. In middle and high school, however, the influence of teachers “must be balanced with the time students spend in other classrooms with other teachers.” For merit pay to be effective, teachers need to believe their actions will directly impact student outcomes—and that belief could be influenced by the grade level they teach. “Future merit pay programs,” the authors write, “may need to offer different incentive structures for teachers in different subject areas and grade levels.”

Teaching to the test

If merit pay is tied to student performance on tests, then it’s likely that teachers will increase the time and effort they invest in preparing students for that test. This practice, known as “teaching to the test,” can lead to unintended consequences, including narrowing the content that students are exposed to in classrooms. To determine whether pay incentives lead teachers to focus only on tested subject matter, the researchers examined effect sizes for test scores that were not included among the criteria for receiving an incentive. The summary effect for these unincentivized test scores is neither statistically significant nor substantively meaningful. This suggests that merit pay is unlikely to produce gains outside of the outcomes that are being incentivized. In other words, if teachers qualify for merit pay based on state test results, then a well-designed program could lead to improved student scores on state tests—but not necessarily other exams, like the ACT/SAT.

***

There are two headline takeaways from this comprehensive meta-analysis. The first is that introducing performance pay in Ohio schools could accomplish some of the goals that proponents like Ramaswamy are hoping to achieve. Merit pay programs are associated with a statistically significant increase in student test scores. They also have the potential to decrease teacher turnover and increase recruitment. The second takeaway is that the success of merit programs largely depends on design and context. If policymakers don’t get the details right, then it’s likely that merit pay won’t succeed in boosting student outcomes or bolstering the teacher pipeline.

But what, exactly, are those details? And how do they fit into Ohio’s current policy landscape? Stay tuned to find out.


view
Tutor gender and girls STEM interest SR image

Impacts of gender-matching between student and tutor

Jeff Murray
6.10.2025
Ohio Gadfly Daily

Long-running efforts to increase academic achievement for girls in middle- and high-school math seemed to be bearing fruit by 2019. However, pandemic educational disruption reversed this trend, with both NAEP and TIMSS test results in 2023 showing a far sharper decline in math test scores for girls than for boys. Additionally, female students remained underrepresented in upper-level STEM courses, STEM majors, and among those pursuing careers in STEM fields at both points in time. Researchers interested in continuing the pre-Covid rise for girls recently tested a two-pronged approach aimed to improve math performance: tutoring and female role modeling.

The research team focused on ninth grade students taking Algebra I in five high schools in an unnamed urban school district in New England during the 2021-22 school year. The district intended to offer tutoring fully in-person and solely during the school day via a special math intervention block. However, a lack of available local tutors ended up requiring virtual sessions at three of the schools, including after school hours. Tutoring groups ranged in size from one to three students per tutor. The analytic sample included 422 students (half of them girls) and 23 tutors (39 percent female). The researchers randomly assigned students to either same-gender or opposite-gender tutors. Seventy-six percent of students were Hispanic, 45 percent were white, and 33 percent were Black. Among the tutors, 43 percent were Black, 34 white, and about 2 percent Asian. The vast majority of students (89 percent) were low-income, 18 percent had Individualized Education Plans, and 37 percent were classified as having Limited English Proficiency. Among the data gathered for all students: math course grades, school attendance, and overall achievement data for the prior school year; tutoring attendance and two skills assessment scores at the beginning and end of the tutoring program; and an end-of-year student survey administered by the tutoring provider.

Girls paired with female tutors reported significantly higher STEM interest (0.73 standard deviations) compared to those assigned to male tutors and were 3.9 percentage points more likely to pass their Algebra I course with a C- or better. The effects appear stronger for girls working with tutors in-person as opposed to virtually, and during the school day as opposed to after school. However, there was no impact of tutor gender on end-of-program assessment scores or on students’ attendance patterns.[1] The researchers do note that ongoing Covid concerns contributed to inconsistent school and tutoring attendance, including an overall high rate of chronic absenteeism at all five buildings.

Interestingly, the researchers don’t land on any huge takeaways or suggest broad policy prescriptions based on these findings. In fact, in an interview with EdWeek, research team member Carly Robinson said that matching students and tutors based on any singular factor like gender or race could actually have “potential negative impact” on outcomes. Educator quality, experience, training, and previous success cannot be overlooked. Instead, she encourages schools to make sure that all students can see people like themselves within the ranks of strong and successful adult role models around them. “Ensuring that your tutor base or educator base is more diverse and represents the students who they’re working with,” she said, “would allow for that sort of exposure and role modeling,” especially in STEM areas. For girls, “being exposed to a female tutor who represents the pathway that they could take is impactful.”

SOURCE: Joshua Bleiberg et al., “The Impact of Tutor Gender Match on Girls’ STEM Interest, Engagement, and Performance,” retrieved from Annenberg Institute at Brown University (May 2025).


[1] While data are provided for the boys in the sample in appendices, there is no written analysis or discussion of them or comparisons made to the girls’ outcomes.

view
tuition and piggy bank

The supply side of private school choice programs

Jeff Murray
6.5.2025
Flypaper

The nationwide push to create or expand private school access over the last few years—through vouchers, tax credits, or education savings accounts (ESAs)—has ignited parental curiosity in such choices. But has the supply side of the equation kept pace with that heightened demand (and opportunity)? A new report from EdChoice—formerly the Milton and Rose D. Friedman Foundation—digs into the data.

Hard numbers on private school supply have been lacking until recently. Kudos to EdChoice researcher Susan Pendergrass for her efforts to make sense of what’s out there. Data from the National Center for Education Statistics (NCES) Private School Survey (PSS) indicate there were about 30,000 private schools in the U.S. in 2020-21, with approximately 4.4 million students attending. Overall, it seems these numbers represent a decline in total schools between 2010 and 2020 (and, by inference, student enrollment), with some states likely bucking that trend. However, further certainty is not possible as PSS data are merely voluntary survey responses from a representative sample of schools. Tuition rates for 2020-21 are reported in ranges—from less than $3,500 to more than $15,000 per year. Approximately four-fifths of private schools charged less than $15,000 in tuition annually. The overall average was about $13,000.

From there, the data become more reliable, largely as a result of burgeoning publicly-funded private-school choice programs. While not every private school chooses to participate in its state’s voucher or ESA programs, publicly-available lists of those that do are kept and updated with fidelity by state education agencies or the third-party organizations that manage disbursement of funds. Fordham’s home state of Ohio has been an exemplar for many years, but this report mainly features Arizona, whose ESA program became universally-available in the fall of 2022. Detailed information is fully available on the numbers and types of schools participating (with lots of subcategories) as well as the number of students opting for each type, dedicating their ESA funds toward tuition payments. The number of participating schools in Arizona grew from 510 in 2022 to 661 in 2023; the number of students participating grew by nearly 10,000; and the tuition support provided to families grew from $195 million to more than $268 million. Even if every other non-participating private school in the state closed shop in that year (they didn’t), the net was still a big, concrete gain—no ambiguity, statistical sampling, or data modeling required. Ditto for non-school providers—tutors, therapists, curriculum publishers—all reimbursable expenses for Arizona ESA families and all on the rise from 2022 to 2023.

EdChoice’s report does not address the question of whether voucher and ESA support are leading to increases in tuition or other private education resources, although it references other recent research that does raise concerns in that regard. If the influx of public money into private-school programs leads to tuition increases over and above the value of the voucher, the intent of such programs to widen access for families would be undermined and support for private school choice could suffer. It’s a matter of basic economics and needs watching carefully.

The available data indicate that expanded private school support programs have led to an increased supply of private education options, at least in Arizona. Other states examined in this report are less clearcut, with eligibility levels determining how big programs grow and how fast. It is not a surprise, then, that EdChoice concludes from this snapshot that private school choice programs must include the widest-possible eligibility (universal would be best), minimal regulatory friction for provider entry, and a choice of administrative vendors to increase the supply side of the equation. One would expect nothing less of the disciples of Milton Friedman. Private school choice is on the rise, hastened by COVID-era chaos and learning loss. Programs need to ensure the supply side of the equation is favorable if they are to meet the demand for classroom seats and service providers. Solid data is the keystone to making sure that happens.  

SOURCE: Susan Pendergrass, “The Supply Side of ESAs: How Universal School Choice Programs Have Affected the Number of Private Schools and Home Education Vendors,” EdChoice (May 2025).

view
Chad Aldis Testimony on House Bill 96 6-5-25 image

Interested party testimony provided on House Bill 96—6/5/25

Chad L. Aldis
6.5.2025
Ohio Gadfly Daily

Note: Today, the Ohio Senate Finance Committee heard testimony on its version of House Bill 96, the state’s biennial operating budget. Fordham’s Vice President for Ohio Policy provided interested party testimony on the bill. These are his written remarks.

Let me begin by thanking the Senate for the thoughtful and substantive improvements made to the education portions of the House-passed budget. The Senate’s version reflects a strong commitment to student-centered funding, transparency, and research-driven reform. Among the many positive steps:

  • School Funding: Fully phasing in the Cupp-Patterson formula and beginning the shift to direct certification for DPIA is a major step toward a fairer, more accurate funding system.

  • Charter Schools: Restoring the governor’s proposals on unused facilities and preserving rigorous eligibility standards for high-quality charter funding are important wins.

  • Private School Choice: Removing the proposed Education Savings Account (ESA) for non-chartered, non-tax supported schools reflects prudent fiscal and policy judgment.

  • Literacy and Numeracy: Restoring universal reading and math screeners for grades K–3, ensuring transparency around math curriculum materials, and directing DEW to identify high-quality math curricula are smart, research-aligned decisions.

  • Educator Data: Enhancing teacher vacancy data collection—including for charter schools—is a key step toward understanding and addressing workforce challenges.

  • Career Pathways: Restoring career goal planning, reforming the credential framework, and keeping high graduation standards all underscore your commitment to readiness and rigor.

These provisions demonstrate a serious effort to align Ohio’s education policies with what’s best for students, and we are grateful for your leadership.

As you finalize the omnibus amendment, we urge attention to the following priorities:

  1. Accelerate the DPIA Transition and Strengthen Support: Accelerate the shift to direct certification by using a 50/50 blend in FY26 and moving to full implementation in FY27. Critically, raise the base amount—currently $422—or risk reducing support to the schools serving Ohio’s most disadvantaged students.

  2. Phase Out Guarantees: Adopt the governor’s original phase-down of guarantee bases (95 percent in FY26, 90 percent in FY27) to promote both fairness and fiscal responsibility.

  3. Remove Performance-Based Funding for Districts: We have long advocated for this type of policy, but as written, the provision sets too low a bar and applies retroactively. With more than 400 districts qualifying, it risks becoming a giveaway.  We recommend removing or—if time permits—improving this section. We would love to work with you on getting the language right.

  4. Charter School Equity: Please restore the $1,500 facilities allowance, the $650 equity supplement, and the ability for DEW to go to the Controlling Board if the high-quality charter school fund is oversubscribed.

  5. Additional Improvements in Math Policy: The budget does not currently include language from Substitute SB 19 to require automatic placement of high-achieving students in Algebra I, establish early pathways for advanced learners, and set math content standards for new elementary teachers. Too many students are falling short of their potential in this essential subject, and we encourage you to add these smart provisions to HB 96.

  6. Career Pathways Improvements: Include a structured career planning course and give DEW the authority to set minimum standards for graduation plans. Also, restore the governor’s career exploration funding to ensure schools can effectively prepare students for life after graduation.

*****

In closing, the Senate has taken important steps to elevate academic expectations, prioritize resources where they are most needed, and improve transparency and accountability across the system. With a few final improvements, this budget can deliver even more for Ohio’s students.

Fordham Logo

© 2026 The Thomas B. Fordham Institute
Privacy Policy
Usage Agreement

National

P.O. Box 110
Burke, VA 22009

202.223.5452

[email protected]

Ohio

P.O. Box 82291
Columbus, OH 43202

614.223.1580

[email protected]

Sponsorship

130 West Second Street, Suite 410
Dayton, Ohio 45402

937.227.3368

[email protected]