Mobile Navigation

  • National
    • Policy
      • High Expectations
      • Quality Choices
      • Personalized Pathways
    • Research
    • Commentary
      • Gadfly Newsletter
      • Flypaper Blog
    • Events
    • Scholars Program
  • Ohio
    • Policy
      • Priorities
      • Media & Testimony
    • Research
    • Commentary
      • Ohio Education Gadfly Biweekly
      • Ohio Gadfly Daily
  • Charter Authorizing
    • Application
    • Sponsored Schools
    • Resources
  • About
    • Mission
    • Board
    • Staff
    • Career
Home
Home
Advancing Educational Excellence

Main Navigation

  • National
  • Ohio
  • Charter Authorizing
  • About

Ohio Menu

  • Topics
    • Accountability & Testing
    • Advanced Education
    • Career & Technical Education
    • Charter Schools
    • Curriculum & Instruction
    • ESSA
    • Evidence-Based Learning
    • Governance
    • Personalized Learning
    • Private School Choice
    • School Finance
    • Standards
    • Teachers & School Leaders
  • Research
  • Policy
  • Commentary
    • Ohio Gadfly Newsletter
    • Ohio Gadfly Blog
    • Events

The Education Gadfly Weekly

Sign Up to Receive Fordham Updates

We'll send you quality research, commentary, analysis, and news on the education issues you care about.
Thank you for signing up!
Please check your email to confirm the subscription.

Ohio Gadfly Biweekly—Three things to know about the new EdChoice school list

Volume 13, Number 25
11.15.2019
11.15.2019

Ohio Gadfly Biweekly—Three things to know about the new EdChoice school list

Volume 13, Number 25
view
Ohio EdChoice list
School Choice

Three things to know about Ohio’s new EdChoice school list

Since 2005, Ohio’s Educational Choice Scholarship Program, or EdChoice, has allowed tens of thousands of students to attend private schools via a state-funded scholarship in the form of a voucher.

Jessica Poiner 11.15.2019
OhioOhio Gadfly Daily

Three things to know about Ohio’s new EdChoice school list

Jessica Poiner
11.15.2019
Ohio Gadfly Daily

How can Ohio improve funding for low-income students?

Aaron Churchill
11.18.2019
Ohio Gadfly Daily

Why aren't we talking about teacher licensure in Ohio?

Jessica Poiner
11.11.2019
Ohio Gadfly Daily

A closer look at Ohio’s independent STEM schools

Jessica Poiner
11.5.2019
Ohio Gadfly Daily

Quantifying the private school advantage

Jeff Murray
11.18.2019
Ohio Gadfly Daily

Testimony given before the Ohio Report Card Study Committee – 11/13/19

Chad L. Aldis
11.13.2019
Ohio Gadfly Daily
view
School funding in Ohio, part 7

How can Ohio improve funding for low-income students?

Aaron Churchill 11.18.2019
Ohio Gadfly Daily
view
Teacher licensure in Ohio

Why aren't we talking about teacher licensure in Ohio?

Jessica Poiner 11.11.2019
Ohio Gadfly Daily
view
Independent STEM schools

A closer look at Ohio’s independent STEM schools

Jessica Poiner 11.5.2019
Ohio Gadfly Daily
view
Private school advantage

Quantifying the private school advantage

Jeff Murray 11.18.2019
Ohio Gadfly Daily
view
Chad report card testimony

Testimony given before the Ohio Report Card Study Committee – 11/13/19

Chad L. Aldis 11.13.2019
Ohio Gadfly Daily
view
Ohio EdChoice list

Three things to know about Ohio’s new EdChoice school list

Jessica Poiner
11.15.2019
Ohio Gadfly Daily

Since 2005, Ohio’s Educational Choice Scholarship Program, or EdChoice, has allowed tens of thousands of students to attend private schools via a state-funded scholarship in the form of a voucher. From the program’s inception, students could qualify for a scholarship because they were assigned to attend a low-performing school. Ohio also launched an income-based voucher in 2013, and has added a new grade level of eligibility each year. By 2020, low-income students in grades K–7—regardless of their assigned school—would have been eligible for a voucher.

Every year, the Ohio Department Education releases a list of which public schools are designated as EdChoice (i.e., low performing) schools. The criteria for how a school is placed on the list are outlined by state law and require the use of three years of school report grades. These criteria are supposed to be cut and dry, but over the last few years, things have gotten more complicated. That’s because, back in 2016, state lawmakers introduced a safe harbor policy intended to protect students, teachers, and schools from accountability sanctions during Ohio’s transition to new and more rigorous state assessments.

State report cards for the 2018–19 school year were released this fall, and a new list of EdChoice-designated schools was published not long after. Because of the safe harbor policy, the schools were identified based on data from the 2013–14, 2017–18, and 2018–19 school years.

Compared to last year’s list, the new list is…well, huge. In 2018, there were around 500 EdChoice-designated schools. Now over 1,200 of the state’s 3,186 traditional public schools are designated. In one year, the list has more than doubled in size. But its length isn’t the only thing that’s generating attention. It’s also who’s on it. For years, EdChoice largely identified schools in higher-poverty communities. But for the first time, some suburban districts have schools on the list too. This is largely because of modifications in state law as to what constitutes a struggling school. Recent changes have gone from looking primarily at a school’s overall grade to other important data points like student growth and the school’s ability to help struggling readers.   

Unsurprisingly, there’s already pushback coming from these areas. There are concerns about a mass exodus of voucher-wielding students headed for private schools, and a resultant drain on funding. There are arguments that schools don’t deserve to be on the list because the report card measures that put them there are faulty. And, of course, there are anti-choice folks gearing up to argue that the list is just another example of how the state uses accountability policies to “punish” traditional districts.

But amidst all this controversy, there are a few important things to remember.

First, it’s highly unlikely that the EdChoice designated school list is going to lead to a mass exodus of public school students. Just because students are eligible for a voucher doesn’t mean they’re going to actually use one. Parents aren’t going to pull their students out of schools that they feel are serving them well. For example, an elementary school in Shaker Heights found itself on the list last year for the first time but only lost a total of five students. In places like Solon, Shaker Heights, and Upper Arlington, where housing prices are high, the likelihood of a significant number of families suddenly opting for private schools is slim. Many of these residents pay high mortgages and property taxes because they want to send their children to the local public schools.

Second, we shouldn’t be rushing to change report cards just because of a larger-than-normal EdChoice designation list. Such a move would be a great example of the tail wagging the dog. Does Ohio’s accountability system need some adjustments? Certainly. Here at Fordham, we’ve made several common sense recommendations. But it would be irresponsible of state lawmakers to make drastic changes purely because a few districts are unhappy that their poor grades gave students more school options.

Finally, it’s important to realize that as long as educational opportunities are afforded based on academic performance measures, there will continue to be tension and pushback. The best path forward isn’t to ignore this controversy, but to resolve it by empowering more families who can’t afford to enroll their children in their school of choice the opportunity to do so based on their incomes instead of their schools’ report cards.

At Fordham, we’ve been arguing for income-based eligibility for a while. Income-based vouchers are vital because they help the students most in need of options. Low- and middle-income families are seldom able to just pick up and move to a new district. Charter schools also aren’t an option for many families because state laws limit where charters can open. That leaves private schools as the only alternative, but paying tuition without assistance would be a serious financial burden. So families often end up stuck, not just in poorly performing schools, but in schools that, regardless of their overall academics, don’t meet their student’s needs.

The good news is that, thanks to the recently passed state budget, more children will soon be eligible for EdChoice scholarships. Starting in 2020–21, for example, the program will be expanded to include low-income students in all grades. And the state is adding a new, year-round application window, as well as an automatic increase in the number of available scholarships if the number of applications exceeds 90 percent of the current cap.

But the work isn’t finished yet. If lawmakers want to escape the annual debate about what schools should be on the EdChoice-eligibility list, they should seriously contemplate how they can open the door of educational choice to more families. Rather than limiting families to a school that meets the state’s frequently changing definition of underperforming, we should commit to making it easier for parents to find a school that helps their child thrive.

view
School funding in Ohio, part 7

How can Ohio improve funding for low-income students?

Aaron Churchill
11.18.2019
Ohio Gadfly Daily

Note: This is the seventh in a series of blog posts on school funding in Ohio; for the previous posts, see here, here, here, here, here, and here.

How to fund low-income students is one of the big questions in Ohio’s ongoing school funding debate. While the plan put forward by Representatives Bob Cupp, John Patterson, and a group of district officials would spread more than a billion additional dollars in state aid across Ohio schools, concerns have been raised that it doesn’t steer nearly enough money to the state’s neediest schools.

For instance, a highly detailed analysis by Howard Fleeter indicates that high-poverty “Big Eight” urban districts would see an average increase of $1,115 per pupil under a fully implemented plan, poor rural districts would gain $1,158 per pupil, and wealthy suburban districts would see a bump of $906 per pupil. Not satisfied by this modest advantage for poorer districts, the Akron Beacon Journal editorial board urged the state “to do better.”

Though not featured in Fleeter’s analysis, Ohio’s brick-and-mortar charter schools, despite serving predominantly low-income students and already shortchanged in the overall funding system, would fare dismally under the plan. The Big Eight charters would see an increase of just $758 per pupil—even less than wealthy suburban districts. Worse yet, charter amounts would be frozen after a couple years, while districts would continue to gain funds after full implementation because the plan calls for adjustments based on inflation. Meanwhile, private-school scholarships, which also serve mainly disadvantaged students, would not rise at all—a $0 increase. 

There are a number of plausible reasons why the Cupp-Patterson plan doesn’t concentrate dollars on poorer schools.

  • With the exception of school choice funding, Ohio’s overall system is already pretty fair to high-poverty schools. Perhaps it’s harder to justify sending more state funds to them.

  • The Cupp-Patterson plan seeks to eliminate “caps,” which suppress funding increases for some wealthy (but growing) school districts. While removing caps is a worthwhile endeavor, doing so likely soaks up a significant portion of the funding hike sought under the proposal.

  • Its icy approach to choice programs might reflect the interests of the district officials who served as plan developers. 

  • As Representative Patterson noted earlier this year, he and his colleagues have “been unable to fully define what ‘economically disadvantaged’ is.”

Given the questions around the way in which the plan funds low-income students, it’s worth reviewing how Ohio currently provides extra resources to schools that serve needier students. We’ll also consider some options that legislators could pursue to strengthen the state’s approach to funding low-income students. (Wonk warning: This piece gets into the weeds on some issues, but the details are important as legislators weigh alternatives.)

Option 1: Funnel more dollars through the Opportunity Grant

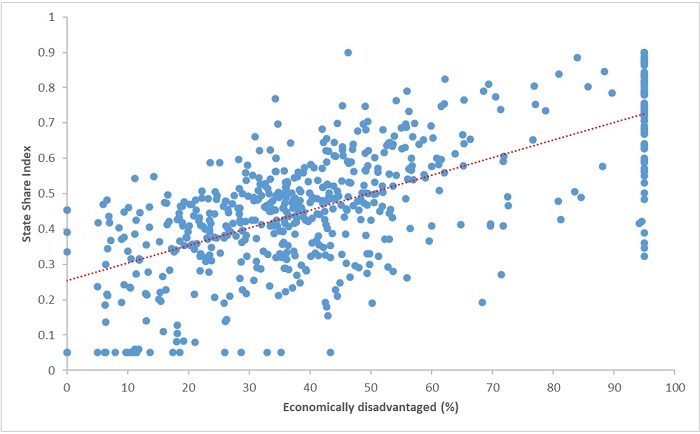
Through its current funding formula, Ohio already delivers more state aid to its poorest school districts. The core of this system is the Opportunity Grant, which in FY 2018 drove 58 percent of state foundation aid to districts. The allocation of these funds is based on the “state share index” (SSI), which takes into account a district’s property wealth, and in about half of all districts, resident income too. The SSI, whose values range from 0.05 to 0.90, is multiplied by the “base amount” for the Opportunity Grant—currently $6,020 per pupil—so that poorer districts receive larger allocations, while wealthier districts receive less because they can raise more revenue locally.[1] As Figure 1 indicates, the SSI generally correlates with districts’ ED rates, meaning that the Opportunity Grant will tend to allocate more state funds to districts with the most disadvantaged pupils.

Figure 1: Relationship between economically disadvantaged students and state share index, Ohio school districts, FY 2019

Funding low income students figure 1​

Source: Ohio Department of Education

Thus, one way Ohio could direct additional state dollars to districts with more low-income students is to simply funnel more dollars through the Opportunity Grant. For instance, if Ohio raised the base amount to $6,500 per pupil, a high-poverty district such as Dayton, which has an SSI of 0.88, would see an increase of $422 per pupil. Conversely, wealthy districts would see smaller increases: A district with an SSI of 0.15, for example, would see a bump of just $72.[2] In addition, increasing the base amount and adding a multiplier to it would also better support public charter schools, which receive the full base amount because they have no local taxing authority. Nevertheless, as Figure 1 indicates, the correlation between districts’ SSI and ED rates is not one-to-one—nor is that result likely because the SSI isn’t based on ED data. So while this remains a viable option, some of the funds would be misdirected if the goal is to effectively steer extra resources to low-income students.

Option 2: Enhance the ED component with funding based on direct-certification counts

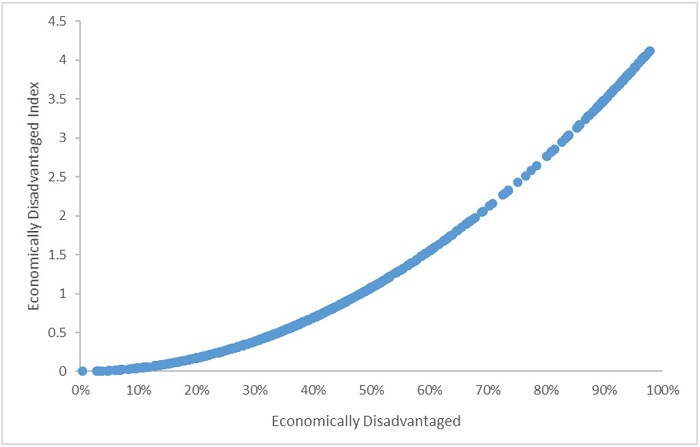
To provide extra resources in a direct manner to districts serving a high proportion of low-income students, Ohio includes a funding component based on ED rates. This funding stream, often considered part of the state’s categorical “add-ons,” is far smaller than the Opportunity Grant—making up just 5 percent of the overall foundation program. This component doesn’t rely on the SSI. Rather, it’s based on the ED index, whose values range from 0 to 4.1, and is designed to deliver more aid to districts with more concentrated student poverty.

Figure 2 displays the clear, albeit mechanical, relationship between districts’ ED rates and index values (the curve is due to a square term in the index). The ED index is then multiplied by a base amount of $272 per pupil, resulting in more dollars flowing to higher-poverty districts. For instance, a district with an ED index of 3.5 would receive $952 per pupil in extra support through this funding stream. Public charter schools are eligible to receive these funds, too, and their amounts are based on the ED indexes of students’ home district.

Figure 2: Relationship between economically disadvantaged students and ED index, Ohio school districts, FY 2019

Funding low income students figure 2​

Source: Ohio Department of Education. Note: The figure displays each district’s percentage of ED students, including both district and charter students who reside in the district (the index is based on students attending both types of schools).

At first blush, the ED component appears to be a natural lever to deliver more aid to districts serving low-income students. But here’s the rub: As discussed in an earlier piece—and probably alluded to in Representative Patterson’s comment—a growing number of Ohio students are being misclassified as “economically disadvantaged” due to their districts’ or schools’ participation in a federal subsidized meals program known as Community Eligibility Provision (CEP). Under this program, students are universally eligible for free and reduced-priced lunch (FRPL)—the basis for ED identification—and thus CEP leads some more affluent students to be incorrectly deemed ED. In my estimation, approximately 65,000 students are misidentified, about the size of the Cleveland and Toledo school districts combined.

In what developers have called a “placeholder” amount (until a proposed study on ED identification and costs is finished), the Cupp-Patterson plan would increase the ED base amount from $272 to $422 per pupil. That’s probably OK for now. But given the challenges of ED identification in light of CEP, what’s likely needed is an alternative mechanism to deliver funds in a more accurate way. Basing funding on direct certification (DC), a direction that a few other states have gone, is a promising option. Using administrative records, DC identifies low-income students based on their households’ participation in means-tested programs such as TANF, SNAP, or Medicaid, along with students flagged as in foster care, migrant, or homeless.

This method has the advantage of not misclassifying higher-income students who attend CEP schools. And because the income thresholds are lower to participate in these means-tested programs—at or below 133 percent of the federal poverty line versus FRPL’s eligibility cutoff of 185 percent—DC captures students who likely face the greatest educational challenges. However, DC may undercount some low-income students whose families decline to participate in means-tested programs, and it would require some cross-agency heavy lifting to properly link records. 

Care would also need to be taken to incorporate a new measure of student poverty into the existing system. Because the income thresholds differ under ED and DC methods, some districts and charters may lose funding if Ohio suddenly replaced one method for the other. A range of implementation options exist, but perhaps the most straightforward (though requiring additional funds) would be to create a two-tiered structure that stacks DC-based funding on top of the existing ED dollars. The table illustrates what that could look like.

Funding low income students table​

This approach would have the following advantages:

  • Drive more resources to districts and charters that educate students from Ohio’s lowest-income families.

  • Continue to provide extra aid for students in households between 133 and 185 percent of the federal poverty line. 

  • Avoid a potential “hold harmless” provision, since funds are being added to the component.

  • Deliver some extra funding under the ED tier for low-income students whose families don’t participate in TANF, SNAP, or Medicaid.

  • Enable CEP districts to allocate funds to their neediest schools based on DC counts. (They currently report 100 percent ED across all schools.) The state could even require these funds to automatically flow to the schools in which DC students attend.

Option 3: Use the new Student Wellness and Success funding stream

In a new dimension of school funding starting this year, Ohio now provides $276 million in extra funds to districts and charters that aim to support students’ non-academic needs. These dollars must be spent in specific ways, and schools have to engage community partners as well. Perhaps seeking to avoid the problems of defining student poverty via ED status, the allocation of these funds is based on U.S. Census Bureau estimates of districts’ percentage of children whose family incomes are at or below 185 percent of the federal poverty line (charter funds are again based on students’ home district data). Much like the Opportunity Grant and ED funding, districts with higher poverty rates receive larger per-student subsidies than wealthier districts. The exact calculation is somewhat complicated, but it generally allocates between $20 and $250 per pupil depending on the childhood poverty rate of the district.[3]

Although census data have many useful applications, they have some drawbacks when used in a school funding context. First, it’s not based on the actual enrollment of students attending public schools—it’s all children ages zero to eighteen. Thus, it would reflect children under the kindergarten age, along with homeschooled and non-public-school students. Second, the data are collected via survey samples, resulting in estimates of poverty that in some cases differ quite substantially from ED counts. While districts’ census and ED data generally correlate, the rates diverge by more than 10 percentage points among a fairly large number of Ohio districts.[4] In most cases, the ED rates are probably more reliable measures of districts’ student demographics, since they are based on actual headcounts. Third, because the census doesn’t produce data at an individual school level, it can’t help us gauge poverty across schools. Thus, it’s hard to imagine a system that effectively drives dollars to high-poverty schools based on census data.

Though basing funding on census data is a reasonable short-term solution, it’s something only two states currently do and is likely not ideal over the long haul. The Student Wellness funds have praiseworthy aims, but legislators should tread carefully when it comes to using this funding stream to deliver extra aid to Ohio’s poorest schools.

* * *

The Cupp-Patterson plan gets a few things straightened out in Ohio’s funding system. But as some critics have suggested, it doesn’t have an especially strong focus on driving extra state resources to the neediest students, whether they attend district or charter schools or use a scholarship to attend a private school. If state legislators seek to make funding low-income students an even greater priority, they have options within the existing framework. It doesn’t take a complete overhaul of the system to make it happen.   


[1] To receive state aid, districts must levy an effective property tax rate of at least 20 mills (or 2 percent). In districts with higher property values, this rate will generate more funding.

[2] The Cupp-Patterson plan would eliminate the SSI and instead allocate the “core foundation funding” (the analog to the Opportunity Grant) based on an entirely new model. Briefly, it would first calculate a base amount, determined by a calculation of “input” costs, which varies by district, and then multiply a district’s property wealth and income data by a value ranging from 2.0 to 2.5 percent. This would yield a “local capacity amount” that is then subtracted from the base amount to generate the core foundation funding of the district. This method would likely continue to allocate funds in a “progressive” manner, but it’s not clear how it compares to the SSI in terms of allocating dollars to districts with higher student poverty.

[3] These amounts will increase in FY 2021 to a range between $30 and $360 as the appropriation for the program rises to $398 million next year.

[4] Among the 539 districts that did not report 100 percent ED in FY 2019, 168 had an ED rate that differed by more than 10 percentage points from their census-reported poverty rate.

view
Teacher licensure in Ohio

Why aren't we talking about teacher licensure in Ohio?

Jessica Poiner
11.11.2019
Ohio Gadfly Daily

A decade ago, teachers were the most talked about aspect of education policy and practice. Several research studies indicated that while teacher quality wasn't the only factor affecting student achievement, it was the most significant one under the control of schools. President Obama and his administration repeatedly talked about the importance of high quality teachers. And Obama’s signature grant program, Race to the Top, included selection criteria focused on teacher effectiveness and high quality pathways for aspiring educators. Due in large part to the significant funding available through Race to the Top, states across the nation passed laws and implemented programs aimed at improving training, evaluating performance, and holding educators accountable for student learning.

Read the education section of most media outlets these days, though, and you’ll find considerably less attention devoted to teacher issues. In a recent blog post, Kate Walsh—president of the National Council on Teacher Quality—noted that press coverage of teacher quality and evaluation has decreased considerably in the past five years. Not only that, but many of the states that rushed to put teacher-specific policies in place have now altered or eliminated those policies entirely.

Ohio has not been immune to these changes. In the summer of 2018, lawmakers passed Senate Bill 216, which focused on education deregulation. Among its many provisions, the legislation made some significant changes to two areas of teacher policy: licensure and evaluation. In a future piece, I’ll take a look at the changes to evaluation currently being piloted by the Ohio Department of Education (ODE). But for now, let’s focus on licensure.

To understand the impact of SB 216 on Ohio’s licensure system, a little background is needed. Federal law has required states to ensure that all public school teachers are “highly qualified” since the days of No Child Left Behind (NCLB) in the early 2000s. Being highly qualified meant having a bachelor’s degree, full state certification, and subject-area mastery, which was often determined via a content test. But when ESSA replaced NCLB in 2015, the highly qualified label went away, too. Instead, states were permitted to set their own definition for what constituted a qualified teacher.

This transfer of power back to the states is where Ohio’s SB 216 came into play—it required public school teachers to be “properly certified or licensed,” which meant they had to possess one of the state’s approved licenses. For most of the state’s traditional public school districts, this wasn’t much of a change. The vast majority of their teachers already had an acceptable Ohio license because most of them graduated from one of the state’s many preparation programs.

But when ODE announced that teachers working under long-term substitute licenses would not be considered properly certified by the state, things got sticky for charter schools. Charters often employ nontraditional teachers who have not attended a conventional training program. Because these educators enter the classroom via alternative routes, they usually work under substitute licenses until they meet state requirements for traditional or alternative licensure. Charters also use substitute licenses to place teachers into hard-to-fill grade levels or subject areas.

Substitute licenses were permitted under previous state law and were used extensively under NCLB’s highly qualified framework. But the department’s announcement meant that a good number of the state’s charter school teachers would no longer be properly certified. Even worse, SB 216 limited the length of time that someone could teach under a substitute license if they didn’t have a degree in education or a degree in the subject area in which they were teaching. So, not only were these teachers improperly certified, they were also now subject to a time limit on the license they did have.

It was possible for charters to work around the time limit placed on substitute licenses. The new law permits a district superintendent to request that the local school board approve “one or more additional subsequent semester-long periods of teaching.” Although charters have a different governance structure than traditional public schools, it stands to reason that charter leaders could also request extensions from their boards. But the changes requiring teachers to be properly certified or licensed couldn’t be worked around, and would have left dozens of schools without vital staff members who had previously been considered qualified.

Fortunately, lawmakers smartly came to the rescue in the most recent state budget. The final version eliminated the requirement for teachers in charter schools to be “properly certified and licensed.” To be clear, charter school teachers still have to be licensed. They just don’t have to be “properly certified” in specific subject areas or grade levels. With the additional flexibility of substitute licenses still in place—albeit more complicated than before—charters retained the freedom to hire qualified teachers who took non-traditional pathways to get into the classroom.

The upshot is this: Despite the serious impact these provisions would have had on dozens of schools and teachers and hundreds of students, they were barely reported on. What Kate Walsh pointed out as a nationwide trend also proved true in the Buckeye State—teacher provisions were ignored and lost in the shuffle of more controversial topics such as academic distress commissions and graduation requirements.

In short, teacher policy isn’t a big headline grabber anymore. Nowadays, most of these policies are only discussed at the local level. That’s not necessarily a bad thing, as local control is important. But the impacts and implications of teacher training, effectiveness, and accountability haven’t changed—and they’re definitely worth more attention than they’re getting.

view
Independent STEM schools

A closer look at Ohio’s independent STEM schools

Jessica Poiner
11.5.2019
Ohio Gadfly Daily

In response to technological innovations and a rapidly changing economy, schools across the nation have increasingly focused on offering curricula and programs centered around the principles of STEM—science, technology, engineering, and mathematics.

While other educational fads have faded, STEM has endured. In December 2018, the federal government released a report on its five-year strategy for increasing access to high quality STEM education. The ACT publishes reports on the condition of STEM nationally and in each state, and it highlighted STEM results in its 2018 report on the condition of college and career readiness. There are no shortage of blog posts and articles about why STEM education is so important.

Ohio is no exception. The Buckeye State has a unique relationship with STEM thanks to state law and a partnership between the Ohio Department of Education (ODE), the Ohio STEM Learning Network, and the Ohio STEM committee. There are nearly seventy schools that have applied for and received Ohio’s STEM and STEAM (which adds an A for arts education) designation. They include traditional district, charter, and private schools that teach a STE(A)M curriculum, focus on “real-world, project-based experiences,” and have well-established partnerships with businesses, nonprofits, and institutions of higher education.

Chances are that most Ohioans are familiar with at least one STEM-designated school; LeBron’s I Promise School in Akron is one. But what most people don’t know is that Ohio is also home to several independent STEM schools—public schools that are not governed or operated by a traditional district and differ from charter schools because of their governing body, academic offerings, or mission. These schools are completely and entirely focused on integrating STEM education into every subject and content area. STEM isn’t just part of who they are, it is who they are.

On its most recent list of STEM designated schools, ODE identifies seven independent STEM schools:

School name

City

County

Grades

Enrollment

Bio-Med Science Academy


Rootstown

Portage

7–12

607

Dayton Regional STEM School


Dayton

Montgomery

9–12

652

Global Impact STEM Academy


Springfield

Clark

7–12

640

iSTEM Geauga Early College High School


Concord Township

Lake

9–12

178

Metro Early College High School


Columbus

Franklin

6–12

926

Tri-State STEM-M Collaboration


South Point

Lawrence

9–12

66

Valley STEM-ME2 Academy


Youngstown

Mahoning

9–12

201


As indicated in the chart above, all of these schools serve middle and high school students. They are geographically diverse; four out of the five regions in Ohio contain at least one independent STEM school. Metro is the largest school, with an enrollment of 926, and Tri-State is the smallest with only sixty-six students. According to the most recently released state report cards, the demographics of each school are pretty similar. They all have a majority white student population with the exception of Metro, where just over 59 percent of its student body is non-white. Only three schools reported an economically disadvantaged population larger than 25 percent: Global Impact (26.3 percent), Metro (34.9 percent), and Valley STEM-ME2 (57.1 percent).

When it comes to student performance, the schools produce varied results. Here’s a look at how each school performed on the major components of the recent state report card.

School

Overall grade

Achievement

Progress

Gap Closing

Prepared for Success

Bio-Med Science Academy

B

C

F

A

A

Dayton Regional STEM School

B

B

D

A

B

Global Impact STEM Academy

D

D

D

D

D

iSTEM Geauga Early College High School

A

B

A

A

Not Rated*

Metro Early College High School

B

C

B

A

C

Tri-State STEM-M Collaborative

D

C

F

F

Not Rated*

Valley STEM+ME2 Academy

D

D

D

F

Not Rated*

*Schools were not assigned a Prepared for Success rating if they did not have enough students in the graduating class of 2018 to evaluate.

As you can see, the data are pretty evenly split between high and low performance. Four schools earned an overall grade of A or B, while three schools received an overall D. Two of the schools that earned overall Ds opened relatively recently—Tri-State STEM-M opened in 2017, and Valley STEM+ME2 Academy opened in 2016—which may explain why their overall grades are lower than that of their more veteran peers, who have had longer to implement the wholesale changes called for in being entirely STEM focused.  

None of the schools earned an A on the achievement component, though the majority earned at least a C. It’s worth noting that, as alternatives to traditional district schools, independent STEM schools attract students who are dissatisfied with their zoned school or have been poorly served, and may have fallen behind their peers as a result. Consequently, results on the progress component—which tracks whether all students, including those below grade level, make growth during the year—become even more important. Unfortunately, the progress results are a bit gloomy: iSTEM earned an A, and Metro earned a B, but the remaining schools earned either a D or an F. These low grades indicate that students aren’t learning as much as expected. Most schools fared much better on Gap Closing, though, which shows how well schools meet performance expectations for vulnerable populations of students. The results for schools that were rated in Prepared for Success are also largely positive.

Overall, it appears that Ohio’s independent STEM schools are a microcosm of the state’s larger education sector: Some schools are knocking it out of the park, while others have a bit more work to do before they can be labeled high performing. Like other schools of choice, STEM schools are increasingly in demand. As they expand—and perhaps as additional schools open—the independent STEM model will become more widely known. In the meantime, one thing’s for sure: These schools are a vital part of Ohio’s bevy of school choice options. 

view
Private school advantage

Quantifying the private school advantage

Jeff Murray
11.18.2019
Ohio Gadfly Daily

In the United States, there are more than 34,500 private schools. Tuition-charging high schools run the gamut from small religious institutions that serve dual academic and social purposes, to larger schools centered around a certain pedagogy, to elite academies that draw highly-motivated students from far and wide. The landscape is different in the United Kingdom, where they’re smaller, more academically focused, and concentrated on the more elite end of the scale. A new study in the Oxford Review of Education examines private schools in England to see whether, and how, such schools might confer an academic advantage on their pupils over those in what the study’s authors term “state schools” (what we would call “public schools” in America).

The University College London research team used an existing longitudinal data set called Next Steps, which followed a representative cohort of English children born in 1989 and 1990. Data were collected annually between 2004 and 2010, with a follow up in 2015. The private school study included data such as social class, parental education level, income, housing status, ethnicity, gender, and test scores. Additionally, since state schools in England base attendance largely on catchment areas, geographic locations of private school students were also collected for comparison.

The research team focused on those students attending private versus state schools during their upper secondary studies—roughly speaking, equivalent to the last two years of American high school—in which students with college plans must participate. The team identified 5,852 students in the sample who met the criteria of actively working toward college admission and whose test scores were available. 14.6 percent of these students were in private school, mirroring the national average of 15 percent private school attendance. Their research questions: Are privately educated students in upper secondary schools likely to take more courses which will facilitate college admission? Do private school students perform better in those courses than those in state schools? And do private schools confer any other advantage on their pupils for getting into an elite university, or indeed into any university?

The results: The number of college prep courses taken is higher for students in private schools, but only slightly. And that boost disappears when student demographics are similar between private and state school students. Performance on end-of-course exams follows a similar pattern. The more similar students are demographically, the more similarly they score on exams, regardless of school type attended. However, previous research has identified a hierarchy of courses within the college prep framework—and end-of-course test scores—that are more likely to facilitate students being accepted into a university. This new report indicates that students in state schools are far more likely to take courses lower on that hierarchy than are their private school peers—courses which have the weakest correlation with facilitating university acceptance. This then results in an overall boost for private school students in attending a university, especially increasing attendance at elite universities.

The details matter here. Saying that private schools confer an academic advantage on their students is true in a very general sense, and the report reinforces that high-level view. But data show that this “advantage” weakens or even disappears the more demographically similar two students are, indicating that much more is at work than just school environment. And the finding that state schools serve up far more courses that fill time and do not lead to university acceptance is highly alarming. A 2018 study by the Center for American Progress reached a similar conclusion here in the United States: The number, type, sequence, and rigor of high school courses all matter mightily in making a diploma equal a ticket to college. Any school, public or private, that can hold the line on rigorous and relevant coursework for its students will confer the “advantage” that matters most: college readiness.

SOURCE: Morag Henderson, et. al., “Private schooling, subject choice, upper secondary attainment and progression to university,” Oxford Review of Education (November, 2019).

view
Chad report card testimony

Testimony given before the Ohio Report Card Study Committee – 11/13/19

Chad L. Aldis
11.13.2019
Ohio Gadfly Daily

NOTE: Today the Ohio Report Card Study Committee heard testimony from a number of stakeholder groups on various aspects of the state’s school and district report cards. Fordham vice president Chad Aldis was invited to provide testimony. This is the written version his remarks.

Introduction

Thank you Chair Blessing, Chair Jones, and workgroup members for inviting me to offer testimony on Ohio’s state report card. My name is Chad Aldis, and I am the Vice President for Ohio Policy and Advocacy at the Thomas B. Fordham Institute. The Fordham Institute is an education-focused nonprofit that conducts research, analysis, and policy advocacy with offices in Columbus, Dayton, and Washington, D.C.

For two decades, Ohio has published annual report cards that provide families and citizens, educators and policymakers with information about school quality. Just like an annual medical checkup, these report cards are routine checks on the academic health of schools, letting us know when students are meeting learning goals, while also raising red flags when children are falling behind.

The main purpose of the state report card is straightforward: To offer an honest appraisal of school quality. For families, the report cards offer objective information as they search for schools that can help their children grow academically. For citizens, they remain an important check on whether their schools are thriving and contributing to the well-being of their community. For governing authorities, such as school boards and charter sponsors, the report card shines a light on the strengths and weaknesses of the schools they are responsible for overseeing. It can also help officials identify schools in need of extra help. 

Key Principles

Yet creating a report card that meets the needs of so many stakeholders is no walk in the park. That’s why we’re here today. Before diving into the particulars, it’s important to step back and consider four key principles that we at Fordham believe are crucial to the report card design.

  • Transparent: Report cards should offer user-friendly information that can be understood by all of Ohio’s families and citizens, most of whom work outside of education.

  • Fair: The report card should be fair to students by encouraging schools to pay attention to the needs of all students. It should also be fair to schools and designed in a way that allows schools serving students of all backgrounds to stand out.

  • Rigorous: Report card measures should challenge schools to improve student outcomes.

  • Consistent: The report card should remain largely consistent from year-to-year, helping to build public confidence and enabling stakeholders to track progress.

Strengths of Ohio’s Current Report Card

With these principles in mind, it’s important to recognize the strengths of Ohio’s current framework, which has earned praise from national education groups.[1] As you consider changes to the report card, we believe these foundational elements should remain firmly in place.

Overall rating. Akin to a GPA, Ohio’s overall rating offers a broad sense of performance by combining results from disparate report card measures. This prominent, user-friendly composite rating focuses public attention on the general academic quality of a school. In contrast, a system without a final rating risks misinterpretation. It would enable users to “cherry pick” high or low component ratings that, when considered in isolation, could misrepresent the broader performance of a district or school. We’ve already seen this occur—in 2017, one media outlet focused on the F’s received by several districts on indicators met, but skipped almost entirely over the other ratings.[2] Failing to assign an overall grade could also lead users to “tally up” component ratings on their own in a crude effort to create an overall grade. For example, district X’s four A’s might look better than district Y’s three A’s. But such a conclusion could very well be incorrect, since it treats all components as equally important. Some measures, such as achievement and growth, currently do and should carry heavier weight.

Takeaway: Ohio’s final, “summative” rating is very user friendly and helps avoid misinterpretation.

Letter grades. Along with fifteen other states, Ohio adopted an A-F rating system, first implementing it in 2012-13.[3] Because most of us have received A-F grades, almost everyone understands that an “A” indicates superior accomplishment while an “F” is a red flag and clear distress signal. Due to the widespread use of letter grades, they offer maximum transparency around results. As with overall ratings, the A-F system also helps users avoid misinterpretation. For instance, under Ohio’s former rating system, schools could receive the vague “continuous improvement” rating even if they performed worse than the year before. Other descriptive labels risk becoming euphemisms used to soften troubling results: “Below Expectations,” for example, has nowhere near the sense of urgency of an “F.”

Takeaway: While various rating systems exist, none can match letter grades in terms of public transparency. In turn, they hold the most promise of engaging families and communities in celebrating well-earned success or sparking transformation when necessary.

Achievement and growth. To its credit, Ohio has made measures of student achievement and growth—two distinct views of school quality—the bedrock of state report cards. Achievement considers how students fare at a single point in time and includes measures such as the performance index and scores on ACT/SAT exams. Growth, on the other hand, looks at the trajectory of students’ academic performance over time. To capture this type of growth, Ohio has long used “value-added” measures which track learning gains regardless of where students begin the year on the achievement spectrum. Value-added results form the basis of the Progress component and, starting with 2017-18 report cards, are now included in Gap Closing.

Takeaway: By featuring both achievement and growth prominently, Ohio offers a fairer, more balanced picture of whether students meet state standards at a particular moment in time and whether students are making progress.

Recommendations for Improvement

Despite these crucial strengths, we believe that there is still room to improve the state report card. In our December 2017 report Back to the Basics, which I believe you were provided at a previous meeting, we outlined a few suggestions that would further enhance the transparency and fairness of Ohio’s report cards.[4] 

At a high level, our key recommendations include:

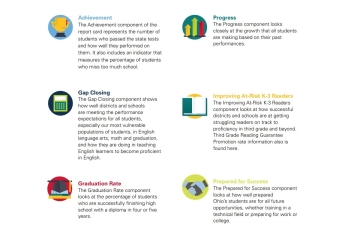
  1. Streamlining the report card by removing subcomponent ratings and assigning only an overall rating and five component ratings—Achievement, Progress, Gap Closing, Graduation, and Prepared for Success.

  2. Simplifying and renaming the Gap Closing component.

  3. Placing a greater emphasis on growth measures in the overall rating to provide a fairer picture of quality among higher-poverty schools.

In the following remarks, I’ll touch on each report card component. They generally follow our 2017 analysis, but I’ll also include some further thoughts on a few topics that were not as prominent two years ago.        

Achievement. This component provides a point-in-time look at how students perform on state exams. It includes both the performance index—a weighted measure of proficiency that awards additional credit when students achieve at higher levels—and indicators met, a subcomponent that focuses primarily on proficiency rates. We recommend eliminating indicators met and basing the Achievement rating solely on the performance index. Instead of a binary proficient/not-proficient metric, the performance index offers a more holistic view of achievement across the spectrum. This creates an important incentive for schools to help students at all achievement levels reach higher goals, rather than encouraging schools to focus narrowly on students just above or below proficient. If Ohio removes indicators met, the state should continue to report—but not grade—proficiency rates for each district and school.

We also strongly support the current design of the performance index, specifically the weighting system tied to each achievement level. We have deep concerns about proposals to change the weights in a way that would allow a small segment of high-achievers to mask the broader achievement struggles in a district or school—something that could be done, for example, by increasing the weight on categories such as Limited and Basic or adding a new achievement level.

Takeaway: We recommend eliminating indicators met and basing the Achievement rating solely on the performance index. We also strongly support the current design and weighting of the performance index.

Progress. This component contains four value-added measures—an overall value-added rating and three subgroup ratings. These measures gauge schools’ impacts on learning regardless of students’ prior achievement, which puts schools serving students of varying backgrounds on a more neutral playing field. In Back to the Basics, we suggested removing the subgroup value-added measures and transferring two of them—gifted and students with disabilities—to the Gap Closing component, thus offering a clearer view of schoolwide student growth via the Progress rating. We continue to believe Ohio should adopt those changes. Two additional matters regarding value-added that were not discussed in great detail in our 2017 paper are worth touching upon.

  • Years of data. There has been debate over whether to use a one- or three-year average value-added score to determine growth ratings. The state’s current method, multi-year averaging, helps avoid large changes in these ratings from year-to-year—schools are less likely to swing from “A” to an “F” as a result—but it also means using less current data. We recommend that the state split the difference and use a weighted average score, placing 50 percent weight on the current year value-added score, and 25 percent each on the two prior years.

  • Grading scale. The grading scale used to translate value-added scores into ratings has been heavily discussed, and was altered under House Bill 166. We believe that the HB 166 modifications were a poor solution to the larger challenge of anchoring ratings on “value-added index scores,” measures of statistical certainty that are often confused as indicators of the “amount” of growth that students make. In our view, Ohio should consider shifting away from index scores and instead focus on the actual gain (or loss) made by the average student in a district or school. Done well, moving in this direction has the potential to strengthen public and educator understanding of the growth results—it should better answer the more commonly asked question “how much growth did students make?”—and would allow Ohio to make a fresh start in its approach to translating growth data into ratings. It’s important to note that the issues surrounding the grading system do not indicate problems with the underlying statistical model, but rather reflect challenges in translating statistical results into a rating. 

Takeaway: We recommend removing the subgroup value-added measures and transferring two of them—gifted and students with disabilities—to the Gap Closing component. We also recommend using a weighted average score to determine growth ratings and focusing on actual gains in the grading scale.

Gap Closing. This component serves the purpose of ensuring that students from specific subgroups—students with disabilities, English language learners, economically disadvantaged students, and racial/ethnic groups—all receive a quality education. The current design of the component relies on a subgroup’s performance index, graduation rates, and, as of 2017-18, their value-added scores.

The calculations within this component remain complex and a little difficult to follow. In Back to the Basics, we suggest a somewhat simpler component that would offer a more transparent picture of subgroup performance. The table appended—from Back to the Basics—contains an illustration of our proposed framework, which relies on a series of indicators allowing users to see whether subgroups achieved performance index and growth targets. In that report, we also suggested that Ohio change the component name from Gap Closing to “Equity.” The reasons are twofold: 1) the component includes a few traditionally high-achieving subgroups and 2) while closing achievement gaps remains critical for Ohio, the component itself doesn’t necessarily capture whether gaps are closing. For instance, Columbus City Schools received a “B” in Gap Closing in 2018-19 but its black-white achievement gap in math increased by 0.5 points on the performance index and narrowed by just 0.2 points in ELA. The term Equity would better convey the component’s aim: To ensure that all subgroups are meeting state academic goals.

Takeaway: We recommend simplifying the component to offer a more transparent picture, and renaming the component “Equity.”

Prepared for Success. A central aim of K-12 education is to prepare students for success after high school. To this end, Ohio implemented Prepared for Success as a graded component starting in 2015-16. It has a two-tiered structure that, at the basic level, awards credit to schools when students earn remediation-free scores on the ACT or SAT, accumulate at least 12 industry credentials points, or attain an honors diploma. In addition, schools may earn “bonus points” when students who meet any of the primary targets also pass AP or IB exams or earn college credit via dual enrollment. Over the past year, there has been discussion around the design of Prepared for Success, including whether to shift to a single tier structure, incorporate additional measures, and even potentially eliminating it.

A few general comments. First, we believe that Prepared for Success merits inclusion in Ohio’s report card. Communities deserve to know whether young people graduate high school truly ready for their next steps in life. Second, policymakers should be careful not to jam too much data into the component and create an immense, complicated measure. Third, for formal report-card purposes, Ohio should depend on reliable data and use metrics that are difficult to game and avoid using subjective measures like readiness seals. Fourth, we should be mindful that post-secondary outcomes—e.g., college enrollment or apprenticeships after high school—are not necessarily in the control of K–12 schools. That is likely why Ohio reports college enrollment and completion rates within this component but refrains from rating schools based on those data.

With this in mind, we recommend that policymakers approach any revisions to Prepared for Success with care. The purpose of the component—to provide a view of graduates’ readiness—and the underlying metrics are sound. We would, however, support the following avenues for refinement. First, Ohio should incorporate military readiness and enlistment as an indicator of success. Second, we recognize that the ratings distribution on Prepared for Success (largely D’s and F’s) creates less differentiation than might be desired. To this end, we would support a revision to the grading scale in a way that maintains its rigor but also creates more differentiation. Third, Ohio could incorporate an improvement dimension that provides districts and schools with low baseline readiness rates a chance to demonstrate success, while also offering an incentive to schools to help more students achieve rigorous readiness targets.

What we would strongly discourage is eliminating Prepared for Success or weakening it by giving schools low-level “pathways” for earning credit. The last thing Ohio needs is a duplicative component that is indistinguishable from the less rigorous Graduation component.

Takeaway: We recommend avoiding the inclusion of subjective measures, like readiness seals, but adding military readiness and enlistment as an indicator of success. We also suggest revising the grading scale and incorporating an improvement dimension.

Graduation Rate. Speaking of graduation, this component currently includes the four- and five-year graduation rate as graded subcomponents, along with a composite rating. We recommend that the state award a single Graduation rating that combines (but does not issue separate grades for) the four and five year graduation rates. We also support efforts to calculate, and potentially include on report cards, a graduation rate that accounts for students who transfer schools. Though Ohio may not be able to replace the traditional adjusted-cohort calculation, this calculation would ensure that high schools are held accountable for graduation in proportion to the time in which a student was enrolled.

Takeaway: We recommend that Ohio base schools’ Graduation rating on a combination of its four-year and five-year graduation rates, without issuing separate ratings for each. We also support efforts to calculate, and potentially include on report cards, a graduation rate that accounts for students who transfer schools.

K-3 Literacy. Early literacy remains the foundation for later academic success. But with the exception of the KRA for incoming Kindergarteners, the state does not require schools to assess early elementary students in the same way as students in grades 3-8 and high school. In the early grades, schools may select among a variety of reading diagnostic exams, thus making school ratings more tenuous under this component. Moreover, state law allows certain districts and schools to receive no rating on K-3 Literacy,[5] and the measure focuses entirely on a subset of students—those deemed by their school to be “off-track” —rather than literacy among all students. While we strongly support Ohio’s efforts to improve early literacy, including the Third Grade Reading Guarantee, we recommend that the state either explore ways to significantly strengthen the K-3 measure, use it in a more limited way (for example, as a rating that only applies to K-2 schools), or remove it from the report card.

Takeaway: We recommend that the state either explore ways to significantly strengthen the K-3 measure, use it in a more limited way—for example, as a rating that only applies to K-2 schools—or remove it from the report card.

Additional Thoughts

Finally, a few words about several specific issues, concerns, and ideas that you may hear about in the coming weeks.

Data dashboards. As many of you know, House Bill 591 was introduced in the last General Assembly. It called for a “data dashboard” system that would display a blizzard of dense education statistics but would provide no ratings that provide context and meaning for everyday Ohioans. We firmly believe that a dashboard system would fail to provide the transparent, actionable information that Ohio families and communities deserve. Quite simply, clarity and transparency would be lost in a move to a data dashboard.

Demographics. One of the common critiques of the current report card system is that its results reflect too heavily the backgrounds of the students enrolled in schools. We certainly share that concern when it comes to achievement-based measures such as the performance index and even Prepared for Success. That’s why we recommend a balance between status-type measures and student growth, even somewhat favoring the latter in the overall rating formula. Three additional things should be kept in mind regarding demographics:

  • First, we must affirm through our report card system that we truly believe that all students can learn. It’s not fair to low-income students or children of color to set lower performance bars—the troubling “soft bigotry of low expectations”—just to inflate their schools’ ratings.

  • Second, Ohio should not be in the business of sweeping achievement gaps under the rug. It’s true that high-poverty schools face significant challenges, and their achievement-based ratings should be viewed in context. But hiding the fact that few students in a school can read or do math at grade level is neither transparent nor fair to students who need the extra help.

  • Third, we must remember that Ohio places a strong emphasis on the more poverty-neutral growth measures. Both the Progress and Gap Closing components incorporate value-added, and together these components account for roughly 35 to 65 percent of a school’s overall rating. Due to the weight being placed on value-added, quality high-poverty schools are beginning to stand out. For example, on the 2018-19 report card, 40 percent of Ohio’s high-poverty schools received a very respectable “C” or above as their overall rating.[6] 

Choose your own adventure. We’ve seen various proposals over the years that would rely on the higher of two results—a “choose your own adventure” type policy. This is wrong for a couple reasons. First, it can mask low performance. For example, if schools were able to drop their performance index score, it would hide the achievement struggles of students needing to make up significant ground. Second, it’s pretty easy to argue that proposals such as these are designed to make schools look better, rather than genuine attempts to improve the functioning of the report card. We all want highly rated schools. But top ratings should be earned, not given through shortcuts.

Non-academics. We all know that schools do lots more than academics. They help young people build character, learn teamwork, and bear increasing responsibility. Though critical, these intangible non-academic traits are incredibly challenging to gauge in a reliable, objective manner. Most experts in the field warn against incorporating them into formal accountability systems.[7] We concur.

Conclusion

Ohio’s report card has long been central to a transparent, publicly accountable K-12 education system. In the coming weeks, you’ll hear a number of opinions about state report cards. But you should go into this knowing that despite some areas that could be improved, your predecessors have built a generally strong report card. If you carefully evaluate the report card through the lenses of transparency, fairness, rigor, and consistency, I believe that an even stronger framework will emerge.

Thank you for the opportunity to speak, and I welcome your questions.

* * * * *

Appendix
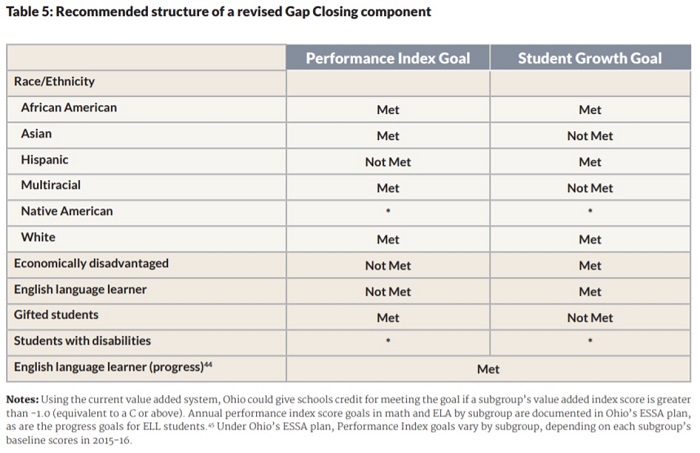
Chad report card testimony table​


[1] Education Commission of the States, Grading States, Rating Schools: http://www.ecs.org/docs/rating-states,grading-schools.pdf and DQC, Empowering Parents and Communities through Quality Public Reporting: https://dataqualitycampaign.org/wp-content/uploads/2016/03/Empowering-Parents-and-Communities-Through-Quality-Public-Reporting-Primer_1.pdf.

[2] https://www.10tv.com/article/how-did-your-school-perform-2016-17-state-report-cards-released-ohio-districts.

[3] https://www.excelined.org/wp-content/uploads/2018/11/ExcelinEd.PolicyToolkit.AFSchoolGrading.PolicySummary.2018.pdf

[4] https://fordhaminstitute.org/ohio/research/back-basics-plan-simplify-and-balance-ohios-school-report-cards.

[5] 62 Ohio districts received no rating on K-3 Literacy in 2018-19.

[6] “High-poverty” being defined as a school with more than 66 percent economically disadvantaged students.

[7] For example, Angela Duckworth, “Don’t Grade Schools on Grit,” New York Times: https://www.nytimes.com/2016/03/27/opinion/sunday/dont-grade-schools-on-grit.html and Carol Dweck, “Carol Dweck Revisits the 'Growth Mindset'” Education Week: https://www.edweek.org/ew/articles/2015/09/23/carol-dweck-revisits-the-growth-mindset.html?r=1003634458.

Fordham Logo

© 2026 The Thomas B. Fordham Institute
Privacy Policy
Usage Agreement

National

P.O. Box 110
Burke, VA 22009

202.223.5452

[email protected]

Ohio

P.O. Box 82291
Columbus, OH 43202

614.223.1580

[email protected]

Sponsorship

130 West Second Street, Suite 410
Dayton, Ohio 45402

937.227.3368

[email protected]