

School Funding
Ohio’s budget bill makes major changes to K–12 education policy
On July 1, Governor DeWine signed House Bill 110, the state’s operating budget for fiscal years 2022–23.
On July 1, Governor DeWine signed House Bill 110, the state’s operating budget for fiscal years 2022–23.

On July 1, Governor DeWine signed House Bill 110, the state’s operating budget for fiscal years 2022–23. The massive legislation, which encompasses virtually every area of state government, contains hundreds of provisions affecting Ohio schools. The big takeaway? As we noted in our press statement, the legislature made important progress in tackling thorny issues in the school funding formula, while also working to significantly expand educational opportunities for Ohio families and students. This post offers an overview of the most notable K–12 education provisions; in future blogs, we’ll take a deep dive into some of these policies.
Overall spending on K–12 education
With the economy in full recovery mode and state tax revenues exceeding expectations, the budget—predictably—raises overall spending levels. As the table below indicates, the state will spend $10.23 billion on K–12 education in FY 2022 versus $9.84 billion in FY 2021, a 4 percent hike. Spending rises again in FY 2023, going to $10.43 billion, good for an increase of 6 percent compared to FY 2021 outlays. Provided inflation rates don’t spike, these spending increases represent a solid investment of new state dollars on primary and secondary education. Keep in mind that this is above and beyond the enormous expenditure of federal funds reaching Ohio’s schools via the American Rescue Plan.
Table 1: State expenditures on K–12 education

Note: Amounts include all state funds administered by the Ohio Department of Education (excluding property tax reimbursements and school construction dollars) and do not include federal and local education funds.
School funding formula
One of the most highly anticipated issues in this year’s budget is where legislators would land on the school funding formula. After much debate, they agreed to implement the Cupp-Patterson model for the next biennium, which:
Educational choice
Shifting gears, the state budget greatly bolsters Ohio’s choice options. Among the key provisions on the charter school side, HB 110:
Turning to private-school scholarship programs, HB 110 makes a number of upgrades:
HB 110 also provides tax relief for Ohioans who support private-school students, along with parents who choose other educational options for their kids. The legislation:
Last but not least, the legislature created a brand-new education savings account (ESA) program that provides $500 per year to pay for afterschool programs or enrichment activities of parents’ choice. The program will be open to families with incomes below 300 percent of the poverty line, regardless of where their children attend school.
Post-secondary readiness and accountability
Finally, the state budget bill contains policies that address post-secondary readiness and accountability. These changes are more of mixed bag—though, note that separately enacted legislation on school report cards made significant improvements in that area.
* * *
As you can tell, K–12 education was a focal point in this year’s state budget debates. In many areas—particularly in the realm of educational choice—lawmakers took great strides forward. In other areas, they left open questions about what’ll happen next, most notably in the area of the school funding formula. Regrettably, we must express our chagrin for easing up on graduation standards. Nevertheless, much has been accomplished on behalf of Ohio’s parents and students—and there’s more work ahead. Onward!

Late Monday, members of the House and Senate made their final tweaks to the state budget and then sent it off to Governor DeWine. The final product contains a laundry list of education-related changes, chief among them a brand-new school funding system. It’s likely that this year’s budget cycle will be remembered for debates about the funding formula. But it should also be remembered for policymakers’ attempts—some successful and some not—to expand educational access to more Ohio students.
First, some context. When it comes to education, there are primarily two kinds of access. The first is access to opportunities. This includes academic opportunities, like the option to enroll in a high-performing school, take advanced courses, or receive tutoring or gifted services. But it also includes non-academic opportunities such as sports, music, or art. These types of experiences can be crucial to students’ social-emotional development and mental health—which, in turn, can improve their academic performance. Unfortunately, access to both academic and non-academic opportunities is often tied to family income.
The second form of access is to information. It’s one thing if opportunities don’t exist. It’s another when they do but students and families aren’t aware of them. Here, too, low-income students are more likely to miss out. Inadequate outreach on the part of schools and community organizations, limited or unreliable internet access, and a myriad of other issues can prevent students and families from being aware of what’s out there. The upshot is that gaps in educational access are often a one-two punch: The kids who could benefit most from a diverse set of academic and non-academic activities not only lack access to opportunities, they’re often unaware of the ones that do exist.
Which brings us back to the budget. State policy can help expand opportunity and informational access to underserved students and their families. And this year, in the wake of a pandemic that exacerbated existing access gaps, state policymakers sought solutions. The final budget bill expands school choice in huge ways. It removes geographic restrictions on startup charter schools, increases voucher funding amounts, and modestly opens up voucher eligibility. These moves have the potential to further expand the opportunities available to Ohio students. But school choice isn’t the only way to expand educational access for kids, and policymakers certainly got creative this year.
Consider Governor DeWine’s initial executive budget, which called for the completion of the Free Application for Federal Student Aid (FAFSA) to become a graduation requirement. FAFSA is the only way to access federal financial aid and grant programs, but thousands of students each year choose not to fill out the application and miss out on funding that could make college more accessible as a result. FAFSA completion is also strongly associated with postsecondary enrollment. Increasing the number of students who complete the application would expand access to information (by making students more aware of financial assistance options) and to opportunities (since completion is associated with postsecondary enrollment). Members of the House and Senate ultimately decided not to include this provision in the final bill, but the governor’s proposal still represents a good-faith effort to expand access to higher education.
Computer science proposals offer another example. In an increasingly digital world, students benefit from being exposed to computer science content and its associated career pathways. That’s why both the governor and the House backed the creation of a state plan for computer science education and a requirement for traditional public schools to provide students with the option of enrolling in a computer science class. These attempts at expanding access ended up faring slightly better than the FAFSA requirement—the conference committee opted to keep the state plan language but eliminated the mandate to offer a computer science class to every student.
The best example of this year’s innovative attempts to expand access, though, is the Afterschool Child Enrichment (ACE) educational savings account. This program—which made it through conference committee untouched—will provide families whose income is at or below 300 percent of the federal poverty line with $500 per year that can be spent on a variety of enrichment activities, including tutoring, arts camps, field trips, and instrument or foreign-language lessons. Any student who attends a public, nonpublic, or home school is eligible, which means thousands of students will soon have access to enrichment opportunities that they didn’t have before.
This year’s budget will likely be remembered for its school funding changes. But it was also much more than that. In every phase of the budget-making process, educational access took center stage. Many of these proposals didn’t make the final cut. But the fact that they were proposed at all—and that lawmakers are now more likely to consider them going forward—is a step in the right direction.

After several years of debate, Ohio lawmakers recently passed a much-needed revamp of the state’s school report card. The reform legislation (House Bill 82) won overwhelming approval in both chambers—a 32-1 vote in the Senate and 91-3 in the House—and Governor DeWine signed it into law on July 1. Along with other education groups, we at Fordham supported the smart revisions included in this measure.
The most noticeable change will be a shift from A–F school ratings to a five-star system. First appearing in 2012–13, letter grades moved Ohio to clearer and more widely understood ratings than the state’s previous approach, which used confusing descriptive labelling. Yet despite their widespread use in the state’s classrooms, many school officials blasted letter grades as being punitive and hurtful when applied to their schools. Various ideas emerged for a replacement—some sensible, others less so—and lawmakers in the end reached a fair compromise. Stars continue to offer transparency and clarity to Ohio parents, taxpayers, and the public about school quality, while taking some of the sting out of poor ratings. To add further context, HB 82 also calls for trend arrows and brief descriptions to be displayed next to the stars.
Legislators made a host of other changes that significantly improve the report card framework. Three are worth a closer review.
Increases the emphasis on the performance index and overall value-added progress measure
A school’s academic performance can be viewed through two different kinds of lenses: achievement and progress. Achievement measures offer “snapshots” depicting where students stand academically at a single point in time. Progress measures are more like a video camera. They capture how students grow academically over time. Both types of measures are essential to a well-rounded picture of school quality, and Ohio has long deployed both. The performance index (PI) has served as the principal measure of achievement, and the value-added (VA) measure has gauged progress over time.
While the PI and VA measures have traditionally been the backbone of the report card, recent years added other elements that reduced their prominence. HB 82 moves these key metrics back to the forefront in two important ways.
First, the legislation increases the weight of the Achievement and Progress components in the state’s Overall school rating framework. The tables below display the six report card components and their contribution to districts’ and schools’ Overall ratings under present policy and under HB 82. For districts, the Achievement and Progress components—which house the PI and VA measures—presently receive slightly more weight than the other components (20 versus 15 percent). The new formula will increase their weights to 25 percent each, while reducing the weight of other components to 12.5 percent each.
Table 1: Overall rating system for school districts
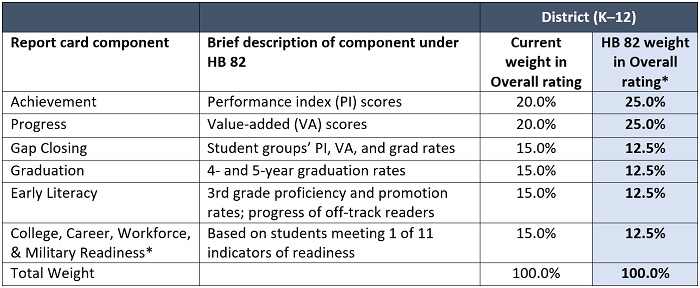
* Pending approval by a legislative committee, the College, Career, Workforce & Military Readiness component will be implemented starting in the 2024–25 school year. Overall ratings under the HB 82 framework will first appear for the 2022–23 school year, while component ratings will be assigned for 2021–22. For the component weights without the College, Career, Workforce & Military Readiness component, see this link.
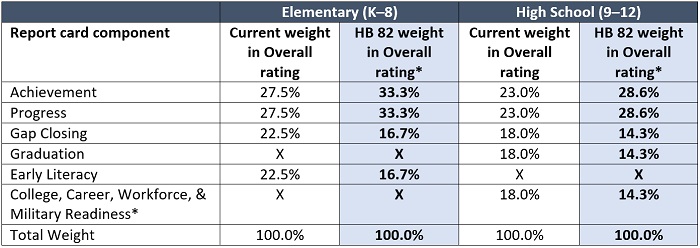
At a school level, Achievement and Progress will play an even more central role, depending on grade span. In K–8 elementary schools, Achievement and Progress will count for two-thirds of their Overall rating, while in most high schools, they will contribute 57 percent of the Overall mark.
Table 2: The Overall rating system for K–8 elementary schools and 9–12 high schools
The second way in which PI and VA measures become more prominent is via HB 82’s streamlining of the Achievement and Progress components. Under current policy, the Achievement rating is based partly on the PI, but also on indicators met. The two measures are closely related and HB 82 simplifies the Achievement component to be based solely on PI scores. A similar abridgement occurs within the Progress component. Previously, district- or school-wide value-added scores stood alongside three subgroup scores. Now the component will be based on just the overall score.
Restructures the Gap Closing component
The Gap Closing component of district and school report cards looks at the performance of various student groups defined in federal and state law. Such disaggregation ensures that disadvantaged children’s outcomes are tracked and reported separately—and not masked by school-wide averages.
Despite its vital purpose, the structure of the Gap Closing component in Ohio has been unnecessarily complex, limiting the public’s ability to see clearly whether student groups are meeting performance targets. Under the current framework, a school can receive full credit for meeting either the state’s PI goal for a certain student group or a VA goal. And should neither be met, the school could receive partial credit depending on the year-to-year change in that group’s PI score. Sound complicated? It is.
HB 82 greatly simplifies the design of the Gap Closing component so that parents and educators can gauge whether certain groups of students may be falling through the cracks. The legislation calls for a series of indicators based on whether a student group meets specific goals for PI, VA, and four-year graduation rates. Three additional indicators for gifted students, chronic absenteeism, and English learners’ progress on alternative assessments are also included.
To illustrate how the component works and may appear on a report card, Table 3 shows the various student groups and outcome measures. In this example, the school met twenty-five of the thirty-nine possible indicators, or 64 percent. The straightforward calculation supports public understanding, but just as importantly, a simple presentation such as this can help schools see where they may need to devote more attention. In the hypothetical case below, it may need to review its special education programs.
Table 3: Illustration of the overhauled Gap Closing component
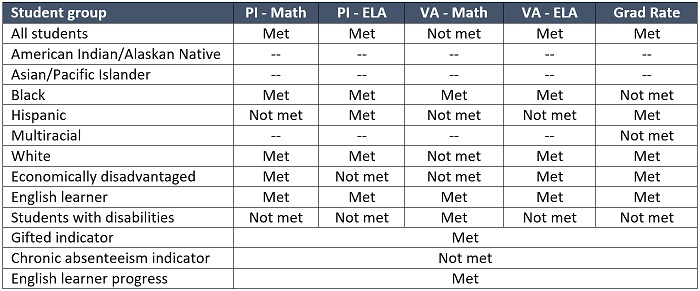
Note: In this illustration, dashes (--) indicate that less than fifteen students are in a student group, and thus their results are not reported separately. In accordance with Ohio’s ESSA plan, HB 82 sets the minimum “n-size” at fifteen.
Completely revamps the Prepared for Success component and renames it College, Career, Workforce, and Military Readiness
As the component’s name implies, Prepared for Success aims to gauge high school students’ readiness for college and career. First introduced in 2015–16, it has a two-tiered structure that, at a base level, awards schools credit when students earn remediation-free scores on their ACT or SAT, receive honors diplomas, or earn twelve points in Ohio’s industry credentials system. Beyond that, schools also receive “bonus points” when students who meet one of the above measures also pass at least one AP/IB exam or earn three or more dual enrollment credits.
The idea behind the component was sound—meeting readiness targets is crucial to students’ long-term success—but the execution fell flat. The component has been roundly criticized for having a draconian grading scale, with an overwhelming majority of schools receiving D’s and F’s. Some have also suggested that it’s been too narrowly focused on college readiness and hasn’t given schools due credit when students accomplished career-ready goals.
Recognizing the importance of readiness, Ohio lawmakers resisted calls to ditch the component. But they also saw the need to fix it. If approved by a legislative committee, a revamped component will be introduced in 2024–25 that does the following:
* * *
Overall, kudos to state lawmakers for rolling up their sleeves and making careful updates that will usher in a new day for Ohio’s school report card. By sticking to core principles of accountability, they’ve crafted a fairer, simpler, and more transparent report card model—one that is built to last.

Today, Fordham released a new report suggesting changes to Ohio’s school report cards to help parents and taxpayers get the best information about the performance of their schools and districts. This is the preface to that report.
Most of us can remember getting report cards as kids. Sometimes the grades would be a validation of a job well done; sometimes they were disappointing, considering all the effort we had made in class. Sometimes—let’s admit it—the grades were low but also fair, given the quality of our work or the lack of effort we had put into it.
Regardless of how we felt at the time, most of us recognize that report cards played an important, if not always pleasant, role in our education. We needed the feedback that they generated in order to know our strengths and weaknesses, and they were important to parents and guardians who could offer help when our grades signaled that greater support was needed.
Likewise, the educational health of our schools hinges in no small part on periodic reviews of how they’re doing. Over the past two decades, states have developed annual report cards intended to offer an objective view of the performance of individual schools and districts. What’s on those report cards is used by families making decisions about which schools to choose for their daughters and sons, by taxpayers seeking evidence that their dollars are being well spent, and by decision-makers tasked with holding schools accountable for student learning and—most importantly—helping them improve when necessary.
In some respects, Ohio’s report cards do a good job informing the public about school quality. Most notably, the user-friendly A-F grading system offers a clear view of performance that’s a long way from yesterday’s bureaucratic jargon (one recalls with chagrin the state’s old “continuous improvement” rating for many schools). For the most part, the grades are properly grounded in hard data taken from state assessments or college entrance exams. Several of the metrics rightfully encourage schools to pay attention to the achievement of all students, rather than focusing solely on children who haven’t yet cleared the “proficient” bar. Especially praiseworthy are the Performance Index—a weighted measure that awards additional credit for high achievers—and value added scores that account for the growth of individual pupils.
Yet Ohio still has ample room for improvement. For starters, Buckeye school report cards have gotten unwieldy in size, containing more than a dozen letter grades with a dizzying array of calculations used to generate these ratings. A second and somewhat related issue is that report cards rely too heavily on “status” measures—e.g., pupil proficiency or graduation rates—that largely correlate with demographics and prior achievement. As a result, Ohio unfairly downgrades high-poverty schools due in part to factors outside of their control. This violates what Douglas Harris, a Tulane University researcher, calls the “cardinal rule of accountability”: holding schools to account for that which they can do something about.
This paper offers suggestions to improve Ohio’s school report cards. Most of them would require legislative action—much of the report card framework is a matter of statute—while others could be handled by the State Board of Education or Ohio Department of Education (ODE). If these proposals were implemented, Ohio would move towards a simpler, fairer, and more balanced approach to grading districts and schools.
Why are we offering these proposals now? Didn’t ODE just submit the state’s Every Student Succeeds Act (ESSA) plan—including policies related to report cards—to the U.S. Department of Education? It’s true that ODE recently did this to comply with the federal law. But ESSA’s overarching intent is to devolve authority over education policy back to the states. As Senator Lamar Alexander—one of the chief architects of the law—declared, “The national school board era has come to an end.” State policymakers now have the ability to create report cards that make sense to Ohioans, including the flexibility to make changes to them when necessary. In addition, though ODE’s ESSA planning process engaged many stakeholders, this wasn’t the appropriate forum to make substantive revisions to school report cards. That’s primarily the job of lawmakers, as the accountability framework behind the report card is primarily a matter of state law. If elected officials decide to make changes (within, of course, the basic parameters of ESSA), ODE can submit the requisite paperwork to Washington to amend the state plan.
After report cards were released this fall, media coverage suggested that several state legislators, including the Senate and House education committee chairs, would be open to reexamining this issue. That’s good news. We agree that improvements are needed, yet they also need to be made thoughtfully. With these suggested changes, a much improved report card can become a reality.
We encourage you to download the full report.

The U.S. Department of Labor defines stackable credentials as a “sequence of credentials that can be accumulated over time.” Research indicates that they can lead to higher-paying jobs for students and improve talent pipelines for employers. Over the last few years, Ohio has become a national leader in developing stackable credential pipelines. But what kinds of programs are available, and do they actually lead to improved life outcomes?
A new report from the RAND Corporation and the Ohio Department of Higher Education (ODHE) seeks to answer these questions by examining the development of stackable programs by Ohio institutions and determining whether individuals who earned and stacked credentials received increases in their yearly earnings as a result. The report examines vertical stacking, when students start with an initial certificate and then stack credentials upward toward the degree level, as well as horizontal stacking, which occurs when students stack either credit or non-credit credentials at the same level. It focuses exclusively on the fields of health care, manufacturing and engineering technology (MET), and information and technology (IT) because they account for more than half of the certificates awarded in Ohio. And it considers three types of credentials:
1. Degrees, which can be earned in two or four years and cover general or field-specific coursework.
2. Certificates, which can be earned in two years or less and cover coursework focused on preparing a student for a specific job. Here, too, there are three types:
a. Clock-hour certificates, which offer no credit toward a degree and are awarded by an Ohio Technical Center (OTC), a community college, or a university.
b. Short-term credit-bearing certificates, which require less than one year of full-time enrollment and are awarded by community colleges and universities. Examples include certifications in welding or becoming an emergency medical technician.
c. Long-term credit-bearing certificates, which require one or more years of full-time enrollment and are awarded by community colleges and universities. Examples include certifications in massage therapy, or heating, ventilation, and air conditioning.
3. Certifications or licenses, which are awarded by industry-recognized groups to certify that students have specific knowledge and skills.
The researchers start by taking a close look at the programs offered by Ohio’s public institutions. First, they focused on the 2004–05 and 2018–19 academic years to identify changes over time. After examining administrative records provided by ODHE—a dataset that included 1.3 million credentials awarded over the course of fifteen years—they found that there was rapid growth in the number of certificate-level program offerings in all three fields.
Next, they sought to determine whether these programs were designed to encourage credential stacking. They identified seven key features of a stackable credential program, such as linking them to industry-recognized credentials and embedding certificates into a degree program. ODHE provided data again, this time from the state’s certificate program approval process, which relies on self-reported data. Overall, the percentage of new certificate programs that reported stackable features increased between 2014 and 2019.
But did this increase in programs with stackable features benefit Ohio students? To find out, the researchers used several statewide data sources—enrollment and completion records from OTCs, public community colleges, and universities, as well as unemployment records—to identify individuals who earned an initial certificate from an Ohio postsecondary institution between 2004–05 and 2012–13. After controlling for economic trends, college enrollment status, age, and other characteristics, they found that, on average, Ohioans who earned a postsecondary certificate saw a 16 percent increase in their annual earnings. Those who stacked multiple credentials, meanwhile, saw a 37 percent increase in earnings, which is equivalent to approximately $9,000 annually. But it wasn’t just stacking that gave students a boost—the type of stacking also mattered. Individuals who started with long-term certificates, stacked credentials vertically, and earned their credentials in the health care field saw the largest increase in earnings.
Results also varied depending on demographics. For instance, after obtaining an initial certificate, Hispanic students benefited from significantly larger earnings gains than White and Black students. When it came to stacking, however, Hispanic students had overall returns that were similar to White students. Overall earnings gains from stacking were much higher for younger students—those who completed initial certificates before the age of twenty-five—than for their older peers. And women saw higher earnings gains than men after obtaining an initial certificate and after stacking. Women who stacked credentials saw a 47 percent overall increase in earnings compared to a 22 percent increase for men. This difference, however, could be explained by the fact that women were overrepresented in the health care field, where returns for credentials are higher.
The report’s authors are careful to note that more data and research are needed to truly understand credential stacking in Ohio. But the results of this study should be welcome news to institutions who have invested heavily in stacked credential pipelines, as well as to individuals who are looking for a way to boost their earnings.
Source: Lindsay Daugherty and Drew M. Anderson, “Stackable Credential Pipelines in Ohio: Evidence on Programs and Earnings Outcomes,” RAND Corporation (June 2021).

Across America, states are constitutionally responsible for providing K–12 education, but in practice school districts are the primary structure by which education is delivered. The vast majority of such districts are run by locally elected school boards. Starting in the late 1980s, a number of states set up mechanisms to intervene in certain low-performing districts, moving authority from locally-elected boards to some form of governance ultimately answerable to the governor and/or the state education agency. The number of state takeovers increased in the twenty-first century, and a new working paper attempts to determine whether these efforts improved academic outcomes for students.
The analysts looked specifically at thirty-five districts across the country that were taken over by states between 2011 and 2016. These “treatment” districts are compared to either the full set of similar districts in those states that were never under state control or a random subset of them.
Academic outcomes were standardized across states by use of the Stanford Education Data Archive (SEDA), which norms the various state assessments to the National Assessment of Education Progress (NAEP), and allows for cross-state achievement comparisons. SEDA currently includes measures of third to eighth grade academic performance in mathematics and English language arts (ELA) at the grade-district level across all states for the time period being analyzed. These test scores are standardized to the nationwide population of school districts. The analysts conducted difference-in-differences analyses comparing the achievement trends of takeover districts to the trends of comparable districts not experiencing state takeover.
The topline finding is that state intervention produced on average no statistically significant effects in ELA and math performance. Non-significant negative effects on ELA outcomes were seen in years one through three of state control, with some bounce back to pre-takeover levels (still not statistically significant) by year five, although another downturn was observed in the handful of districts for which year-six data were available. The researchers note that they are less confident in their findings the further they go out due to the limited number of districts in the sample with four to six years of treatment. With that caveat, however, math outcomes largely mirror ELA: small and non-significant negative effects observed in years one through four of state control for those districts for which data was available that long, with non-significant positive effects observed in years five and six in the small handful of districts with that many years’ worth of data.
In discussion of possible mechanisms driving the null outcomes, the analysts examined average class sizes and per pupil expenditures and found no significant correlation. And while they did find that the charter sector share of student population increased by a statistically significant 2.83 percentage points in takeover districts—when the data for all post-takeover years were pooled—similar trends were observed in several pre-takeover years, and thus a direct correlation to takeover effects cannot be confirmed.
The analysts conclude that the loss of local democratic control in predominantly Black communities was a high cost for very little academic return. But this ignores the fact that there are indeed takeovers that have produced measurable gains, especially among Black students. Camden, New Jersey, and Lawrence, Massachusetts—both included in the study—are among them. Are they outliers or exemplars? Perhaps they are both. Brown University education professor Jonathan Collins probably put it best when he told Chalkbeat, “Why I think the results are so mixed in the study—the takeover in and of itself is a black box. It can mean anything.” Focusing analysis on the governance model is likely too simplistic an approach. What happens inside each central office, each school building, and each classroom in the aftermath of a change in governance is far more important. What changes do new leaders make and how quickly? Do teachers and principals hired by the previous administration buy in to the changes prescribed or is there resistance? Do parents who once attended the same schools their children now attend embrace new curricula, or do they agitate for the familiar status quo? Does the wider community listen to an outside receiver or CEO, or do loyalties to former leaders persist? These are minute and messy details, vitally important but likely resistant to simple analysis. Arguably the most successful state takeover of a school district, New Orleans, only occurred after every remnant of the previous education model was removed in the aftermath of Hurricane Katrina. If there could be a non-disaster version of such a sweeping change from top to bottom, that would be the model to implement and study.
SOURCE: Beth E. Schueler and Joshua Bleiberg, “Evaluating Education Governance: Does State Takeover of School Districts Affect Student Achievement?” Annenberg Foundation at Brown University (June 2021).

NOTE: On June 23, 2021, the Ohio Senate’s Primary and Secondary Education Committee heard testimony on Substitute House Bill 82 which would, among other things, make changes to the state’s school and district report cards. Fordham’s Vice President for Ohio Policy provided proponent testimony. These are his written remarks.
My name is Chad Aldis, and I am the Vice President for Ohio Policy at the Thomas B. Fordham Institute. The Fordham Institute is an education-focused nonprofit that conducts research, analysis, and policy advocacy with offices in Columbus, Dayton, and Washington, D.C.
I’d like to start by acknowledging the work of the many groups that have been working for a long time to improve Ohio’s state report card. Substitute House Bill 82 reflects positively on all of their efforts. That being said, most of the credit belongs to Chair Brenner and Representatives Jones and Robinson. While multiple groups—all with good intentions—worked on report card reform for years, in many areas the groups remained very far apart. It was the leadership, commitment, and unwillingness to give up by Senator Brenner, and Reps. Jones and Robinson that produced the bill before you.
As is often the case in the legislative process, no one got everything they wanted. Compromises were made on both sides. The most important thing is –if this bill becomes law—Ohio parents and communities will have a much improved report card.
I stood in front of this committee more than a month ago and in testimony on SB 145 implored you to adopt report card changes that adhered to four key principles. To restate, Ohio’s report cards must:
I’m pleased to say that Substitute HB 82 is well aligned with each of these principles.
Here are a few important changes that the sub bill makes:
Unfortunately, no bill is ever perfect. It’s hard to argue though that substitute House Bill 82 won’t greatly improve Ohio’s state report card framework in a variety of ways—both big and small. This compromise legislation was a long time coming, and I urge you to support it.
Thank you for the opportunity to provide testimony.