Mobile Navigation

  • National
    • Policy
      • High Expectations
      • Quality Choices
      • Personalized Pathways
    • Research
    • Commentary
      • Gadfly Newsletter
      • Flypaper Blog
    • Events
    • Scholars Program
  • Ohio
    • Policy
      • Priorities
      • Media & Testimony
    • Research
    • Commentary
      • Ohio Education Gadfly Biweekly
      • Ohio Gadfly Daily
  • Charter Authorizing
    • Application
    • Sponsored Schools
    • Resources
  • About
    • Mission
    • Board
    • Staff
    • Career
Home
Home
Advancing Educational Excellence

Main Navigation

  • National
  • Ohio
  • Charter Authorizing
  • About

Jeff Murray
1.30.2026
Gadfly Bites logo
Listen to this article
Loading the Elevenlabs Text to Speech AudioNative Player...

News stories featured in Gadfly Bites may require a paid subscription to read in full. Just sayin’.

  1. Let’s end our joint National School Choice Week/Catholic Schools Week celebrations with this one awesome clip. At the end of 2025, we heard that two new Catholic schools were in the works here in Columbus. At this timely moment, here are details on the first of those: Ave Maria Academy in Powell, planning to open this fall serving Kindergarten and pre-K students and expanding by one grade level each year until it reaches 8th grade. Plenty of information for you here on its founding leaders and its Catholic classical education model. But the biggest news, IMO, is that this will be the first new diocesan Catholic school in central Ohio in 30 years, not counting the independent(ly awesome) Cristo Rey High School. And the last one before that? The early 1960s. Let’s goooooo…. (Catholic Times, 1/27/26)

Did you know you can have every edition of Gadfly Bites sent directly to your Inbox? Subscribe by clicking here.

Policy Priority:
School Funding
Topics:
Governance
The Education Gadfly
1.30.2026
Gadfly Guy
Listen to this article
Loading the Elevenlabs Text to Speech AudioNative Player...

WHAT WE’RE READING

“Tennessee Republicans want a Houston-style takeover of Memphis schools. What does that mean?”—Bri Hatch, Chalkbeat Tennessee

—

Echoing Chad Aldeman, Matt Barnum digs into the challenge of assessing student outcomes for the growing number of children using ESA and voucher programs. As private school choice options expand nationwide, the lack of comparable data—or any public data at all—makes it nearly impossible to see what’s working and what’s not. A case in point is North Carolina’s Opportunity Scholarship program. “There is no publicly available testing data for how North Carolina’s more than 100,000 private school voucher students are performing.” —T. Keung Hui, The Charlotte Observer


Editor's note: This was first published on Mike Petrilli's Substack, SCHOOLED, a twice-weekly free Substack and email newsletter restarting the education-reform conversation.

Click here to subscribe for:

  • Sharp analysis of the week’s biggest K–12 debates

  • Curated commentary from across the ed-policy world

  • Lively discussion—including reader reactions and pushback

The Education Gadfly
1.30.2026
Gadfly Guy
Listen to this article
Loading the Elevenlabs Text to Speech AudioNative Player...

CHEERS:

“Philadelphia students’ average scores on state math tests have reached their highest rate in nine years, marking a significant recovery from pandemic-era learning loss.” —Rebecca Redelmeier, Chalkbeat Philadelphia

—

“Charter school students in Washington, D.C.’s high-poverty Ward 8 far outshined their peers citywide in mathematics last year—besting children in even the wealthiest communities—a triumph staff attributed to co-teaching and data collection, among other factors.” —Jo Napolitano, The 74

—

“Within the same family, some children may attend a Catholic school, while a sibling is educated elsewhere, typically homeschooled or a local public school, because often the Catholic school isn’t able to provide the level of support required for a student with a disability, despite families’ hopes for shared formation. In the Diocese of Lake Charles, Louisiana, a new Catholic school is being developed to broaden that access, and the leaders of St. Nicholas Catholic Academy hope their approach can inform similar efforts in other dioceses.” —Mary Rose, Catholic Vote

JEERS:

“Newly filed internal documents show how Google viewed its work with schools as a way of turning children into lifelong customers—while the company simultaneously acknowledged research suggesting that YouTube, one of Google’s main platforms, can be unsafe and distracting.” —Tyler Kingkade, NBC News

—

A Texas Tribune headline points out that state takeovers disproportionately affect districts serving many Black, Hispanic, and low-income students. But all a school has to do to avoid this fate is show a miniscule amount of growth. As one official notes, “For a campus to have gotten an F five years in a row, it is a disaster—it is truly an emergency.” Furthermore, the most important question is whether state takeovers help kids, especially those from the most disadvantaged backgrounds. And the story out of Houston looks very promising so far. —The Texas Tribune


Editor's note: This was first published on Mike Petrilli's Substack, SCHOOLED, a twice-weekly free Substack and email newsletter restarting the education-reform conversation.

Click here to subscribe for:

  • Sharp analysis of the week’s biggest K–12 debates

  • Curated commentary from across the ed-policy world

  • Lively discussion—including reader reactions and pushback

Brandon L. Wright
1.29.2026
Teenagers in library looking at phones
Getty Images/Carlos Barquero Perez
Listen to this article
Loading the Elevenlabs Text to Speech AudioNative Player...

The average American teenager now consumes more than eight hours of screen media daily, with short-form content like TikTok and YouTube Shorts commanding an ever-growing share of that attention. Meanwhile, reading for pleasure among teens has plummeted to historic lows, with only 17 percent of thirteen-year-olds reporting they read for fun almost daily, down from 35 percent in 1984. These statistics represent a fundamental shift in how young minds process information, form connections, and understand the world around them.

This transformation presents schools with a stark choice. They can’t control what students do in their free time, but they can decide what they reinforce in classrooms and through homework. Do we struggle against the current and try to restore traditional expectations—whole texts, sustained problem-solving, teacher-led discussion and writing, tech kept genuinely supplementary—even though that kind of learning is slower, harder, and increasingly out of sync with students’ attention spans and preferences? Or do we acknowledge that those ships have sailed and adapt our education systems to meet students where they are and engage them in what they like doing, even if that means compromising on what we’ve long considered essential elements of a well-rounded education?

A middle path, blending substantial amounts of traditional instruction and tech-based learning, is tempting. It’s easy to sell and implement, and is more or less the status quo in most districts. But it’s also the least stable option, and could well turn out to be the worst. The problem is its inherent asymmetry. The digital products competing for students’ attention are engineered to be irresistible and endlessly adaptive, while serious learning is, by design, effortful. In that competition, “balance” won’t hold.

Even if some districts manage it for now (or believe they do), as the technology keeps getting more compelling, a hybrid system will drift toward the lower-friction option because the incentives aren’t neutral. The increasingly powerful gravitational pull of screens will win in the end. Students prefer it, it simplifies classroom management, and even well-intentioned teachers get nudged toward whatever produces quick compliance and measurable learning. Meanwhile, the more we lean on tech, the less capable we become at the craft of low-tech teaching. Educators get less practiced at leading students through sustained discussion and the kind of close, extended work with texts and writing that traditional instruction demands. Students get less practiced at the patience and stamina those tasks require. It’s a slow, passive slide into defaulting to whatever is easiest.

And that’s what makes the “middle path” worse than a deliberate embrace of tech. Even if more tech is inevitable, the real question is whether it arrives by choice and deliberate design or by inertia. The middle path compounds tech’s costs with unaccountable drift, quietly shifting control over limits and priorities to companies optimizing for engagement and profit, not learning or well-being.

Framed that way, the answer feels obvious: Resist technology’s spread and try to preserve the core of traditional learning. But that conclusion makes sense only if it’s doable, if schools can sustain that approach long enough to change day-to-day behavior—teachers’ practice, students’ habits, and families’ expectations—without being steadily eroded by convenience, politics, workarounds, or the next wave of more compelling tech. If, instead, reversing today’s trends is unlikely or essentially impossible, efforts in that direction—however admirable—could waste precious time and resources while failing to effectively educate students who are ever less equipped to succeed in such a system. In that world, fully and deliberately embracing who we’re becoming and the tech that dominates our lives becomes the pragmatic choice, even if it’s a bleak one. So which is it? The side schools take in the near future will have huge consequences, and the decision will be enormously difficult.

* * *

The case for resistance is compelling on multiple fronts, not just nostalgia and habit. For example, when students engage with lengthy texts, they learn to follow complex arguments, understand nuanced perspectives, and sit with uncomfortable ideas long enough to truly grapple with them—habits that are hard to build with short-form content. Once students get home, assigned books and written work require sustained focus and self-pacing, with enough quiet attention to follow a line of thought without constant prompts. By contrast, many gamified apps, even when well-intentioned (and far too many aren’t), can pull students toward short bursts of engagement that reduce the need to persist and wrestle with uncertainty. Some popular low-tech models—like Waldorf schools and classical schools that limit screens—suggest this can work, though their present scale is modest.

Moreover, shared knowledge and common civic virtues have historically served as the foundation for meaningful discourse across different communities and backgrounds. When students read common texts and learn shared historical narratives, they develop a common vocabulary for discussing complex issues. Schools can try to do this through screens, but platform-driven, individualized instruction tends to fragment what students read and when they read it, making a common curriculum harder to sustain. And without this foundation, we risk further dividing into silos of knowledge and values where productive cooperation and respect become much more difficult.

But the uncomfortable truth is that the forces driving young people (and everyone else) to atomizing, addictive digital platforms may be too powerful to reverse, even when strong resistance is the goal. These products aren’t just popular. They’re engineered to capture and hold attention and backed by companies with strong incentives to prioritize growth and revenue. A history textbook, no matter how well-written, will struggle to compete with the dopamine hits provided by maximally engaging, personalized content.

So is acquiescence the right move? What happens if we choose that path? The implications are sobering but worth examining honestly. We might see educational approaches that increasingly embrace micro-learning modules and gamified content delivery. Traditional homework might give way to auto-graded, platform-based assignments that feel more like entertainment than academic work. And while the drift away from whole books and long-form work is already well underway, acquiescence would mean letting it deepen and harden—further shrinking sustained reading and extended writing and widening the gap between what serious learning demands and what students are able to tolerate. In practice, engagement would become the binding constraint—designing instruction for what students will actually do rather than what we wish they would do. That can be pragmatic, but it also creates a ratchet. The more we adapt downward to current tolerance, the harder it becomes to rebuild it.

This isn’t necessarily all negative (though I think it mostly is). Short-form content can be remarkably effective at conveying information quickly and memorably. Students are already addicted to such content and struggle with the alternative, so at least they’d be learning something, even if it’s less than previous generations. In places that have been resisting these trends, all of the students who feel disconnected from and disinterested in academic content might find new pathways to engagement through platforms they already understand intuitively. But that sort of tradeoff—more engagement, less depth—is exactly what makes the choice so consequential.

The reality is that both paths involve substantial risks. Attempting to restore traditional learning approaches might leave us fighting a losing battle against economic, technological, and cultural forces beyond our control, potentially alienating the very students we’re trying to educate—and somehow teaching them even less. But accepting the new reality might mean surrendering educational goals that have long served democratic societies.

Time is running out to make this choice deliberately. I don’t pretend to know which path will prove viable. But we should at least be honest about what we’re choosing and refuse to let the choice be made for us by default. If leaders don’t act soon, corporate incentives—profit, not student outcomes or well-being—will keep filling the vacuum. The question is whether leaders will respond purposefully or simply react as it happens. What’ll it be?

Policy Priority:
High Expectations
Topics:
Curriculum & Instruction
Governance
Teachers & School Leaders
Chad Aldeman
1.29.2026
Man making a speech
Getty Images/microgen
Listen to this article
Loading the Elevenlabs Text to Speech AudioNative Player...

Dear governor,

Do you want to be remembered for your leadership on education? Your state may be spending nearly half its budget on schools, and yet test scores continue to fall, especially for the students who need the most help.

That gap between investment and results creates both a problem and an opportunity. Here are seven simple, low-cost ways governors could help get education back on track:

1. Signal interest in opting in to the federal tax credit program

As of the last count, 17 states have already signaled their intention to opt in. I personally think it’s too early to formally opt in, given that we don’t know how exactly the program will work. Still, governors could say something bland like, “we’re going to give it a hard look once the regulations are finalized. While we would like to put our own stamp on it, we won’t say no if the federal government wants to invest in our state’s young people.”

2. Adopt a “phonics check” and share the results with families

In 2012, England started requiring all of its six-year-olds to take a simple “phonics check.” Each kid was given 40 words to read. If they could decode at least 32 of them correctly, they passed. The first year, only 58 percent could pass on their first try. Now, about 80 percent do. England passed a lot of other reforms, as well, but the phonics check has been a big part of their rise up the international rankings.

States should adopt their own versions of a phonics check. These are not fancy or costly, and they require only about five minutes per child to administer. But they accomplish several things. One, they help ensure that all kids are being taught to decode words. That’s the most important thing. But two, adopting a phonics check would also give policymakers a more useful metric to evaluate how their “science of reading” investments are going, rather than waiting until generic reading comprehension tests begin in third grade.

3. Ask for an independent review of the state’s accountability plan

It’s been a decade since Congress passed the Every Student Succeeds Act and states drafted their plans. Meanwhile, achievement scores have plummeted, especially for the lowest-performing kids.

So how are those accountability systems working? Are they providing clear goals for schools? Are they providing sufficient incentives for schools to focus on their lowest-performing students? Given the objective data, my hunch is that most states have work to do here.

Virginia could be a model. The Youngkin administration devoted significant resources to understanding how their old accountability system was working and creating a new one. (I played a role in that process.) But they didn’t stop there. The state’s version of the GAO conducted a thorough review of the new system, spoke with stakeholders across the state, and provided recommendations for tweaks and improvements. Every state should be doing something like this.

4. Direct the state department of education to share test results with parents and educators within 30 days of administration

State test results are too d*** slow. Despite much of the testing infrastructure shifting online, states are taking longer than ever to share the results. This is ridiculous and undermines the utility of having common, standardized benchmarks in the first place.

States like Florida, Tennessee, and Texas have been consistently fast. States like Ohio and Virginia have recently adopted policies to speed up their processes. It can be done, especially when we’re talking about the low-stakes sharing of results with parents and educators. Governors should make this a priority.

5. Adopt an automatic enrollment policy

This should be an easy win. As I wrote last year, automatic enrollment policies shift from an opt-in to an opt-out mindset. Instead of making students nominate themselves, schools use the objective data at their disposal to find students who are ready to be successful in more advanced courses.

States have options here about how aggressive they want to go. Do they want to focus on middle school math or extend the idea to other grades or subjects? Regardless, this is low-hanging fruit, and more states should consider their own versions.

6. Create a campaign around celebrating school success stories

Governors could be creative here. Could they create a prize for schools with the highest percentage of students making their annual growth targets? Or the schools with the strongest early reading or math scores? Could they partner with private businesses to reward kids who read or did math at home for 20 minutes a day?

In my opinion, we’re not talking enough about academic successes, so the goal here is to get governors out of the state capital and talking to those kids, teachers, and schools who are achieving great things.

7. Ask the state legislature to invest in great teachers

There are very few things on my list that cost money, but this is one of them. We’ve spent so much time over the last few years talking about the quantity of teachers in schools that we’ve lost sight of the fact that great teaching matters enormously.

Policymakers have been burned on teacher evaluation reforms in the not-too-distant past, so what’s the play here? I would look to the North Carolina Advanced Teacher Roles program, which invests in a small number of districts that are interested in reconfiguring the teacher role in the classroom. Instead of one teacher being in charge of one isolated classroom, these schools have teachers work in small teams that are responsible for a larger group of kids. These sorts of models have strong results both for teacher satisfaction and for delivering positive outcomes for kids.

If a state wants to go even bigger, they should look at the Texas Teacher Incentive Allotment program. Districts that submit their teacher evaluation systems to a state review can then receive extra money for their “Master” and “Exemplary” teachers. It’s a clever program design in that it ensures that districts are using rigorous and robust evaluation systems, and it provides extra money to teachers who work in high-need and rural schools.

Other ideas…

Across the country, more high school students are taking more advanced courses. There’s been a steady increase over time in the number and percentage of kids who complete Advance Placement, International Baccalaureate, and dual-enrollment classes. But I suspect states could drive those numbers up even faster by looking carefully at their course sequences and funding mechanisms.

Similarly, a lot of states are seeing more kids complete career pathways and earning industry-recognized credentials. That all seems good, in theory, but there are a lot of them, and many are not adding value to kids’ lives. State leaders should be taking a hard look at their incentive structures to make sure their policies are encouraging kids to pursue pathways that will actually lead to meaningful careers.

This list isn’t exhaustive, but it offers governors a menu of practical, affordable ways to drive real improvement. At a moment when education policy lacks strong national leadership, governors need to step up if they want to leave behind a legacy of meaningful progress for students and families.

Editor’s note: This was first published on the author’s Substack, Aldeman on Education.

Policy Priority:
High Expectations
Topics:
Accountability & Testing
Evidence-Based Learning
School Finance
Charter Schools
Curriculum & Instruction
Governance
Private School Choice
Teachers & School Leaders
J.T. Young
1.29.2026
Student raising hand
Getty Images/Jacob Wackerhausen
Listen to this article
Loading the Elevenlabs Text to Speech AudioNative Player...

A recent study offers a new look at charter schools’ special education performance. The Michigan findings show that special education students performed better in charter schools than in traditional public schools. This finding is significant because teachers unions and Democrats have frequently insisted that special education performance is charter schools’ Achilles’ heel.

Education outlet The 74 recently covered the Jan. 12 release of a study from the National Center for Research of Education Action and Choice. NC REACH examined the records of 1.7 million Michigan K–8 students who had switched from district to charter schools between 2013 and 2018. 

Based on this analysis, The 74 wrote: “The nonprofit concluded that while students with disabilities spent more time in general-education classrooms and received less intensive services than their peers in traditional public schools, their standardized test scores increased along with those of their classmates who didn’t qualify for special ed.”

Specifically, the Michigan data showed that “children who receive special education services do well academically with fewer supports when they enter charter schools.” The REACH study found that “after charter enrollment, students are more likely to be enrolled in less intensive and less costly programs such as resource programs.” In addition to “a decrease in the use of special education programs and services,” students with disabilities also had improved attendance and academic performance—as did general education students who switched to charter schools. After three years in charter schools, both students with disabilities and general education students experienced “large improvements in test scores.”

The 74 points out that the Michigan study findings “match a similar study in Boston, which revealed that children with disabilities who were accepted at a charter school through a lottery system were more likely to meet college-ready benchmarks than special education students in traditional public schools.”

What makes these findings so significant is that charter schools’ enrollment of students with disabilities has trailed public schools’ enrollment in the past. This is due to the perception of charter schools’ mixed record with these students.

The 74 reports that, recently, a charter school in Chicago and another in Maryland have been charged with noncompliance with their states’ special education laws, while one in Indianapolis has been found to suspend students with disabilities at three times Indiana’s average.

Teachers unions have long claimed that charter schools’ record with special education is poor. Just last year, in New York City, teachers unions called on state lawmakers to act against charter schools on this basis. Wrote Chalkbeat New York: “New York City’s charter schools tend to enroll a smaller portion of students with disabilities, English language learners, and those in temporary housing than neighboring district schools, despite a state law that requires charters to aim to serve comparable shares of high-needs students. The union, which has long cited that disparity as one reason for some charters’ above-average test scores, is pushing lawmakers to toughen...law by adding penalties for schools that fall short of the targets.”

Of course, there is another reason that teachers unions do not like charter schools: Charter school teachers rarely unionize. Just one in nine charter school teachers (11 percent) are members of unions, compared to nearly seven in 10 in traditional public schools.

In addition to charter schools taking students away from traditional public schools (where teachers unions’ members are), they also take away dues going to teachers unions. So despite teachers unions having been early supporters of charter schools (in 1988, Albert Shanker, national president of the American Federation of Teachers, called for “schools of choice”), that support long ago disappeared.

The money—and the opposition to charter schools—does not stop with the teachers unions. According to Open Secrets: “Even more than most labor unions, [teachers unions] have little use for Republicans, giving Democrats at least 94 percent of the funds they contributed to candidates and parties since as far back as 1990, where our data begins.” Not only do teachers unions give overwhelmingly to Democrats, they have also greatly increased their political giving: From 2004 to 2016, teachers unions’ political contributions jumped from $4.3 million to over $32 million. By 2024, political contributions hit $47.7 million and skewed even more, with 98.5 percent going to Democrats.

So not only have teachers unions opposed charter schools, but states with strong Democrat majorities have restricted them. A recent article in Education Next by Joshua Goodman and Abigail Francis on Massachusetts enrollment shifting from public to non-public schools notes that the expansion of charter schools is “restricted by Massachusetts law, which caps both the number of charter schools statewide and the share of each district’s funds that can flow to charters.”

Democratic politicians in Massachusetts were hardly alone. An article last summer in Education Next noted: “When charter laws have passed, Democrat-aligned interest groups have lobbied state legislators to underfund them and limit their growth. Last year, while charter schools in New York City were approaching capacity and the number of students on wait lists for entry exceeded 173,000 statewide, Democrats in the state legislature blocked appeals from parents to raise the cap on the number of charters allowed to open. In 2022, President Joe Biden proposed regulations that would make it more difficult to open charter schools and threatened to cut start-up funding for new charters.”

All this brings us back to the Michigan study of special education students’ performance in charter schools and its potential importance. America’s K–12 education system is in crisis. We need every innovative approach for reform to be in play. Charter schools are—and have always been—just such an innovative option; it’s what they were originally designed to be decades ago.

Reappraisal of their performance in special education, especially that they could be judged by results and not simply judged by a tabulation of hours, could help remove one of the charter school critics’ most potent charges—and give America one more tool for achieving the education innovation it desperately needs.

Editor’s note: This was first published by RealClearEducation.

Policy Priority:
Quality Choices
Topics:
Evidence-Based Learning
Charter Schools
Curriculum & Instruction
Governance
Teachers & School Leaders
Jeff Murray
1.29.2026
Diverse students
Getty Images/jacoblund
Listen to this article
Loading the Elevenlabs Text to Speech AudioNative Player...

Traditional school districts have increasingly embraced giving students more options within their systems in recent decades, in response to growing charter and private school competition and the desire of district parents for more specialized programs and services for their children. How does district-centric school choice impact the pupil demographics of individual buildings, long governed by race- and income-based residential proscriptions and district attendance lines? A trio of researchers has released a new working paper examining that question.

The research team, led by Francisco Lagos of the Inter-American Development Bank, looks at the 300 largest school districts in the United States to identify which of them implemented a choice-driven admission system any time between 2000 and 2022. They sought districts where at least 50 percent of schools participate in a centralized application process; where applications are submitted through a single, districtwide platform (rather than through individual schools); where parents are allowed to rank multiple choices for their children; and where student assignments occur via random allocation—including lottery for oversubscribed seats—without regard to academic, behavioral, or attendance records.

Seventy-one districts met all these criteria. The remainder comprised a comparison group of so-called “non-choice” districts, which may have incorporated some parental options but did not meet all the criteria. Choice districts were larger on average than non-choice districts (88,942 students compared to 42,844), number of buildings (128.7 versus 57.2), and total area population (611,000 versus 264,000). Choice districts had a higher percentage of charter schools within their borders and exhibited higher levels of school-aged poverty. The researchers use a difference-in-differences design, exploiting the staggered adoption of school choice programs over time, to determine the impact of these programs on school composition, racial exposure[1], and racial/ethnic distribution.

Overall, the introduction of a centralized school-choice admissions system was found to “modestly redistribute students” across district buildings. The exposure of non-White students to White students increased by 1.8 points in choice vs. non-choice districts, and Black students’ exposure to White students specifically rose by 1.6 percentage points. However, White students experienced reduced exposure to all other racial and ethnic groups, likely led by the somewhat surprising finding that the introduction of school choice boosted the number of White students enrolled in those districts. In total, although centralized school choice did impact individual buildings, it did little to alter district-wide patterns of racial and ethnic segregation.

These findings lead Lagos and his team to conclude that school choice should not be introduced into traditional districts as a means to reduce pre-existing segregation patterns, which—it should be stated—is their area of concern and motivation for undertaking the study. But it should not be construed as the primary concern of any of the districts involved. As pervasive as residential- and income-influenced segregation is within traditional school district boundaries, other research has shown that school choice for parents is more about academics, extracurriculars, and school quality than it is about racial or ethnic concerns. It seems more likely that districts are concerned primarily with these important points—specifically to keep their families from moving to charter, private, and micro-schools, or to homeschooling—than they are with unwinding decades of history.

SOURCE: Francisco Lagos, Jason Saltmarsh, and Jing Liu, “The Effect of Centralized-Admission School Lotteries on Between-School Segregation: Evidence from 300 Largest School Districts in the United States,” Annenberg Institute at Brown University (December 2025).


[1] “Exposure” is defined as “the average racial and ethnic composition of the schools attended by students of a given group. This index reflects the probability that a randomly selected student from group A attends a school with students from group B, weighted by the group A population.”

Policy Priority:
Quality Choices
Topics:
Evidence-Based Learning
Charter Schools
Curriculum & Instruction
Governance
Private School Choice
Teachers & School Leaders
Jill Hoppe
1.29.2026
Students paying attention in class
Listen to this article
Loading the Elevenlabs Text to Speech AudioNative Player...

It is no secret that the Covid-19 pandemic disrupted K–12 education in the United States. From sharp increases in chronic absenteeism to heightened dropout rates, the aftershocks are still being felt today. Did these various declines in student engagement unfold differently across different types of schools—particularly between charter schools and traditional public schools (TPS)? A new CALDER working paper addresses this question.

The researchers analyze school-level data from 38 states spanning the 2016–17 through 2022–23 school years. They combined these data with school and community characteristics from the Common Core of Data (CCD) and the Stanford Education Data Archive (SEDA), covering roughly 3,400 charters and 64,000 TPS. Using four measures of engagement trends—attendance, chronic absenteeism, high school graduation, and dropout rates—the study compares pre- to post-pandemic changes in student engagement in charter schools with changes in TPS.

At the national level, the topline finding is straightforward: Student engagement declined in both charter schools and TPS, and on average, charter schools did no better than TPS in combating post-pandemic disengagement. In both sectors, average daily attendance fell from 95 percent to 92 percent in elementary and middle schools, and from 93 percent to 91 percent in high schools. Chronic absenteeism rates jumped by more than 75 percent in elementary and middle schools and by 40 percent in high schools. In fact, once school characteristics and state context are controlled for, the study finds no statistically significant difference between charter schools and TPS in how student engagement changed after the pandemic.

Yet these national differences mask substantial variation in charter outcomes from state to state. While charter schools fared significantly worse than TPS in limiting engagement declines in states like Illinois, New York, and Ohio (where drops in daily attendance rates were nearly double those in TPS), they performed significantly better in about half of the study states, like Florida and Louisiana. It is worth noting that, in Maine and Virginia, attendance rates in charters actually increased after the pandemic.

At the high school level, changes in graduation and dropout rates in TPS were relatively small, typically within 2–3 percentage points in either direction. Charter high schools, by contrast, show much wider swings across states. In roughly half of the states studied, charter graduation rates increased and dropout rates declined, while in the other half, graduation rates fell and dropout rates rose. In Oregon, for example, charter graduation rates rose by almost 8 percentage points and the dropout rate declined by nearly 4 percentage points, while in states like Tennessee and Arizona, graduation rates decline by around 4 percentage points and dropouts rose by 3–4 percentage points. This pattern illustrates greater volatility of charter outcomes from state to state, while TPS outcomes tended to shift more modestly and consistently.

The study also finds that schools within the same state tended to move together, particularly on high school dropout rates, suggesting that broader state conditions shaped engagement trends during the pandemic. School characteristics such as locale and student demographics explain about 10 percent of the variation in daily attendance rates, 15 percent in dropout rates, and roughly 22 percent in chronic absenteeism and high school graduation rates, regardless of sector. But differences between states account for an even larger share of the variation on some measures. State context explains roughly 33 percent of the variation in daily attendance and 18 percent in dropout rates, beyond what can be attributed to school characteristics. By contrast, state differences explain far less (8–10 percent) of the variation in chronic absenteeism and graduation rates. This suggests that some aspects of engagement, such as daily attendance, were especially sensitive to state-level conditions, while others, like chronic absenteeism and graduation rates, were influenced more by factors at the school or community level.

Taken together, these patterns suggest that charter schools function less like a single, coherent system and more like a collection of state- and city-specific sectors, producing wide variation in post-pandemic engagement outcomes. Charter schools are also more likely to be concentrated in urban areas with higher levels of socioeconomic stress, lower median income, and higher poverty rates—communities that experienced especially severe pandemic-related disruption. Additionally, they operate under different laws and conditions depending on the state. These factors may have amplified engagement challenges in some states while playing a smaller role in others. At the same time, TPS may have been subject to district-level policies and state-level accountability measures that smoothed engagement declines and reduced volatility across schools.

Further analysis may help explain this variation, perhaps if charter funding or the availability of charter authorizers makes a difference. Without a clearer understanding of why engagement outcomes diverged so sharply across schools and states, efforts to reverse disengagement risk repeating the same uneven results.

SOURCE: Zeyu Xu, Dan Goldhaber, and Rachel Dao, “Student Engagement in Charter and Traditional Public Schools Before and After the COVID-19 Pandemic,” CALDER Center for Analysis of Longitudinal Data in Education Research (December 2025).

Policy Priority:
High Expectations
Topics:
Evidence-Based Learning
Charter Schools
Curriculum & Instruction
Teachers & School Leaders
Aaron Churchill
1.28.2026
Ohio report card - early lit measure blog image
Getty Images/Syuzanna Guseynova
Listen to this article
Loading the Elevenlabs Text to Speech AudioNative Player...

State report cards have long provided essential transparency and accountability for student learning in Ohio schools. The current framework has commendable features, yet policymakers should make sure that the system functions well and meets intended goals. This is the second in a series that examines report card elements that could use refinement (part one covered chronic absenteeism).

With Ohio’s science of reading law on the books, one pressing question is how state policymakers will hold schools accountable for rigorous implementation. In this vein, the Ohio Department of Education and Workforce (DEW) last fall announced it would check whether schools have adopted state-approved reading curricula. That’s a good start, but surely more than compliance reviews will be required. More robust options might include forming an expert state support team—akin to the U.K.’s renowned inspectorate—that conducts site visits, evaluates practices, and recommends improvements. Restoring the state’s third grade retention policy would also heighten accountability for teaching children to read via effective practices.

Though often overlooked in early literacy discussions, another accountability tool is the school report card. To its credit, Ohio has featured an early literacy component on the report card since 2016. But does the measure provide a clear picture of which schools are most effective at teaching reading and which ones need the greatest help? Is the component—as currently designed—up to the task of fairly and rigorously holding schools accountable for literacy outcomes?

Early literacy measure, at a glance

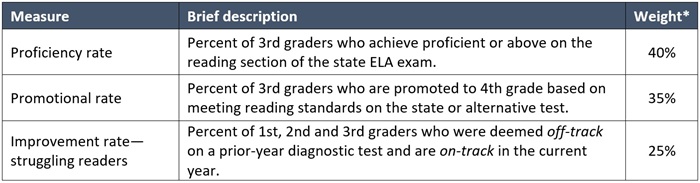
Before diving into policy issues, let us review the mechanics. As Table 1 shows, the early literacy component consists of three underlying elements, which combine and produce an early literacy rating based on a series of weights. The measures include third grade reading proficiency rates, the third-to-fourth grade promotional rate, and an improvement measure for students struggling to read.

Table 1: Structure of Ohio’s early literacy component

Ohio report card - early lit measure blog table 1
Note: (*) Weights are adjusted if a measure does not apply to a school. For more technical detail, see this document from the Ohio Department of Education and Workforce.

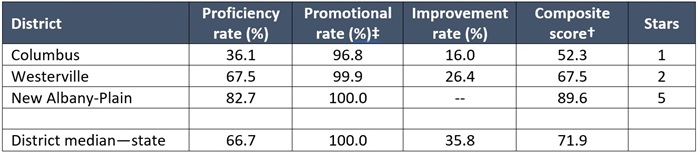
Table 2 illustrates how the measures work using data from three Central Ohio districts of varying levels of student poverty. Starting with Columbus, we see that third grade proficiency lags significantly behind the state’s district median, as well as the rates for Westerville and New Albany-Plain. This reflects, in part, socioeconomically driven achievement gaps (we know those gaps start early), but also—as suggested by its low improvement rate—ineffective reading instruction. Despite the academic challenges, Columbus records a 96.8 percent promotional rate, which mirrors the lofty rates statewide. Still, that’s not enough to help Columbus’s literacy rating, which is a lowly 1 out of 5 stars. As for the suburban districts, Westerville earned 2 stars and New Albany-Plain achieved a 5, though it was exempt from the improvement measure, a loophole discussed later.

Table 2: Ohio’s early literacy measure in action (data from 2024–25)

Ohio report card - early lit measure blog table 2
(†) The composite score is a weighted average across the three measures; the score produces a star rating based on a grading scale set in Ohio administrative rules. (‡) Moving forward, promotional rates are likely to decrease due to a recent legislative change that removes students promoted via parental exemption from the numerator (it will only count students promoted based on a state or alternative test).

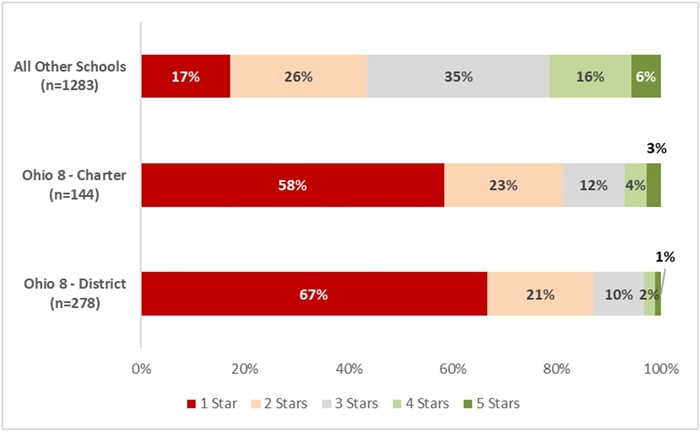
Looking more broadly at the statewide results, Figure 1 shows the early literacy ratings of district and charter schools located in the Ohio Eight cities, as well as all other elementary schools in the state. Very few urban, high-poverty schools fare well on the component: Just 19 out of 422 Ohio Eight schools received 4- or 5-star early literacy ratings (5 percent), while 359 received 1 or 2 stars (85 percent). Schools outside of the large urban areas received higher ratings, though the distribution still leans negative (43 percent 1 or 2 stars versus 22 percent 4 or 5 stars).

Lower early literacy ratings in high-poverty urban areas reflect achievement gaps, as well as the relatively heavy weight proficiency rates receives in the rating calculation. High-poverty urban schools also tend to struggle on the improvement measure, perhaps because they are more likely to enroll students who are furthest from the on-track bar.[1]

Figure 1: Distribution of school-level early literacy ratings, 2024–25

Ohio report card - early lit measure blog figure 1
Note: The Ohio Eight cities are Akron, Canton, Cincinnati, Cleveland, Columbus, Dayton, Toledo, and Youngstown.

How to strengthen the early literacy measure

The early literacy component serves important purposes and has its strengths. The use of third grade proficiency rates maintains a clear focus on Ohio’s central goal of ensuring that all children are strong readers by the end of third grade. It’s also the data point that parents are likely to best understand and care about when they search for an elementary school. Including an improvement dimension is also critical in the effort to identify effective and ineffective schools. However, the current measure also has limitations. Below are ways that policymakers could improve it.  

1. Eliminate the exemption from the improvement measure. Ohio statute exempts schools from the improvement measure when less than 10 percent of kindergartners are deemed off track in literacy. While this seems like a narrow carveout, it actually lets dozens of schools off the hook for helping struggling readers; 67 districts and 145 schools were exempt last year. It’s not like they are lacking students with reading challenges: In 41 exempt districts, more than 20 percent of third graders fell short of proficiency. All this loophole does is relieve—for no justifiable reason—certain (largely wealthy) schools of accountability for all students’ reading success.

2. Recalibrate the grading scale to better identify high- and low-performers. The state’s grading system produces ratings that make it hard to identify superstar elementary schools—the ones we should be learning from—or ones that require the most help. At the top end, just 80 out of 1,705 elementary schools received a 5-star rating last year (and of them, 56 were not subject to the improvement measure). In other words, it’s slim pickings—so far as the early literacy ratings go—in finding exemplars, particularly in urban communities, where fewer than 2 percent of schools earn 5 stars. At the bottom end, nearly 500 elementary schools received 1-star ratings, mainly located in the Ohio Eight. That’s way too many schools for the state to help with additional assistance or training. Reworking the grading scale, which can be done through revisions to administrative rules, would help ensure that the early literacy rating provides better differentiation in school performance.

3. Explore additional options for refining the improvement measure. The current method, which looks at whether off-track students move to on-track status, is a good start. But it could also miss improvements among students who are far below the “on-track” threshold, and it does not consider the continuing progress of on-track students. State policymakers should explore methods that might offer a sharper and more comprehensive picture of schools’ effectiveness in early literacy. For instance, could the state better leverage diagnostic tests to measure growth, perhaps by looking at changes in students’ scaled scores or percentile rankings? Could it implement a “gap-year” value-added measure that captures changes from the fall of kindergarten (KRA) to third grade state tests to supplement the diagnostic test data? A stronger K–3 growth measure would better assist policymakers and educators in nailing down what’s working schoolwide in early literacy—e.g., specific curricula or professional development. It might also encourage policymakers to increase the weight on growth in the early literacy rating, which could yield results that are more neutral to demographics and allow better identification of high- and low-performing schools, particularly in urban areas.

4. Remove the promotional rate from the component. Starting next year, the promotional rate will include only students who move to fourth grade based on the state’s ELA exam or an alternative assessment. This is an improvement relative to the former method used in 2024–25, as it removes a perverse incentive to socially promote students.[2] The shift, however, could produce early literacy ratings that are even more strongly tied to demographics, as promotional rates will more closely mirror proficiency rates. Including the third-to-fourth grade promotional rate was never a good idea to start with, and it’s best to drop an element that either creates bad incentives and astronomical rates or largely duplicates the information provided through proficiency rates. 

* * *

Ohio’s science of reading law promises stronger literacy instruction statewide. But whether that promise is fulfilled in the form of increased reading proficiency hinges on rigorous implementation in thousands of elementary classrooms. Accountability for results is one policy tool that helps ensure schools stick with the science, and enables the state to provide effective, well-targeted supports. With some improvements, Ohio will have an early literacy measure that provides clearer information to parents, communities, and educators about the progress children are making in reading.  


[1] At a district-level, improvement rates and student poverty (direct certified) are moderately correlated (r = -0.48), while third grade proficiency and poverty rates are strongly correlated (r = -0.73). Direct certification rates are not available at the school-level.

[2] House Bill 455, passed by the House in late 2025 and now pending in the Senate, proposes to reverse the change and revert to a promotional rate that counts in the numerator students promoted via parental exemption.

Policy Priority:
Standards & Accountability
Topics:
Accountability & Testing
Jeff Murray
1.28.2026
Gadfly Bites logo
Listen to this article
Loading the Elevenlabs Text to Speech AudioNative Player...

News stories featured in Gadfly Bites may require a paid subscription to read in full. Just sayin’.

  1. The talk of the week is the amount of school time districts are required to provide their students in the year. Both in terms of the mounting number of snow/cold day cancellations that could lead to make up days eating into summer break… (Cleveland.com, 1/26/26) …and in terms of yet another Ohio district preparing to implement a four-day school week this fall. Personally, all this academic "how little can we get away with" talk bothers me. (Cleveland.com, 1/26/26)

  2. Of course we’re never too busy with other stuff to talk about money (and, honestly, it’s usually the underlying point of all those other clips anyway). So here’s a quick look at Ohio House Bill 643, which would place an upper income limit on families able to receive an EdChoice Scholarship. One bill sponsor calls the $500,000 cap “reasonable” and “fair”, and notes that any voucher funding not given to those top earners would be available to support lower-income families. However, while this coverage does note that only 1.8 percent of Ohioans meet or exceed that annual income threshold, it neglects to mention that many of these are probably older adults without school age kids or that the EdChoice amount for any kids who might qualify at that income point and actually get a voucher averages about $725 per kid per year. (Calculator here, courtesy of the Catholic Diocese of Youngstown.) This feels to me like the definition of a symbolic effort more than it does fairness for any actual people. But it’s School Choice Week and I’m celebrating real victories for real families, so I’ll say no more about it. (NBC4 News, Columbus, 1/28/26)

Did you know you can have every edition of Gadfly Bites sent directly to your Inbox? Subscribe by clicking here.

Policy Priority:
School Funding
Topics:
Governance

Pagination

  • First page « First
  • Previous page ‹ Previous
  • Page 58
  • Page 59
  • Page 60
  • Page 61
  • Current page 62
  • Page 63
  • Page 64
  • Page 65
  • Page 66
  • Next page Next ›
  • Last page Last »
Fordham Logo

© 2026 The Thomas B. Fordham Institute
Privacy Policy
Usage Agreement

National

P.O. Box 110
Burke, VA 22009

202.223.5452

[email protected]

Ohio

P.O. Box 82291
Columbus, OH 43202

614.223.1580

[email protected]

Sponsorship

130 West Second Street, Suite 410
Dayton, Ohio 45402

937.227.3368

[email protected]