Mobile Navigation

  • National
    • Policy
      • High Expectations
      • Quality Choices
      • Personalized Pathways
    • Research
    • Commentary
      • Gadfly Newsletter
      • Flypaper Blog
    • Events
    • Scholars Program
  • Ohio
    • Policy
      • Priorities
      • Media & Testimony
    • Research
    • Commentary
      • Ohio Education Gadfly Biweekly
      • Ohio Gadfly Daily
  • Charter Authorizing
    • Application
    • Sponsored Schools
    • Resources
  • About
    • Mission
    • Board
    • Staff
    • Career
Home
Home
Advancing Educational Excellence

Main Navigation

  • National
  • Ohio
  • Charter Authorizing
  • About

Robert Pondiscio
2.5.2026
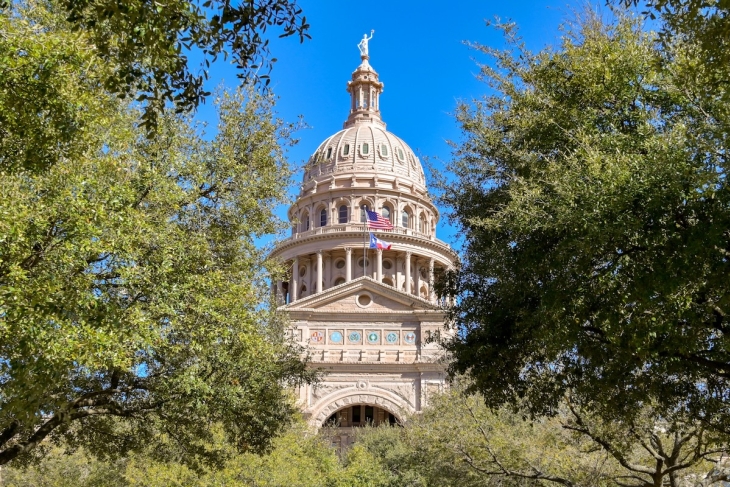
Texas Capitol
Getty Images/Ceri Breeze
Listen to this article
Loading the Elevenlabs Text to Speech AudioNative Player...

Texas is once again at the center of a familiar but unresolved debate about literacy, culture, and the proper role of schools. A proposed statewide list of books, plays, poems, and other literary works that all students would be expected to read has prompted criticism—and, in some quarters, predictable alarm.

The draft list, released by the Texas Education Agency pursuant to recent legislation, is now before the State Board of Education, which is expected to debate, amend, and vote on it in the coming months. It proposes roughly 15 to 30 works per grade—far more than many expected—including novels, plays, poems, and shorter historical texts such as presidential speeches and founding documents. That scope came as a surprise, since the State Board of Education had asked the agency only to identify “at least one literary work” per grade. The selections lean heavily on classic literature and are organized into optional groupings, pairing anchor texts—often full books—with shorter literary and historical works to build knowledge and context.

In an interview last week, Texas education commissioner Mike Morath reminded me that the Texas Constitution charges the state with promoting “a general diffusion of knowledge.” It is a striking phrase—at once modest and demanding. The framers did not speak of skills, competencies, or dispositions. They spoke of knowledge and of the need for it to be broadly shared.

In this respect, those 19th-century statesmen turned out to be fair—if accidental—cognitive scientists. Long before anyone spoke of background knowledge, schema, or cognitive load, they hit upon a foundational truth about literacy: Language proficiency depends on access to a common stock of knowledge that writers assume and readers recognize. Comprehension is not a content-neutral “skill” that can be reduced to decoding symbols on a page and finding the main idea. It’s a sense-making process that rests to an extraordinary degree on references, idioms, allusions, and stories that are common and broadly shared among the literate.

That insight helps explain why Texas, alone among states, has taken the unusual step of proposing a specific, statewide list of literary works—books, plays, poems, speeches, and stories that all students would be expected to encounter over the course of K–12 schooling. The list is not an attempt to freeze culture in place or settle arguments about the canon once and for all. It’s honest about what literacy actually requires: not exposure to print in the abstract, but familiarity with the texts and traditions that enrich, inform, and structure the English language.

An essay on my Substack by my AEI colleague Annika Hernandez anticipates—and answers—many of the objections now being leveled against the Texas list. As she observes, “Many educators have forgotten that, no less than history and science, English class exists to deliver a body of knowledge: specifically, knowledge of the literary canon” [emphasis mine].

Of course, for some the word canon itself is a provocation. Hernandez’s point—and Texas’s—is not about canon-making as an exercise in reverence or exclusion. It can be understood as curation. These are the works literate speakers and writers know, draw upon, and assume their listeners and readers know, too. To decline to teach them is not an act of humility or inclusion; it is to deny students access to the shared references and background knowledge that make language intelligible in the first place. Hernandez puts it well: “An educated person is expected to know what ‘to be or not to be’ means and where it comes from. We might think that’s unfair, but we cannot wish it away.”

The current controversy over Texas’s reading list reprises the arguments over its 2024 Bluebonnet curriculum. Then as now, critics objected, most particularly, to the inclusion of biblical stories, which the state planned to teach explicitly as literature and cultural source material. The charge was that the curriculum was “Bible-infused,” as if this were an evangelization attempt rather than a linguistic reality. Of course it’s “Bible-infused,” I argued at the time. So is English. Our language is saturated with biblical idioms and references (as well as references to Greek and Roman myths, Shakespeare, and classic literature) not because anyone decreed or imposed it, but because centuries of common usage made it so.

This is the point that is too often missed in debates like these. Language is not a moral project. It doesn’t bend to our will and it cares not one bit for our politics. We don’t get to vote on which allusions, idioms, metaphors, or background knowledge gain traction. Usage decides. Unconsciously, writers assume what readers know, not what curriculum designers wish they knew. Schools can pretend otherwise, but students—particularly low-income and minority students—pay the price when they encounter texts that assume knowledge they were never taught because it made someone in a position of power uncomfortable—or worse, because they thought they were helping, honoring, or elevating them by demanding “representation.”

This goes a long way to explain why Texas, at the moment, is more clear-eyed about language proficiency than any other state. Rather than treating literacy as a collection of transferable skills, Texas has begun to treat it as what it actually is: a knowledge-dependent capacity that grows through sustained exposure to shared content. That clarity has led the state to make choices—naming texts, sequencing knowledge, and insisting that some things be commonly taught—that inevitably run afoul of long-standing education homilies from both the left and the right about local control, personalization, child-centered pedagogy, and content neutrality.

The backlash is predictable. A curriculum that names what students should know will always be criticized for what it leaves out. But refusing to name content is not a neutral act. It simply shifts the burden of acquiring cultural and linguistic knowledge away from schools and onto families—rewarding those who can supply it at home and penalizing those who cannot.

In the final analysis, then, the debate over Texas’s reading list is not about religion or ideology. It is about whether schools are willing to acknowledge an uncomfortable truth: literacy requires shared knowledge, and shared knowledge requires choices. Those choices will never satisfy everyone. But refusing to make them carries a cost and, frankly, an inequitable one—borne disproportionately by students who depend on schools to provide what others acquire by chance.

If the state is serious about its constitutional duty to diffuse knowledge broadly, it must be willing to say what that knowledge is—and to ensure that students who don’t get it at home still get it somewhere.

The question is not whether Texas’s list is perfect. It is whether it is better than the alternative.

And the alternative—a curriculum that names no texts, assumes no common ground, and leaves cultural literacy to chance—has already failed too many students to recommend itself again.


Policy Priority:
High Expectations
Topics:
Evidence-Based Learning
Curriculum & Instruction
Governance
Teachers & School Leaders
Meredith Coffey, Ph.D.
2.5.2026
Student taking a test
Getty Images/Carlos Barquero Perez
Listen to this article
Loading the Elevenlabs Text to Speech AudioNative Player...

When high schoolers pass Advanced Placement (AP) exams, they can earn college credits, making them more likely to complete college within four years and likely increasing their earnings in adulthood. Fees of $99 per exam, however, deter many students from participating. In response, both the College Board and the federal government partially subsidize fees for low-income students, and states have increasingly moved to do likewise. Evaluating the efficacy of one variation on such policies, researchers from Johns Hopkins University and George State University recently published a study examining the effects of North Carolina’s AP exam fee waiver, which covers costs for all Tarheel students taking these exams.

Drawing data from the North Carolina Education Research Data Center and the College Board, the authors used a sample of 556,514 student-AP course enrollments between 2010–11 and 2016–17. Using a quasi-experimental design called difference-in-differences, they contrasted outcomes—AP exam participation and pass rates—between the periods immediately prior to and immediately following the 2014–15 implementation of universal AP fee coverage. The researchers controlled for factors including student demographics, prior academic achievement, grade level, and subject. Districts that received a bundle of additional AP-related services during this period (such as specialized teacher training) were excluded from the study.

Among the overall population, universal fee waivers increased AP exam participation without significantly affecting the likelihood of a student earning a passing score. This suggests that the new waiver recipients were just as qualified as those previously taking the exam (if they were underqualified, presumably the pass rate would have dropped). Also encouraging: Among low-SES students, the fee waivers led to a statistically significant 3.3 percentage point increase in exam pass rates compared to otherwise similar high-SES peers.

The policy’s impact on exam pass rates varied by subject. For the AP exams that students were previously least likely to take, the waivers prompted not only greater exam participation, but also a 6 percent average increase in pass rates. Among the previously “underutilized” subjects with the biggest pass rate gains were macroeconomics and Spanish literature, both widely accepted options for college credit.

Then, to calculate the return on investment (ROI) for these waivers, the researchers divided the predicted gain in lifetime earnings from taking the exam (i.e., how much more will a student likely earn if they take the exam?) by its net cost to the state. For each state dollar spent, a waiver targeting only low-SES students would deliver $2.11 in benefits to each of those AP course enrollees, and a universal waiver would deliver $2.64 to each AP course enrollee.

Ultimately, the study’s authors advocate a universal waiver policy. They base this recommendation on the higher ROI for the universal waiver, along with concern that a narrower policy might rely on “coarsely-defined” categories, such as low-income districts or low-participation AP exams, and would therefore miss many students who would otherwise benefit.

Still, skeptics might wonder whether states would nonetheless be better served by targeting waivers toward economically disadvantaged populations. When it comes to ROI, for example, is it really a worthy use of taxpayer dollars to boost the lifetime earnings of students who aren’t low-SES? And while it’s true that a poorly targeted policy would miss many students, most states with AP waiver policies seem to target individual students effectively, relying on free and reduced-price lunch eligibility, USDA low-income thresholds, residence in federally subsidized public housing, and similar designations.

Whether states want to invest in waivers for all their students remains an open question, and one that leaders will need to grapple with—including in North Carolina itself, where legislators have recently proposed such a revision to their current policy. But what’s clear from the findings is that fee waivers give low-SES students greater opportunity to prove what they’ve learned: With waivers, they not only take AP exams at higher rates, but they also pass them at higher rates compared to their more advantaged peers. That’s validation for the 19 states (and the District of Columbia) that already fully cover AP exam fees for low-SES public school students, and it should be a nudge to the other 31.

SOURCE: Md Twfiqur Rahman and M. Cade Lawson, “Removing Barriers to College Credits: Where and for Whom AP Exam Fee Waivers Work,” Annenberg Institute at Brown University (November 2025).

Policy Priority:
High Expectations
Topics:
Evidence-Based Learning
Governance
Alicia Anderson
2.5.2026
Chalkboard line graph
Listen to this article
Loading the Elevenlabs Text to Speech AudioNative Player...

A steady stream of recent research has reported on the pandemic’s disparate effects on education. Unsurprisingly, lost learning time hurt children, particularly those who needed the most support. A December 2025 Brookings study by Lauren Bauer and Eileen Powell is among the first to look specifically at the learning impacts based on grade level at the time of the disruption. Their results may come as a surprise.

When schools shut down in spring 2020, older students presumably had greater reading fluency and technology skills compared to younger cohorts. In theory, this might make them better prepared to continue learning during the disruption. A teacher might check in on Zoom, then send the kids over to Khan Academy for a math video, then on to IXL for practice problems. It’s easier to prescribe this computer-based work to a 12-year-old than to a kindergartener who can’t read and is trying independently to navigate a digital learning platform.

The researchers track student cohorts based on 2019–20 grade level, following their proficiency rates on state standardized tests. For example, fourth graders in 2019–20 are followed as fifth, sixth, seventh, and eighth graders. Their proficiency rates are compared to pre-pandemic cohorts at the same point in their education. Students in fourth through seventh grade as of spring 2020 have both pre- and post-pandemic data to compare against the pre-pandemic cohorts. Younger students have only post-pandemic data, which are compared to the pre-pandemic benchmarks. The authors focus on proficiency data through eighth grade in 28 states selected due to their consistent standardized tests from 2015–16 to 2024–25.

The results reveal a clear pattern: Older students have struggled more to recover from learning loss, especially in math.

When testing resumed in the spring of 2021, all cohorts showed big drops. In math, proficiency was about 9 percentage points below pre-pandemic levels. In the following years, results diverged: The older the student in 2019–20, the more persistent the learning loss. By 2025, the youngest kids—in preschool through second grade in 2019–20—were at or close to pre-pandemic proficiency levels. Pandemic third graders showed similar initial gaps in their first round of standardized testing (grade 4, 2021) but rebounded to match the pre-pandemic cohorts by eighth grade.

Meanwhile, the older elementary and middle school students never fully caught up. Pandemic fourth graders tested above the pre-pandemic average proficiency rates in 2019 (52 percent) but dropped to 36 percent in fifth grade, remaining below pre-pandemic cohorts as eighth graders. Differences in English proficiency rates are not as extreme as in math, narrowing between cohorts by the end of middle school but still below the pre-pandemic average for the pandemic fourth through seventh graders.

Younger students had more time between the initial disruption and eighth grade testing, perhaps explaining the divergent results. This explanation, however, does not change the fact that pandemic fourth through seventh graders finished middle school with lower proficiency rates than their pre-pandemic peers.

The data support what a lot of teachers already know: Those pandemic fourth graders are now high school sophomores, and many are missing critical foundational skills, especially in math. National data confirm the trend observed in the Brookings study of statewide tests—this cohort scored 8 points below 2019 levels on the 2024 NAEP in eighth grade math. The pattern also matches observations from university professors like those at UCSD, who say many college students lack middle school-level math skills. Coupled with the elimination of standardized testing for admissions, universities should expect at least a few more years of remedial courses.

The better news? Students who were younger during the pandemic seem to be making up for the lost learning time. But for high schools, the message for teachers is clear: Don’t assume students learned the basics, and be prepared to look back several years to fill in the gaps.

SOURCE: Lauren Bauer and Eileen Powell, "Learning Curves: Post-COVID Learning Trajectories Differ by the Grade a Student Was in When the Pandemic Hit," Brookings, December 8, 2025.

Policy Priority:
High Expectations
Topics:
Curriculum & Instruction
Teachers & School Leaders
Jeff Murray
2.4.2026
Gadfly Bites logo
Listen to this article
Loading the Elevenlabs Text to Speech AudioNative Player...

News stories featured in Gadfly Bites may require a paid subscription to read in full. Just sayin’.

Not sure how it came together like this, but all four of our very separate clips today fall into my “Well Duh” category of news. Sometimes the Bites write themselves*

  1. Tim Miller, currently a member of the Ohio Excels board and formerly a member of the Akron City Schools Board of Education and the State Board of Education, opined on Senate Bill 19 yesterday, arguing that teacher candidates who can’t demonstrate math competency shouldn’t teach math to students. Well, duh. (Akron Beacon Journal, 2/3/26)
     
  2. It will probably not be news to you that some teenagers don’t like bans on smartphone use in their schools, although at least one of the reasons cited here does seem fairly idiosyncratic. (The Exponent, 2/4/26)

  3. It will also not surprise you to know that the elected school board that actually runs Youngstown City Schools (yes, they do) is fully supportive of proposed legislation to release the district from the Academic Distress Commission oversight to which they are (nominally) subject due to decades of unremitting academic suckitude. They do not support it because their kids are doing better—they are not, and the district remains unable to reach a majority of the goals they themselves set in order to demonstrate improvement—but because they feel that Youngstown shouldn’t be the only one left in that status, no matter how the kids are doing. So what is the means by which they can finally achieve their goal of sweeping their academic suckitude under the rug for good? “It’s a super simple bill,” says state Representative Lauren McNally of the legislation. It would just “remove every mention of academic distress commissions from Ohio law.” How very simple indeed. (Vindy.com, 2/4/26)
     
  4. Speaking of legislation, a new bill introduced earlier this week proposes placing state education funding in escrow for districts who are using some of that funding to turn around and sue the state over the EdChoice voucher program (or any other aspect of education funding) until such legal action is completed. Personally I hope we get to hear some testimony on this one. Should be interesting stuff no matter which interested parties are talking. (Cleveland.com, 2/3/26)

*That’s not true. It always takes a lot of work. And I do it all for you.

Did you know you can have every edition of Gadfly Bites sent directly to your Inbox? Subscribe by clicking here.

Policy Priority:
School Funding
Topics:
Governance
Aaron Churchill
2.3.2026
school funding fact vs fiction blog image
Getty Images/memoangeles
Listen to this article
Loading the Elevenlabs Text to Speech AudioNative Player...

Recent media coverage leaves an impression that Ohio public schools are being shortchanged. The Parma City Schools superintendent recently told the press, “We continue to lose money and costs to operate the district continue to rise.” One news reporter wrote: “Public schools are being forced to operate under a new reality after steep cuts in state and federal cuts in school funding.” Sensationalist headline writers have used words like “devastating” and “terrifying” to characterize funding concerns. Big-city news outlets have recently covered the multimillion-dollar budget holes facing districts such as Columbus, Cleveland, and Toledo.

But is the fiscal situation for schools all doom and gloom? Not quite. Consider the following facts:

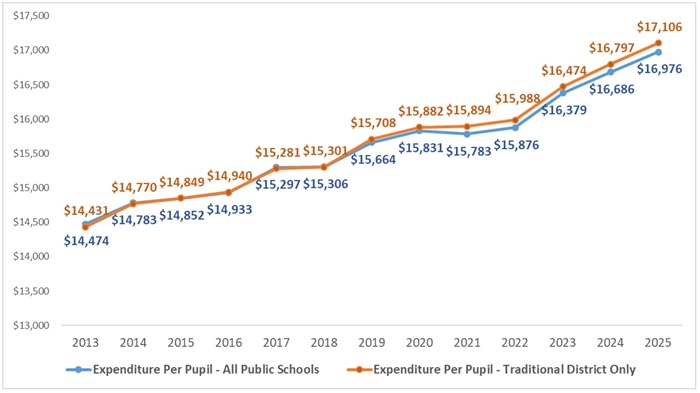
1. Public school expenditures have reached record levels, with spending increases outstripping inflation. After adjusting for inflation (including the Biden-era price spike), statewide public school spending has climbed from roughly $14,500 to $17,000 per pupil between 2013 and 2025—an increase of 17.3 percent. During this twelve-year period, traditional districts registered slightly higher spending increases (18.5 percent) than public charter schools and career-tech centers, a.k.a., JVSDs. Thanks to the state’s longstanding commitment to funding education, along with federal supplements, public schools have received increases that have more than covered the rising cost of doing business.  

Figure 1: Ohio’s inflation-adjusted expenditures per pupil, FY13 to FY25

School funding fact vs fiction blog figure 1
Source: Ohio Department of Education and Workforce, “Expanded List” files. Note: The blue line represents inflation-adjusted (CPI-U) expenditures per pupil for all public schools: traditional district, public charter/STEM schools, and joint-vocational school districts (JVSD). The orange line shows inflation-adjusted expenditures per pupil for traditional districts only. Spending amounts reflect dollars received through state, local, federal, and non-tax sources. The chart does not include capital outlay (e.g., construction and debt service).

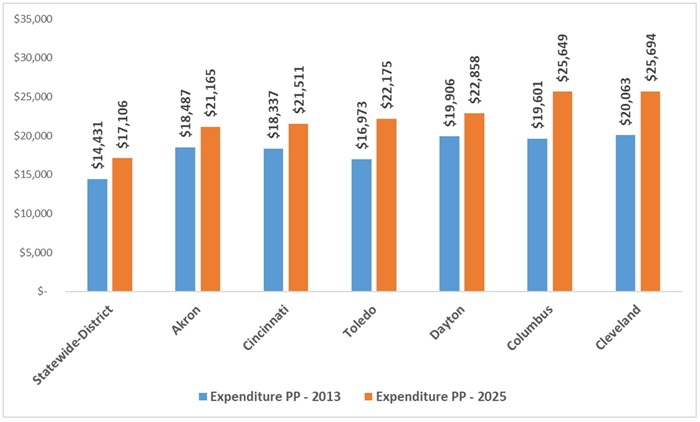
2. Spending in Ohio’s large urban districts tops the state average, and their spending increases have also outpaced inflation. One common claim is that urban districts are chronically underfunded. But this is more myth than reality for Ohio’s big-city school districts. Figure 2 shows that Akron, Cincinnati, Dayton, and Toledo all spent more than $20,000 per pupil in 2025—more than $3,000 per pupil above the state average. In Cleveland and Columbus, spending topped $25,000 per pupil. These figures exceed the statewide average by a range of 21 percent in Cincinnati to 37 percent in Columbus. Consistent with the statewide trend, spending increases in the big urban districts have also risen at a faster rate than inflation. For instance, Cleveland, Columbus, and Toledo all spent $5,000 per pupil more in FY25 than they did in FY13, an even larger increase than the statewide average increase of $2,675 per pupil.

Figure 2: Large urban districts’ expenditures per pupil versus statewide, FY13 and FY25

School funding fact vs fiction blog figure 2
Source: Ohio Department of Education and Workforce, “Expanded List” files. Note: FY13 expenditures per pupil were adjusted for inflation to 2025 dollars using CPI-U.

3. State aid for public schools is up again this year. Another oft-repeated claim, typically from pundits on the left, is that the state legislature aggressively cut public school funding by putting the brakes on the Cupp-Patterson plan last year. But the numbers don’t support that contention, either. The table below shows that state spending on public schools is up by nearly $187 million compared to last year. Public charter schools and JVSDs receive larger bumps, which is partly explained by their increasing enrollment. Traditional districts in the aggregate receive smaller increases.[1] This is driven by enrollment losses and their soaring local property values—a topic discussed below—which in turn reduces districts’ state funding prescriptions under the Cupp-Patterson model. To be sure, these increases are more modest than what some education advocates had hoped for—who doesn’t dream about more money?—but the fact remains that state funding for public schools is up yet again.

Table 1: State funding for Ohio public schools, FY25 to FY26

School funding fact vs fiction blog table 1
Source: Ohio Department of Education and Workforce, Statement of Settlement reports (June 2025 and January 2026). Note: The amounts shown here include state foundation funding, but exclude state-funded property tax reimbursements, school construction funds, and other smaller funding streams. For both years, charter/STEM funding includes per-pupil facilities aid, equity supplements, and high-quality dollars. None of these amounts include local funds (including a state-required minimum 2 percent property tax) or federal dollars.  

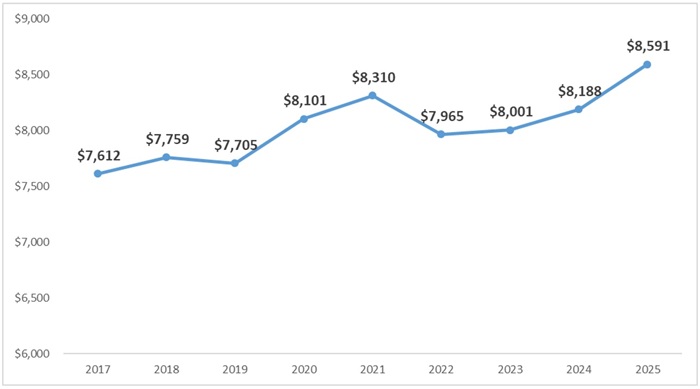
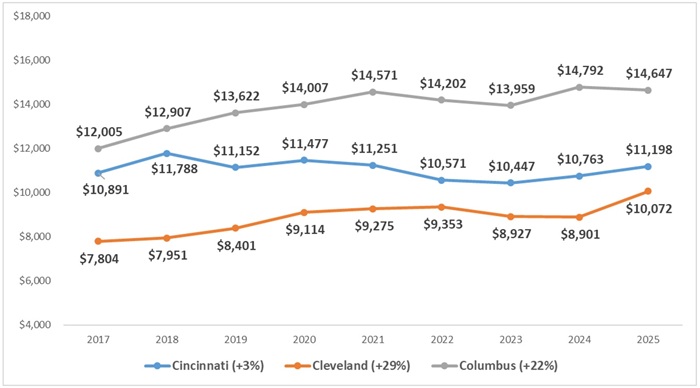
4. School districts’ local tax revenues have risen over the past decade. Funding Ohio schools has long been a joint responsibility of the state government and local districts. The local portion includes a state-required 2 percent property tax, as well as optional taxes that districts levy with voter approval. Widespread increases in property values have helped pushed districts’ local revenues upward at a rate exceeding inflation. In real dollars, statewide local revenue per pupil rose by nearly $1,000 per pupil, or 13 percent, between 2017 and 2025. As Figure 4 indicates, the local revenues of two of Ohio’s three largest urban districts increased at a faster clip than the statewide average: Columbus and Cleveland’s local revenues  per pupil are up 22 and 29 percent, respectively.[2]

With money pouring into districts through property taxes—and citizens voicing concerns about their tax bills—state lawmakers recently enacted new guardrails and transparency measures that protect taxpayers from sticker shock. To help districts navigate these changes, the legislature approved more than $450 million in one-time state funding that will be distributed in FY27 and FY28. Districts’ local revenues will likely grow at more moderate rates moving forward, but that comes after many years of plenitude. 

Figure 3: Inflation-adjusted local revenue per pupil, all Ohio districts, FY17 to FY25

School funding fact vs fiction blog figure 3
Source: Ohio Department of Education and Workforce, “Expenditure Rankings” files. Note: FY17 serves as baseline for the analysis based on data availability.

Figure 4: Inflation-adjusted local revenue per pupil, selected districts, FY17 to FY25

school funding fact vs fiction blog figure 4
Note: The percentage shown in parentheses indicates the percentage change in local revenues per pupil between FY17 and FY25.

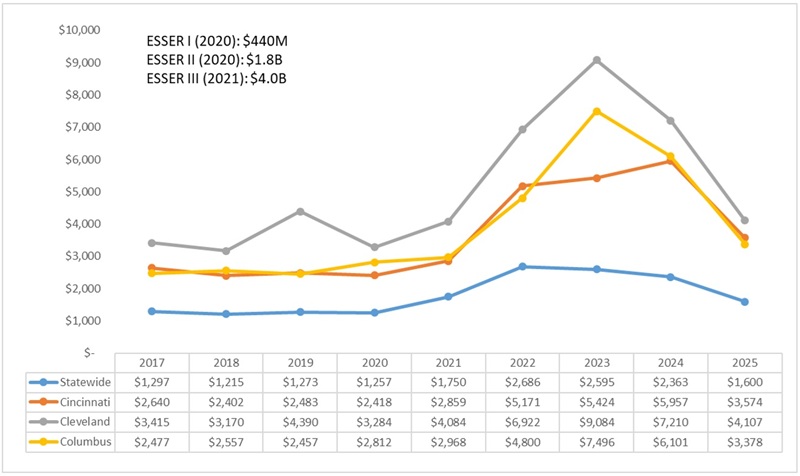
5. Federal aid spiked with an influx of emergency Covid-relief dollars but is returning to normal levels. If state and local funding are both up, why are schools feeling squeezed? One possibility is that districts have cost-containment issues, meaning expenditures are growing at a faster clip than their (increasing) revenues. If that’s happening, the focus should be on managing costs. But another factor is the end of the multibillion dollar federal emergency program, known as ESSER, that sought to assist schools during and after the pandemic. Figure 5 shows the sharp increase in federal revenues due to the influx of ESSER funds, especially in high-poverty districts, such as Cleveland and Columbus, that received the bulk of these dollars. With ESSER sunsetting over the past couple years, federal revenues have largely returned to pre-pandemic levels. We all warned that the federal tap would not remain open forever, and now we’re seeing a tough but necessary budget reset due to the expiration of ESSER.

Figure 5: Inflation-adjusted federal revenue per pupil, statewide and selected districts, FY17 to FY25

school funding fact vs fiction blog figure 5
Source: Ohio Department of Education and Workforce, “Expenditure Rankings” files. Note: States, and in turn schools, received Elementary and Secondary School Emergency Relief (ESSER) funds in three portions based on federal legislation passed in 2020 and 2021. The ESSER amounts shown above represent Ohio’s allotments.

* * *

Fact-based analyses reveal an outlook for Ohio public schools that’s not nearly as grim as what’s being offered by the doomsdayers typically quoted in the media. Yes, leaner times may be ahead for schools after the inflation-juiced, pandemic-era largesse. But it also seems likely, based on historical patterns, that Ohioans will continue to recognize the importance of education and maintain their generous investments in public schools. That is the version of the story that should also be told.


[1] There is variation across districts in their state funding this year versus last: 464 districts receive more state aid per pupil in FY26 (ranging from $1 to $1,849 per pupil increases), while 143 districts receive less state aid per pupil in FY26 (ranging from -$1 to -$647 per pupil decreases).

[2] Public charter and STEM schools receive almost no local taxpayer funds, which explains the larger state funding amounts they receive compared to traditional districts.

Policy Priority:
School Funding
Topics:
School Finance
Jessica Poiner
2.2.2026
Attendance coaches blog image
Getty Images/mediaphotos
Listen to this article
Loading the Elevenlabs Text to Speech AudioNative Player...

Ohio kids have recently missed quite a few days of school courtesy of abundant snow and frigid temperatures. For most, this brief time away won’t have a significant academic impact. Delaying lessons about foreshadowing or the slope of a line for a few days of sledding or hunkering down to watch movies isn’t a crisis. But for students who are already chronically absent, additional missed time could be.

Chronic absenteeism, which is defined as missing at least 10 percent of instructional time for any reason, can have a massive impact on academic outcomes. Students who have never been chronically absent are six times more likely to read on grade level by the end of third grade and nine times more likely to graduate from high school on time. Being chronically absent, meanwhile, can negatively impact both academic and social-emotional development. Recovering from pandemic era learning loss, boosting reading and math scores, and improving school quality all hinge on regular student attendance. And yet, according to state report cards, a fourth of Ohio students—roughly 400,000 kids—were chronically absent last year. Thousands more didn’t meet the chronic absenteeism threshold but still missed enough school for it to have a negative impact.

To their credit, state leaders have tried to tackle the problem. In 2023, the Ohio Attendance Taskforce released a series of recommendations aimed at bolstering attendance. In 2024, the Department of Education and Workforce (DEW) published the Ohio Attendance Guide, which outlined district and school practices for early intervention. That same year, Ohio joined more than a dozen other states in pledging to cut chronic absenteeism by half. So far, though, these efforts haven’t moved the needle. The statewide chronic absenteeism rate has improved by fewer than 2 percentage points over the last two years. In some districts, the numbers have actually gotten worse.

Part of the reason why state-level efforts aren’t moving the needle is that attendance is largely a local issue. There are common root causes that can be addressed by state policy, such as poor transportation or parental misconceptions about the importance of regular attendance. But absenteeism causes vary widely from student to student, and some kids have more than one reason for why they have trouble getting to school. State policy can’t and shouldn’t try to address thousands of unique situations. What state policy can do, though, is invest in innovative ideas that will help schools address students’ unique circumstances.

Connecticut offers a solid example. In the spring of 2021, state leaders launched a home-visit initiative called the Learner Engagement and Attendance Program (LEAP). Its primary goal was to address student absenteeism and disengagement by directly connecting with families. As part of the program, 15 high-need districts were provided with funding to pay for school staff and community organizers to visit nearly 8,700 chronically absent students in their homes. A mixed-methods evaluation conducted by the Center for Connecticut Education Research Collaboration indicates that the program had a meaningful impact. For most students, attendance rates increased by 4 percentage points in the month immediately following their first LEAP visit. In subsequent months, attendance rates continued to rise and reached an average increase of roughly 7 percentage points for students served in the summer of 2021 and nearly 15 percentage points for students served during the 2021–22 school year.

Connecticut is a much smaller state than Ohio, with 202 districts and roughly 513,000 public school students compared to Ohio’s 611 districts and nearly 1.7 million students. Connecticut also used federal Covid-relief dollars to fund LEAP,[1] which isn’t an option for Ohio, as those funds are now expired. But these differences don’t mean that the Buckeye State can’t create a similar program. Connecticut’s initial investment was limited to just twelve districts and only cost roughly $10 million. Ohio could follow suit by establishing a pilot project that limits participation to a small number of districts until there’s proof of success. Asking districts to apply if they’re interested, rather than forcing them to participate, would ensure local buy-in. And closely tracking chronic absenteeism rates among all applicants—districts that were accepted into the pilot, as well as those that weren’t—would allow for a genuine evaluation of the program’s effectiveness.

Another innovative way for state leaders to combat chronic absenteeism is by investing in attendance coaches. Similar to the home-visit proposal outlined above, state leaders could establish a pilot program that invites interested districts to apply for a state-funded attendance coach to work in their district. Coaches could collaborate with district and school administrators to analyze real-time data, evaluate current prevention and intervention efforts, identify ways to improve, and train staff on effective implementation. They could support teachers by managing communication with the families of chronically absent students, thereby freeing up teachers’ time to focus on teaching and learning. They could also support students by building relationships with those who are frequently absent, identifying the root causes of their attendance issues, and working alongside them and their families to solve problems.

Investing in attendance coaches is a particularly intriguing idea because state and local leaders are already familiar with the model. As part of Ohio’s early literacy efforts, DEW has sent nearly 100 literacy coaches into more than 100 schools to support educators as they implement the science of reading. During a public meeting last summer, officials from DEW noted that the number of sessions and time spent on coaching activities were “positively associated with increases in student achievement scores over time.” These positive results are likely why lawmakers opted to allocate an additional $24 million to literacy coaching on top of the initial $18 million investment. If state officials believe that reading coaches are boosting reading achievement, then why not try using attendance coaches to boost attendance?

Investing in attendance coaches also dovetails nicely with a recent overhaul of Ohio’s absenteeism policies. These changes were made after districts and schools reported dedicating “a significant amount of staff hours and resources” to implement previous state requirements. Ohio leaders were right to repeal burdensome requirements and leave intervention efforts up to districts. But there are plenty of schools that are going to need support to get it right. Providing the opportunity to work with an attendance coach could help.

***

Small-scale pilot programs aren’t as dramatic or headline-catching as sweeping statewide initiatives. But investing in these two pilots—a home-visit program and an attendance coach initiative—would give Ohio a chance to test innovative solutions without breaking the bank. The state’s current efforts clearly aren’t working. Now is the time to try something different—and these two programs would be a great place to start.


[1] Initially, Connecticut designated just over $10 million in federal Covid-relief funding to support these 15 districts. State lawmakers went on to appropriate additional funds—$7 million in 2022 and another $7 million in 2023—to sustain operations through December 2026.

Policy Priority:
Standards & Accountability
Topics:
Governance
Jeff Murray
2.2.2026
Gadfly Bites logo
Listen to this article
Loading the Elevenlabs Text to Speech AudioNative Player...

News stories featured in Gadfly Bites may require a paid subscription to read in full. Just sayin’.

  1. Fordham’s Aaron Churchill is quoted far-too-briefly in this far-too-long treatise on the history of Academic Distress Commission-based turnaround efforts in Ohio. “Our students in every part of the state deserve a great education,” Aaron tells Cleveland.com, putting the focus of improvement efforts—purely and simply—where they belong. “They deserve an education where they can graduate high school proficient in math and reading. And right now that is not happening in some of the districts in our state. I think that additional pressure from the state and oversight from the state can really help make sure students are getting what they deserve.” Everything else in here is trying—and failing—to let Youngstown City Schools off the hook from having to meet the improvement benchmarks they set for themselves and continue to fail to meet. (Cleveland.com, 2/1/26)
     
  2. A May 2025 blog post from Fordham’s Chad Aldis is quoted in this Ideastream report regarding the large number of school buildings soon to be vacated in Cleveland Metropolitan School District. Chad’s piece decries the past efforts of numerous districts across the state to flout the law that gives charter/private/STEM school operators right of first refusal to buy or rent closed district buildings. And while that admonition seems clear and direct—as does the law—I personally can sense from the district’s public comments (“CMSD has been working with the City of Cleveland and other community partners for months to look at building reuse opportunities arising from the Building Brighter Futures process,” says a CMSD spokesperson.) that any and all options to thwart the spirit—if not the letter—of that law are on the table right now. And I swear that the second I hear the local “port authority” is involved, I will throw something and scream so loudly you will hear it wherever you are. (Ideastream Public Media, 1/30/26)
     
  3. Very fittingly, here’s a laudatory look at Breakthrough Schools’ brand spankin’ new gym facility at its Woodland Hills campus on Cleveland’s east side. This is a perfect example of how a charter school can buy a closed CMSD school building and revitalize its ongoing purpose to serve students academically, while also expanding community connections since the gym will also be available for public use when school is out. Kudos! Additionally, for those of you whose own schools were closed up tight all last week (and possibly today as well), note that the big public unveiling of Breakthrough’s new facility took place on January 29, undaunted by the notorious lake effect snow and cold in Cleveland. (NEOtrans Blog, 1/31/26)

Did you know you can have every edition of Gadfly Bites sent directly to your Inbox? Subscribe by clicking here.

Policy Priority:
School Funding
Topics:
Governance
Chad L. Aldis
1.30.2026
Why this public school dad supports school choice blog image
Getty Images/EtiAmmos
Listen to this article
Loading the Elevenlabs Text to Speech AudioNative Player...

The debate over school choice—especially private school choice—is often contentious. Opponents regularly insist supporters are trying to “destroy” or “privatize” public education, and advocating for more options is seen as an attack on public schools.

But I’ve never seen it that way, and I certainly don’t support school choice because I’m anti-public school. I grew up attending public schools, and they helped me become the first person in my family to go to college. My children attended public schools, too. I’ve seen public schools at their best, and I know firsthand the incredible difference a great public school can make for kids and families.

And yet, I support the full range of school choice options—magnet schools, interdistrict open enrollment, public charter schools, private schools, and homeschooling. Not because I want to dismantle public education, but because I believe in a simple principle: Parents should be able to find the school that works best for their child without needing luck, money, or a real estate agent to make it happen.

Since it’s National School Choice Week, this seems like the right time to explain why I support it—especially as someone who believes deeply in public education. My support for school choice didn’t begin as a policy debate or a political campaign. It began in a kindergarten classroom, when I realized my son wasn’t getting what he needed.

How I became a school choice supporter

When I graduated from law school, I was saddled with significant student loan debt. After an extensive search, my wife and I bought a modest starter home in a growing part of Tallahassee that was low- to middle-income and had a highly-rated public school. We were confident our son would have access to a strong education.

After an incredible Montessori preschool experience, our son entered kindergarten eager and ready to learn. But it quickly became clear that something wasn’t right. The classroom didn’t have much for him academically, and instead of receiving instruction that matched where he was, he was often put off to the side. He spent large portions of the day coloring pictures.

As a result, he very quickly came to dislike school. He found it boring and started to disengage, and it was heartbreaking to watch. We worked with the school and advocated for him, but it became clear that the mismatch wasn’t going away.

The unspoken but widely exercised form of school choice

We didn’t have an easy way to choose a different school while staying in our neighborhood. So we did what many families do to access a better school—even if they don’t think of it as school choice. We moved. We sold our house just before Christmas and rented an apartment on the other side of Tallahassee, where we knew the schools were stronger.

When the second semester started, the difference was immediate. My son was assigned to a reading group even though he was still in kindergarten, and he finally started to receive instruction that matched his ability and interest. His learning took off.

By the end of kindergarten, he had read the first Harry Potter book. That didn’t happen because he suddenly became smarter in January, and it didn’t happen because I somehow became a better parent halfway through the school year. It happened because he was finally in a school that met him where he was and helped him keep growing.

A lifelong lesson

That experience changed me. It made something painfully obvious: Families shouldn’t have to sell their house and move just to find a school that works for their child. My family was fortunate. We were able to move, even though it was difficult and disruptive. But millions of families don’t have that option, especially in the middle of a school year.

The part that has stayed with me most is the honest reflection that my child is no more deserving of a high-quality education than anyone else’s. But because I was able to complete a real estate transaction, he gained access to a school that worked better for him. That’s not fairness, and it’s not how opportunity should work in a country that rightly values equal opportunity for all kids.

Why I’ll keep supporting school choice

I support school choice because my personal experience has shown me what happens when meaningful options are limited. I’ve seen how quickly a child can disengage when school becomes a place where they are merely occupying time instead of learning, and I’ve seen what can happen when parents are empowered to act.

During National School Choice Week, I’m proud to say I support school choice in all its forms—and I do so as someone who believes deeply in public education. Public schools will always be the backbone of our education system. We should invest in them and celebrate their successes. But families also deserve options when their assigned school isn’t the right fit. And remember, parents aren’t looking to “destroy” schools—they’re looking for a school that works for their child.

Policy Priority:
School Choice
Topics:
Private School Choice
Jeff Murray
1.30.2026
Ohio charter news logo
Listen to this article
Loading the Elevenlabs Text to Speech AudioNative Player...

Stories featured in Ohio Charter News Weekly may require a paid subscription to read in full.

National School Choice Week hearing in DC

Earlier this week, the United States Senate’s Health, Education, Labor, and Pensions Committee held a hearing on the topic of “Empowering Families Through Educational Choice in America”. Important and timely during National School Choice Week. It featured a strong Ohio focus, including Buckeye State senator (and long-time supporter of school choice) Jon Husted—who sits on the committee—and Cris Gulacy-Worrel, who is vice president and founding team member of Oakmont Education. Among other testimony, Gulacy-Worrel told committee members that what matters most to her is “educational plurality, a system with room for many models and many pathways to success.” Good stuff.

Meanwhile…

Coincidentally, education news outlet The 74 published a piece looking at recent math achievement scores among all public school 8th graders in the District of Columbia in 2025, finding that charter school students generally outperformed their traditional district school peers. This includes the Center City Public Charter School’s Congress Heights campus, where a majority of students are classified as low-income, and where 70 percent of 8th graders scored proficient on the Algebra I exam last year, besting some of the highest-income district schools. School staff attributed their kids’ success to co-teaching, data collection, and other factors. Awesome news!

News from West Virginia

Also worth celebrating this week: The West Virginia Supreme Court this week lifted a lower-court stay on creation of new charter schools in the Mountain State while a lawsuit against new charters in specific parts of the state works its way through the appeals system. No decision on that appeal is expected until June at the earliest.

Important new legislation

Iowa governor Kim Reynolds announced this week that she was introducing a bill that would, among other provisions, allow state education funding—in full—to follow students who move from traditional district schools to charter. Gov. Reynolds said in a press release that the legislation is intended to align per pupil funding and educational opportunities among all public school students. “As demand for public charter schools grows,” she said, “we should ensure that state funding—provided for the purpose of educating students—follows them to whatever public school they choose.”

Getting an education in Cleveland

Here’s a great profile of Ohio Wesleyan University sophomore Brianna Montgomery, who spent last summer in Cleveland, interning at the Intergenerational Schools charter network. She seemed to love the experience—using her entrepreneurial talents both to pursue community partnerships for the schools and to recruit potential students—provided via the Summer on the Cuyahoga (SOTC) program. Maybe northeast Ohio will get a new young resident when Brianna’s time at OWU ends.

*****

Did you know you can have every edition of the Ohio Charter News Weekly sent directly to your Inbox? Subscribe by clicking here.

Policy Priority:
School Choice
Topics:
Charter Schools
Lesley Muldoon
1.30.2026
Students taking a test
Getty Images/Caiaimage/Chris Ryan
Listen to this article
Loading the Elevenlabs Text to Speech AudioNative Player...

Over the next several weeks, more than 500,000 students across the country will take an updated version of the National Assessment of Educational Progress (NAEP) in math and reading, but more improvements may be on the way.

With its decades-long trendlines, cross-state comparisons, and scientific rigor, NAEP, also known as The Nation’s Report Card, is widely considered the gold standard in assessments. Put another way, it is to education leaders what the Consumer Price Index is to economists. But, like the CPI, NAEP is complex and hard to change, even when that change is a sign of progress. For example, the updated math and reading tests that today’s fourth and eighth graders are now taking are based on new frameworks that we started developing in 2018, before those fourth graders entered preschool. 

The rock solid systems underpinning NAEP have helped it earn its strong reputation. But there are several imperatives for NAEP to meet in the years ahead for it to maintain its status.

We must shorten timelines that are too long. In early 2027, we will release math and reading results for students who took the assessment in early 2026, based on updated frameworks that were revised starting in 2018 (math) and 2019 (reading). 

We must keep pace with technological advances. NAEP’s technology infrastructure was designed more than a decade ago. That was before large-scale assessment platforms became sophisticated and generative AI was widely available. Additionally, NAEP isn’t taking advantage of recent advances in data science, analytics, and visualization that make complex data more accessible to a range of audiences. 

We should provide state-level results in subjects beyond fourth and eighth grade reading and math. Demand for more state-level results also is growing. My colleagues and I often hear, “Where’s the Mississippi Miracle in civics, history, and science?” We have NAEP assessments in those subjects but release the results only at the national, not state, level. To meet minimum sample sizes for reporting state-level results, the number of students participating would need to increase tenfold. This means an extra testing burden, so we need to find creative solutions to administer NAEP while reducing staff workload and minimizing students’ time away from classroom instruction.

* * *

These are the needs. How will we address them? The National Assessment Governing Board and National Center for Education Statistics are launching a new initiative to help NAEP get the public vital information about student achievement more quickly and with more state-by-state comparisons. With support from philanthropy for rapid research and development and ways to prototype new innovations, the Next Gen NAEP project will seek to create a more agile, efficient, and useful NAEP.

Through this initiative, we hope to come up with actionable solutions to five big questions:

  • How can technology and AI speed up NAEP development and reporting timelines?
  • How can we modernize and strengthen the NAEP technology infrastructure?
  • How can NAEP data become easier to access and use?
  • What cost savings can be realized and reinvested into reporting more state-level NAEP data in subjects beyond math and reading?
  • How can we minimize burden for students, schools, and districts while reporting more state-level NAEP data?

Nationwide, assessment companies are considering the role of AI as they look for ways to bring down costs and timelines to meet demands of school systems and support the academic growth of students. It makes sense for the NAEP program to do the same. Of course, we need to do that while prioritizing and protecting NAEP’s best qualities, like its 30-plus year trend lines in reading and math, its rigorous content, and its innovative sampling design.

There is no shortage of great ideas for how to modernize NAEP. Yet ideas are insufficient when they fail to take into account operational realities. To modernize, we need to prototype and evaluate potential solutions. NAEP is too important to too many stakeholders to make too many changes too quickly or without sufficient research and development.

There are state leaders around the country who have tapped NAEP data to drive positive change and spur student learning gains. They include, for example, Carey Wright, who as state superintendent in Mississippi raised educational standards to align with NAEP standards and saw achievement rise. Alabama took a similar approach and became the first state to rebound to pre-pandemic achievement levels in math. Our goal is to make it easier for more states and districts to achieve this kind of success.

The Governing Board will lead the Next Gen NAEP effort, collaborating closely with NCES and convening stakeholders and experts to elicit their insights to propel the work. The Next Generation NAEP Advisory Committee, comprising leaders from NCES and the Governing Board; experts on NAEP, measurement, and AI; and education leaders from around the country will provide guidance throughout the year-long initiative. Education First, an education policy group, will serve as project manager, while the Institute of Design at Illinois Tech will lead the yearlong, structured design process. An independent fiscal sponsor will manage the philanthropic support and investments. There is a long history of educational foundations supporting the NAEP program: In the late 1960s, the Carnegie and Ford foundations funded the development of the first NAEP.

In September, the Governing Board and NCES released results on the Nation’s Report Card in 12th grade reading and math and eighth grade science. And, as mentioned, the 2026 NAEP is right now in the field assessing what students know and can do. NCES recently filled several roles related to work on 2026 NAEP and beyond. I'm proud of this work, as are leaders across the country and across the political spectrum who have affirmed their support for NAEP and its importance.

To me, that’s all the more reason to get to work modernizing the Nation's Report Card—not to ensure it survives, but to ensure it thrives.

Policy Priority:
High Expectations
Topics:
Accountability & Testing
Evidence-Based Learning
Governance

Pagination

  • First page « First
  • Previous page ‹ Previous
  • Page 57
  • Page 58
  • Page 59
  • Page 60
  • Current page 61
  • Page 62
  • Page 63
  • Page 64
  • Page 65
  • Next page Next ›
  • Last page Last »
Fordham Logo

© 2026 The Thomas B. Fordham Institute
Privacy Policy
Usage Agreement

National

P.O. Box 110
Burke, VA 22009

202.223.5452

[email protected]

Ohio

P.O. Box 82291
Columbus, OH 43202

614.223.1580

[email protected]

Sponsorship

130 West Second Street, Suite 410
Dayton, Ohio 45402

937.227.3368

[email protected]