Racial achievement gaps in schools are well documented and remain a significant cause of concern in education. Troubling too is that the role of socioeconomic disparities in mediating these gaps remains unresolved.
To better understand the relationship between race and socioeconomic status (SES) in producing achievement gaps, SUNY Albany's Paul L. Morgan and Eric Hengyu Hu examine two waves of data from the federal Early Childhood Longitudinal Study. Results show that a broad set of family SES factors explains a substantial portion of racial achievement gaps: between 34 and 64 percent of the Black-White gap and between 51 and 77 percent of the Hispanic-White gap, depending on the subject and grade level.
While SES accounts for much of the racial achievement disparities, closing these gaps requires a comprehensive approach, including improving school quality and supporting family stability. As essential steps toward equity, the authors recommend investments in early childhood education and income supplements, such as expanding child tax credits.
Download Explaining Achievement Gaps: The Role of Socioeconomic Factors or read the full report below.
Foreword
By Michael J. Petrilli
In 2004, superstar economists Roland Fryer and Steven Levitt published a seminal paper, Understanding the Black-White Test Score Gap in the First Two Years of School. Using then-brand-new data from the federal Early Childhood Longitudinal Study, Kindergarten Class of 1998–1999 (ECLS-K), they found:
In stark contrast to earlier studies, the Black-White test score gap among incoming kindergartners disappears when we control for a small number of covariates. Real gains by Black children in recent cohorts appear to play an important role in explaining the differences between our findings and earlier research. The availability of better covariates also contributes. Over the first two years of school, however, Blacks lose substantial ground relative to other races. There is suggestive evidence that differences in school quality may be an important part of the explanation.
To say the findings were “mixed” dramatically underplays how good the good news was and how bad the bad news was.
The good news was twofold. First, as the authors wrote, Black kindergarteners at the time were making strong gains over previous cohorts. Indeed, child poverty dropped dramatically in the 1990s, particularly for Black children, and this was showing up in stronger readiness for school.
It was also good news—great, actually—that Fryer and Levitt could completely erase the racial achievement gap when controlling for “a small number of covariates.” These included some traditional measures of socioeconomic status (SES), such as family income and parental education levels, but also health-related factors, such as the child’s birthweight and births to teenage moms.
These findings are hugely consequential for America’s longstanding debates around racial inequality. They directly rebut the hateful arguments of white supremacists who posit that achievement gaps are a sign of Black Americans’ genetic inferiority. And they throw cold water on the claims by some on the far left that bigotry and racism in schools are at the heart of all racial disparities in student achievement in the U.S.
Instead, the explanation for racial achievement gaps is much more straightforward, though still tragic: The vast racial disparities in socioeconomic conditions and prenatal and early-life health experiences explain the achievement gaps we see between racial and ethnic groups, at least at school entry. That suggests, per the Fryer and Levitt analysis, that universal, race-neutral interventions designed to improve the academic, social, economic, and health conditions of the poor would lift all boats and would also narrow racial gaps. (Not that those interventions are easy or always obvious.)
But the bad news was really bad, too. Namely, once children entered school, Black students started losing ground, likely because the schools they attended were lower quality than the ones attended by White students, even after controlling for SES. Changing that fact has, of course, been a major focus of education reform.
That was twenty years ago, and those of us at the Thomas B. Fordham Institute were curious to see if anything had changed. We knew that racial achievement gaps had continued to narrow until the early to mid-2010s. And we knew that the federal government had released a newer ECLS dataset, the ECLS-K: 2011. We wondered: Had the relationship between socioeconomic achievement gaps and racial/ethnic achievement gaps shifted? Was the Black-White gap still growing during elementary school? And how did all of this look for the White-Hispanic gap (also explored by Fryer and Levitt) and for subjects beyond just reading and math?
To find out, we turned to SUNY Albany's Paul Morgan. Paul is one of the nation’s leading scholars on disparities in education and health care. He’s made a career out of shaking up conventional wisdom—for example, finding that Black students are actually less likely to be identified for many disability conditions (like specific learning disabilities) in analyses controlling for academic achievement. He understood the complex relationships between the variables we were interested in, plus had a great deal of experience with the ECLS data.
He worked with Eric Hengyu Hu, an education policy and postdoctoral researcher experienced in analyzing the two ECLS datasets. They got to work, diving into the data from the older and newer ECLS-K datasets. What they found was largely consistent with Fryer and Levitt’s study, although they were able to add some new understandings, as well.
Key Findings
At the heart of Hu and Morgan’s study is a set of “SES-Plus” variables.
Table F-1. Family SES measures included in the study
|
Parent Background |
Mother’s education background |
|
Father’s education background |
|
|
Mother’s occupation prestige |
|
|
Father’s occupation prestige |
|
|
Family finances |
Household income |
|
Household Structure |
Whom child lives with |
|
Household Opportunity Factors |
Cognitive stimulation |
|
Emergent literacy activities |
|
|
Parent-child activities |
|
|
Family rules for TV |
|
|
Parental warmth |
Since we were most interested in understanding the relationship between socioeconomic status and racial achievement gaps, Hu and Morgan did not look at health-related covariates, such as child’s weight at birth, or the age of the mother at first child’s birth, which Fryer and Levitt had included. As a result, the racial achievement gap did not “disappear,” as it had for Fryer and Levitt. But it did decrease significantly, just by controlling for the “SES-plus” factors.
Here’s what they found. (See the main body of the study for more details.)
Finding 1: Taken together, family SES+ factors explain between 34 and 64 percent of the Black-White achievement gap (depending on subject and grade level) and between 51 and 77 percent of the Hispanic-White achievement gap.
Figure F-1. Family SES+ explains more of the Black-White achievement gap in first grade reading than in other subjects and grade levels.
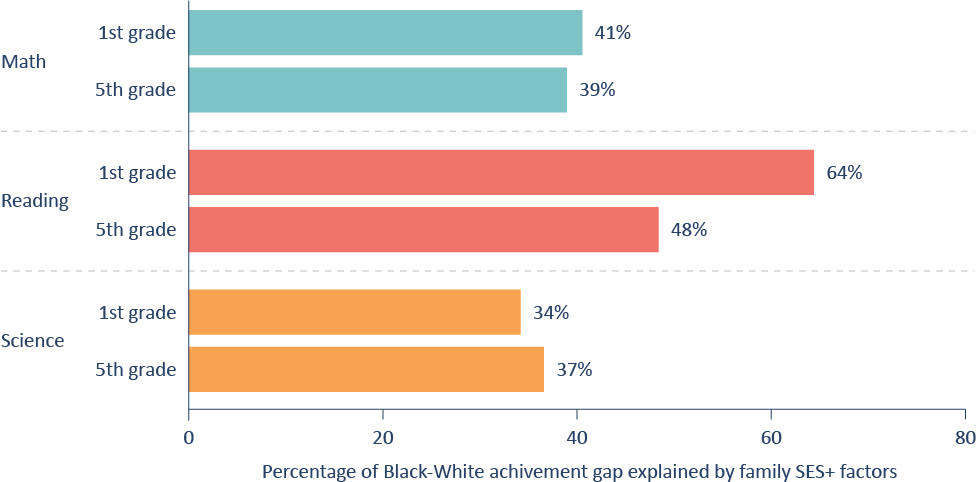
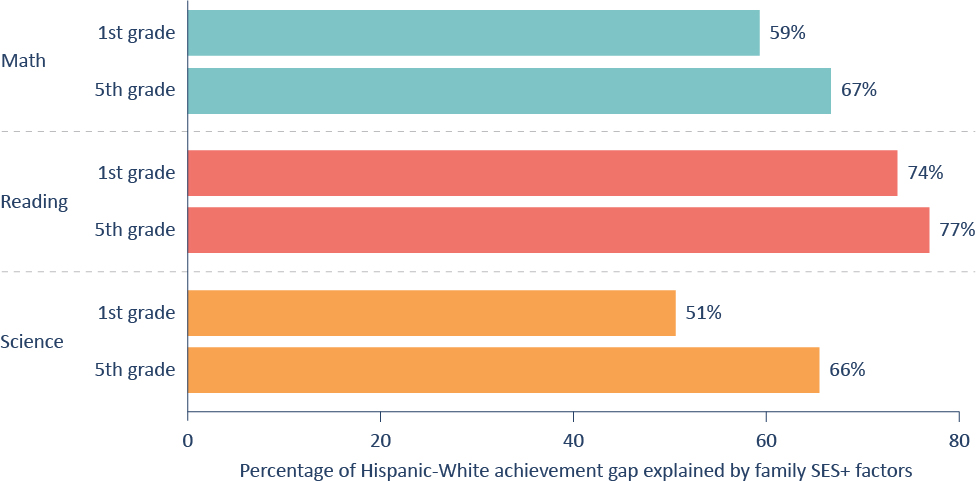
Figure F-2. Family SES+ explains more of the Hispanic-White achievement gap than the Black-White achievement gap.
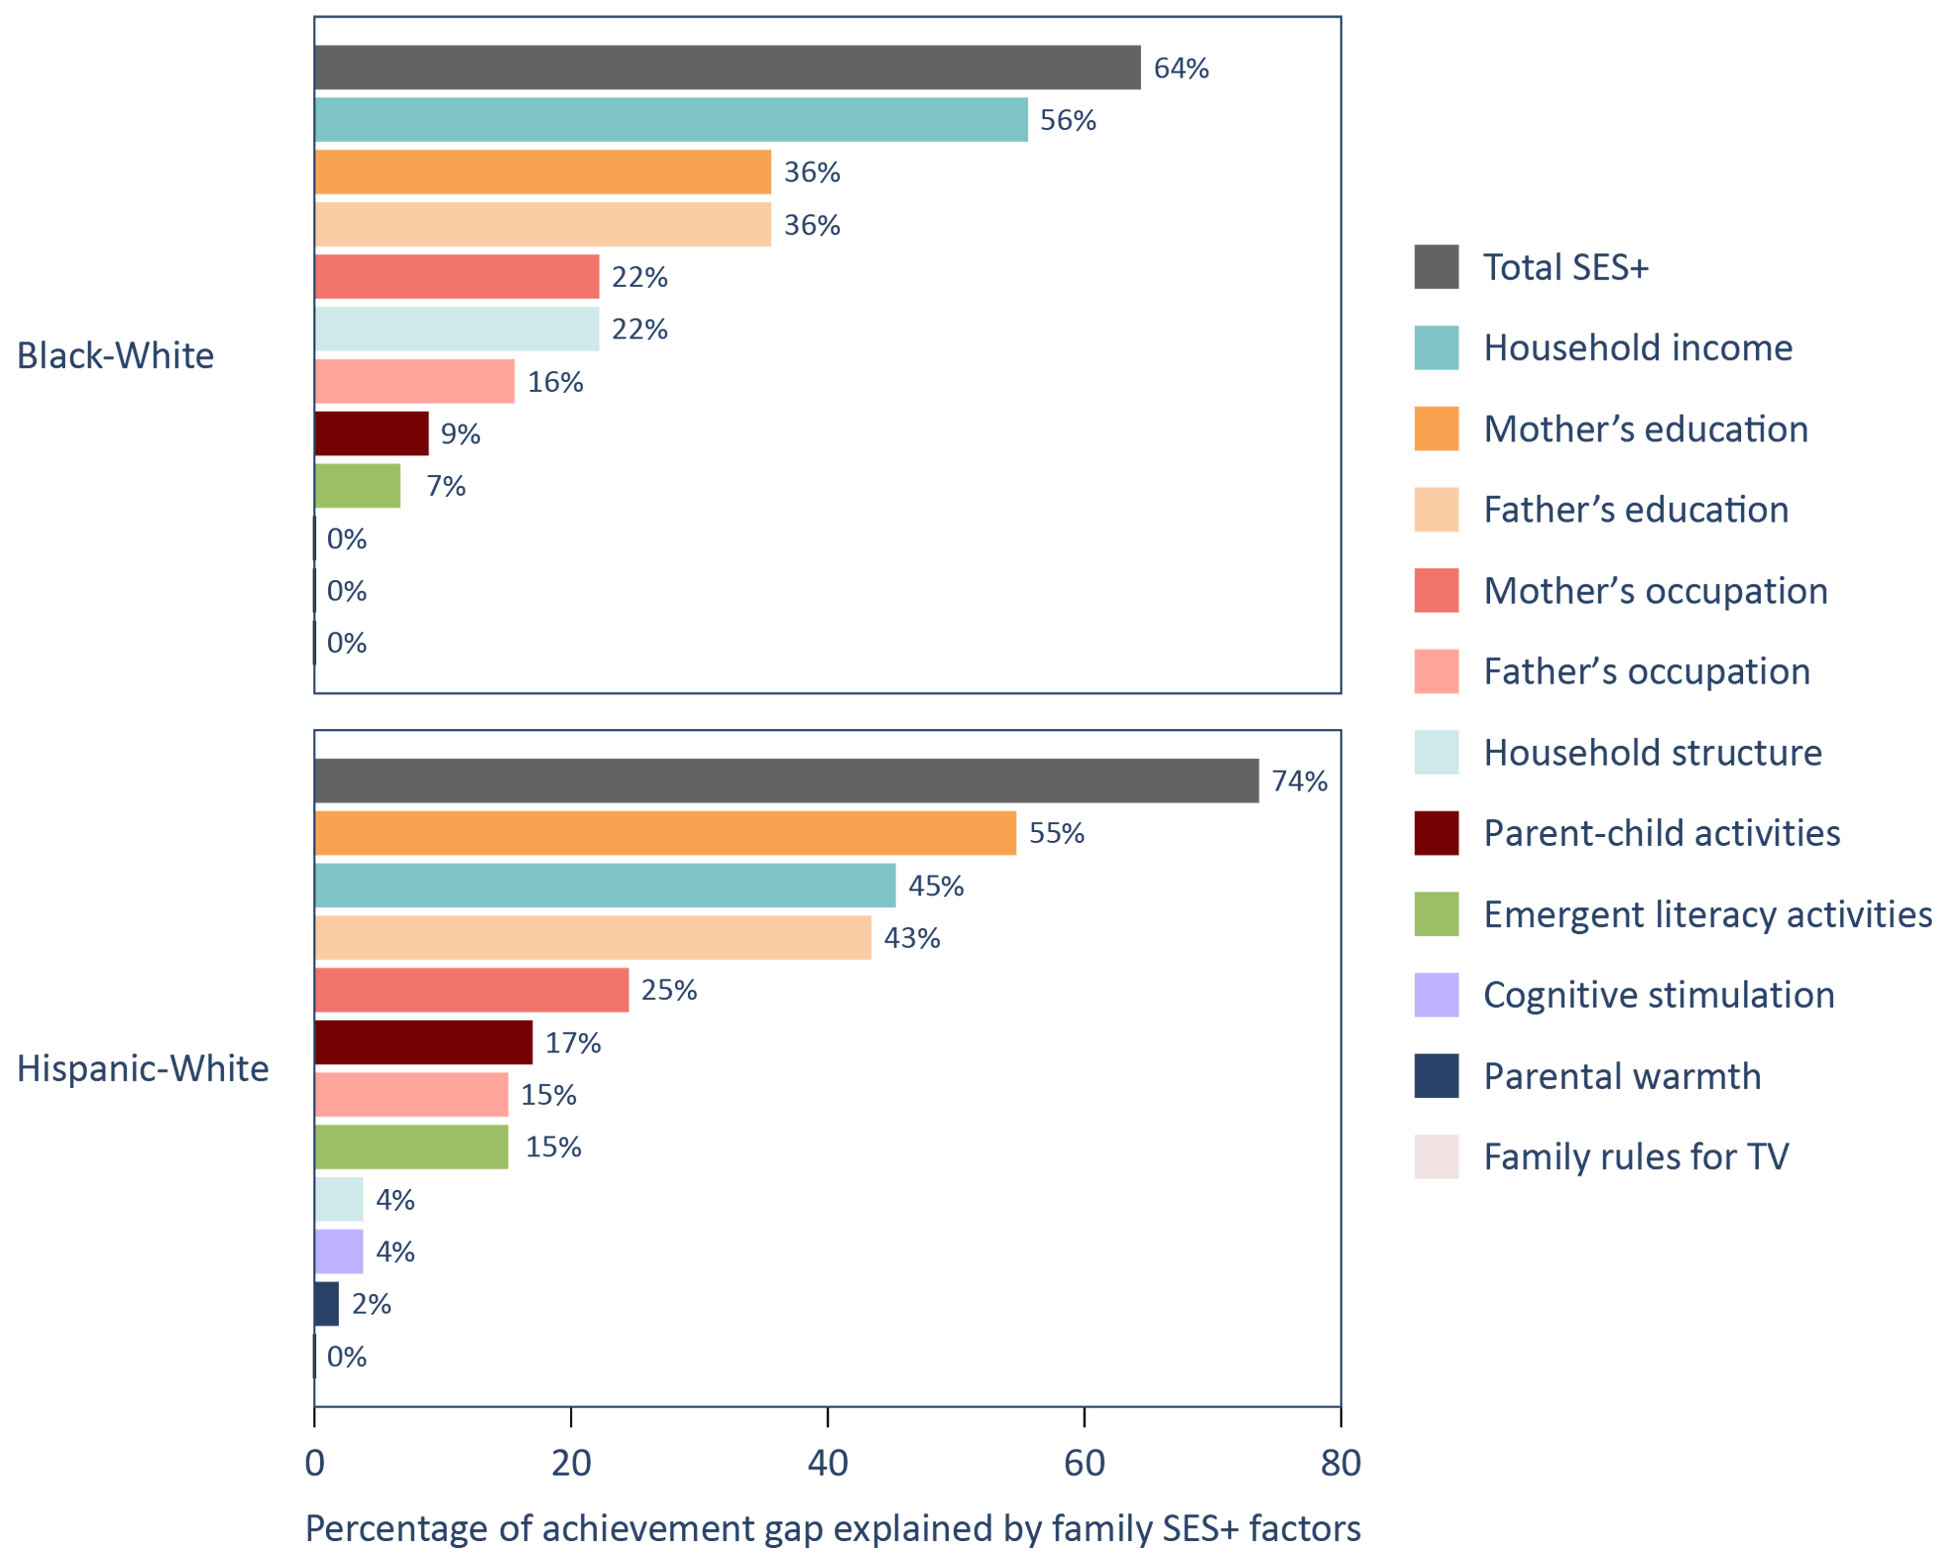
Finding 2: Household income and mother’s education are the SES+ factors that best explain Black-White and Hispanic-White achievement gaps, respectively.
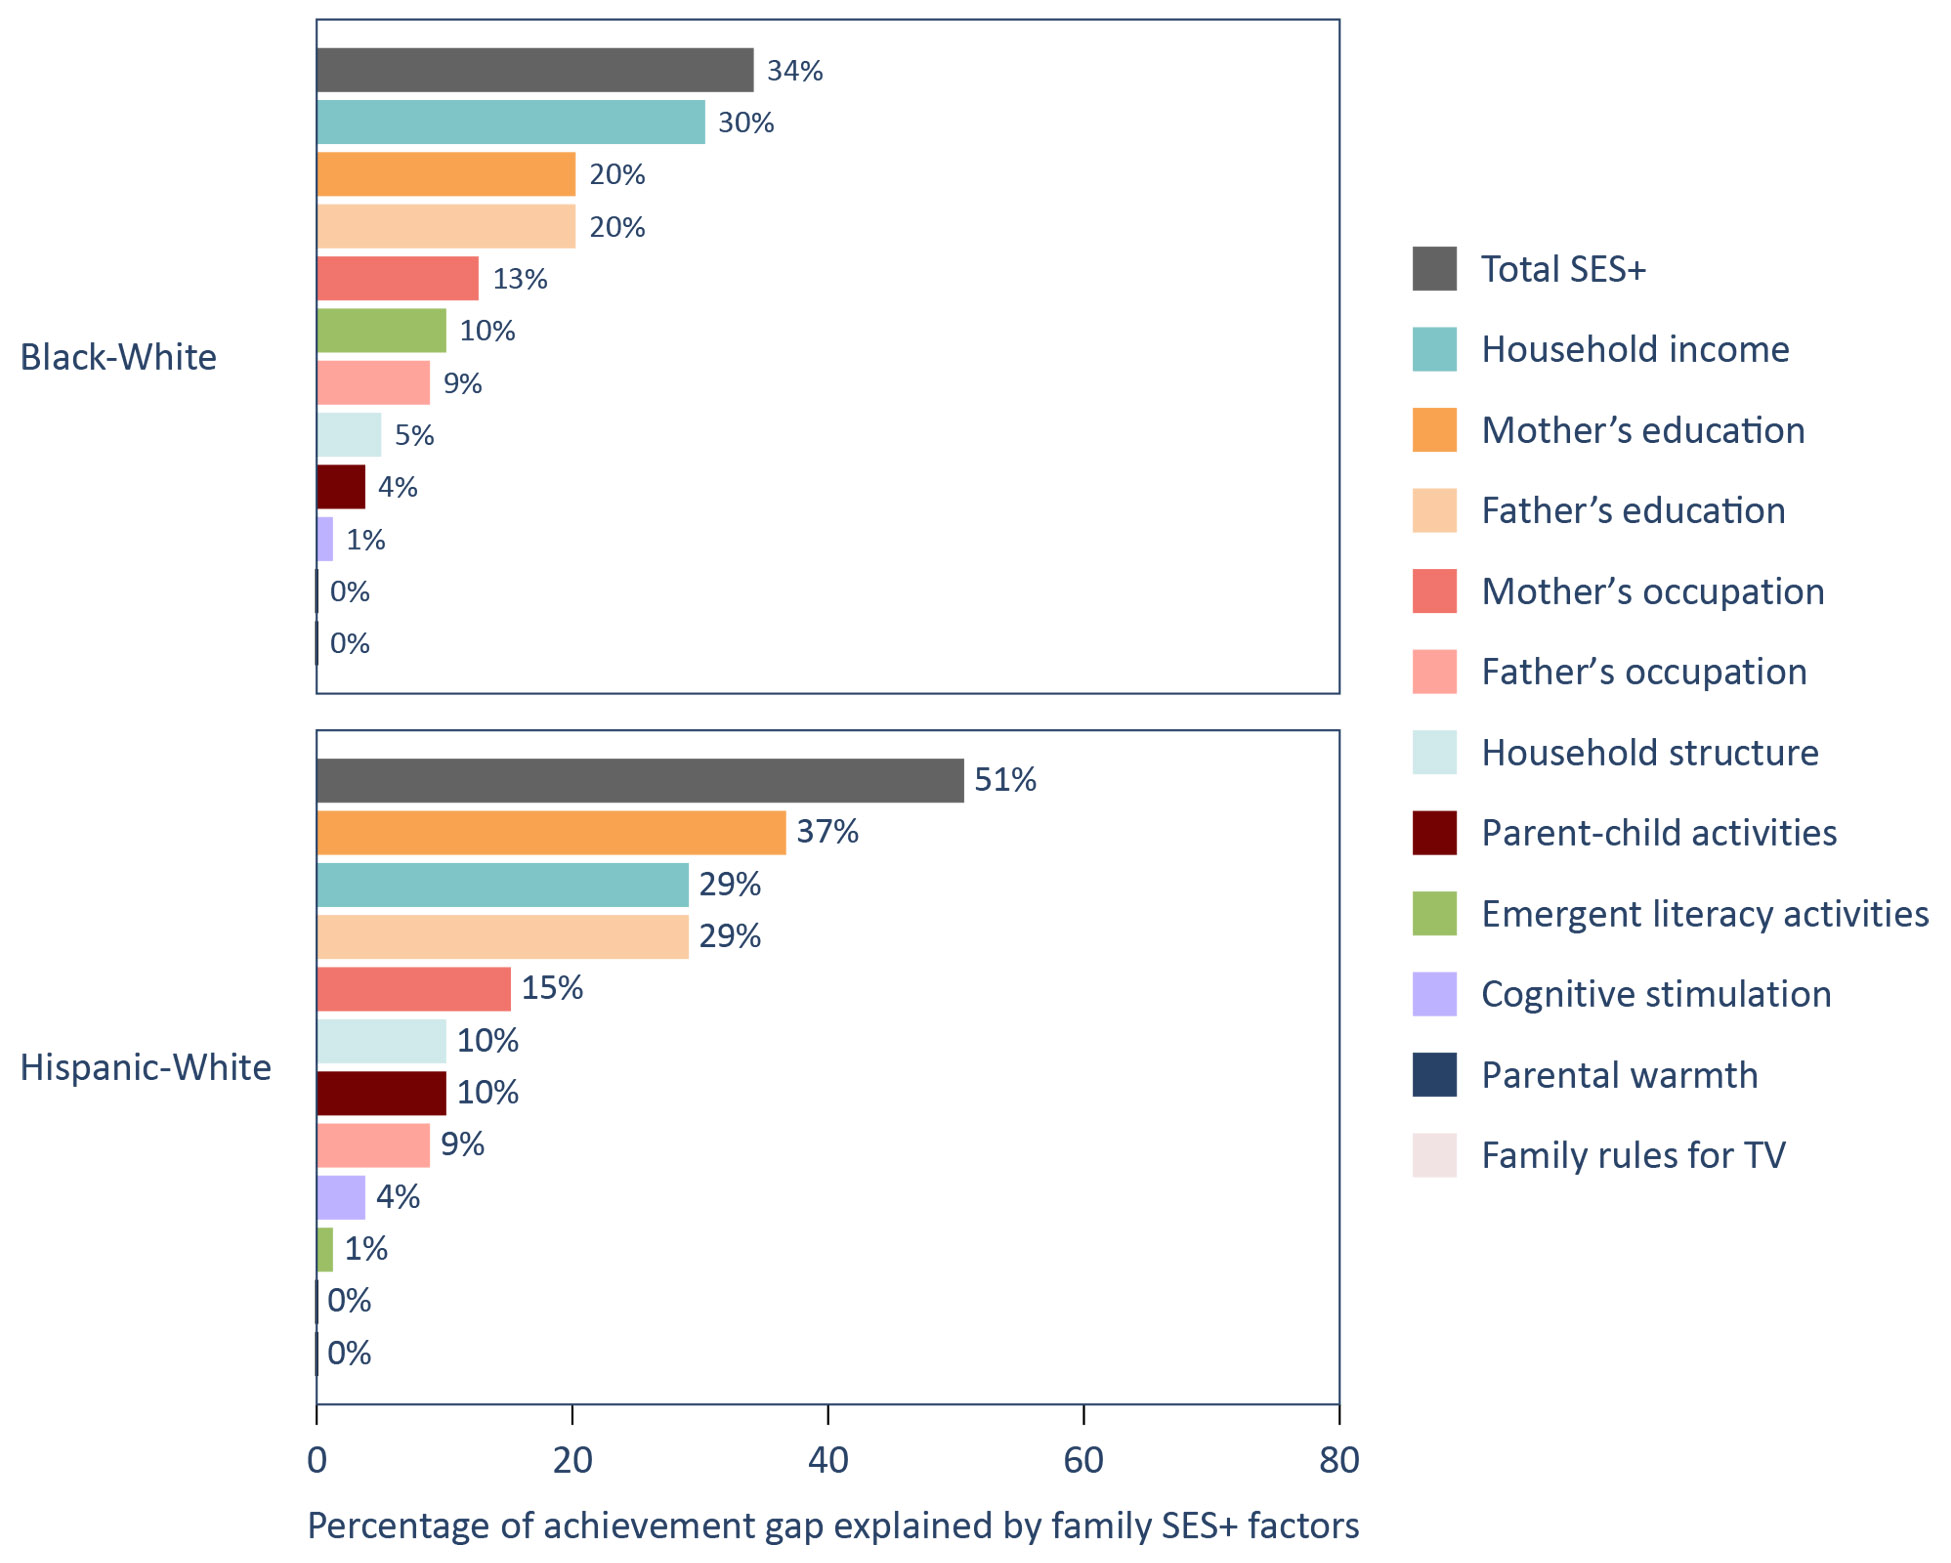
Figure F-3. Among individual SES+ factors related to science achievement gaps, household income best explains the Black-White gap and mother’s education best explains the Hispanic-White gap.
Finding 3: Family SES+ indicators, and the extent to which they explain racial/ethnic achievement gaps, are stable over time (1998-99 and 2010-11).
Table F-2. Various indicators of family SES+ are moderately correlated with each other across the two kindergarten cohorts.
|
Kindergarten Class of 2010-11 Cohort |
||||||||||
|
|
(1) |
(2) |
(3) |
(4) |
(5) |
(6) |
(7) |
(8) |
(9) |
(10) |
|
(1) Mother’s education background |
|
|
|
|
|
|
|
|
|
|
|
(2) Father’s education background |
0.65 |
|
|
|
|
|
|
|
|
|
|
(3) Mother’s occupation prestige |
0.58 |
0.41 |
|
|
|
|
|
|
|
|
|
(4) Father’s occupation prestige |
0.42 |
0.57 |
0.34 |
|
|
|
|
|
|
|
|
(5) Household income |
0.58 |
0.56 |
0.48 |
0.40 |
|
|
|
|
|
|
|
(6) Household structure |
0.16 |
0.06 |
0.16 |
0.04 |
0.32 |
|
|
|
|
|
|
(7) Cognitive stimulation |
0.10 |
0.07 |
0.04 |
0.03 |
0.03 |
0.01 |
|
|
|
|
|
(8) Emergent literacy activities |
0.23 |
0.21 |
0.14 |
0.13 |
0.17 |
0.05 |
0.41 |
|
|
|
|
(9) Parent-child activities |
0.38 |
0.36 |
0.24 |
0.21 |
0.32 |
0.09 |
0.26 |
0.31 |
|
|
|
(10) Family rules for TV |
0.07 |
0.07 |
0.05 |
0.05 |
0.03 |
0.01 |
0.11 |
0.08 |
0.13 |
|
|
(11) Parental warmth |
0.04 |
0.04 |
0.00 |
0.01 |
0.03 |
-0.06 |
0.20 |
0.12 |
0.10 |
0.08 |
|
Kindergarten Class of 1998-99 Cohort |
||||||||||
|
|
(1) |
(2) |
(3) |
(4) |
(5) |
(6) |
(7) |
(8) |
(9) |
(10) |
|
(1) Mother’s education level |
|
|
|
|
|
|
|
|
|
|
|
(2) Father’s education level |
0.64 |
|
|
|
|
|
|
|
|
|
|
(3) Mother’s occupation prestige |
0.56 |
0.40 |
|
|
|
|
|
|
|
|
|
(4) Father’s occupation prestige |
0.42 |
0.58 |
0.32 |
|
|
|
|
|
|
|
|
(5) Household income |
0.55 |
0.55 |
0.38 |
0.38 |
|
|
|
|
|
|
|
(6) Household structure |
0.19 |
0.09 |
0.12 |
0.06 |
0.36 |
|
|
|
|
|
|
(7) Cognitive stimulation |
0.13 |
0.13 |
0.08 |
0.08 |
0.07 |
0.02 |
|
|
|
|
|
(8) Emergent literacy activities |
0.28 |
0.25 |
0.17 |
0.18 |
0.25 |
0.11 |
0.39 |
|
|
|
|
(9) Parent-child activities |
0.40 |
0.38 |
0.25 |
0.26 |
0.37 |
0.11 |
0.27 |
0.34 |
|
|
|
(10) Family rules for TV |
0.08 |
0.07 |
0.06 |
0.05 |
0.04 |
0.02 |
0.13 |
0.09 |
0.13 |
|
|
(11) Parental warmth |
0.02 |
0.01 |
0.01 |
0.01 |
0.01 |
-0.03 |
0.19 |
0.10 |
0.10 |
0.10 |
Finding 4: The inclusion of family SES+ helps explain racial and ethnic excellence gaps.
Figure F-4. Family SES+ factors explain between 36 and 60 percent of the Black-White excellence gaps.
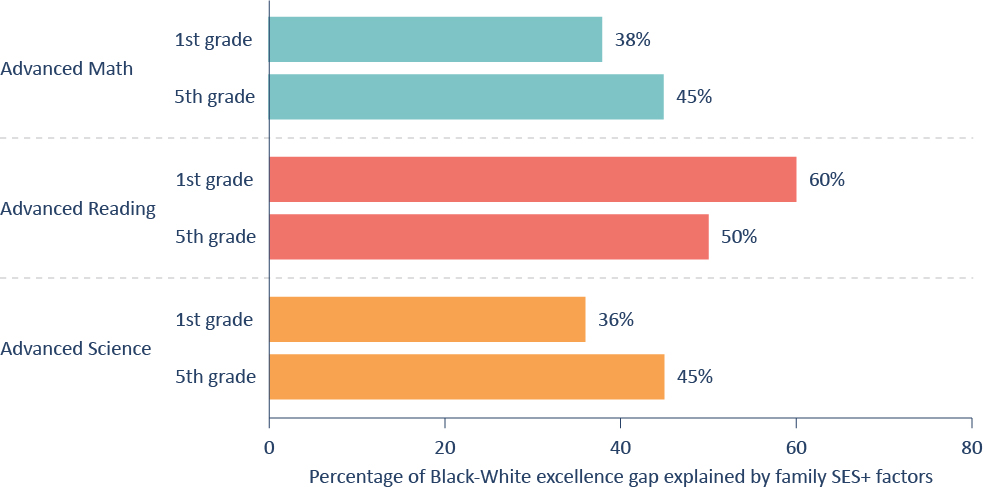
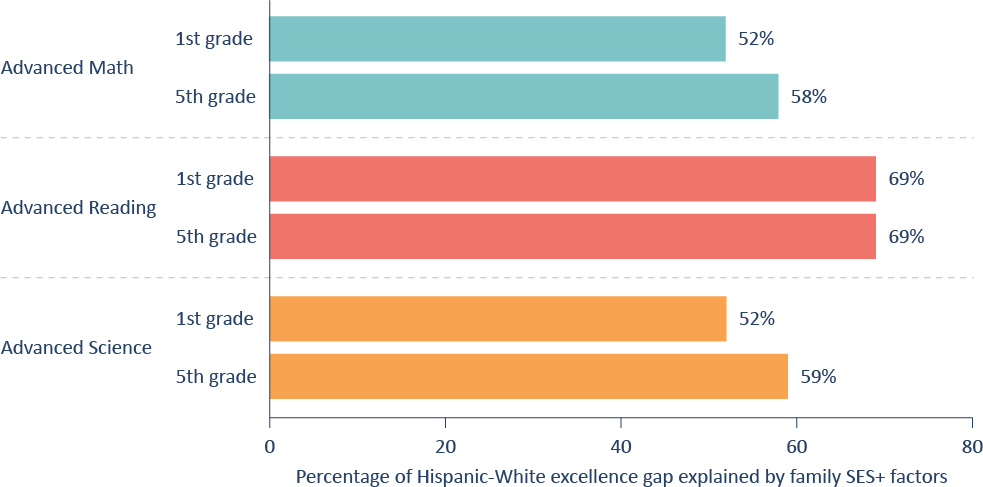
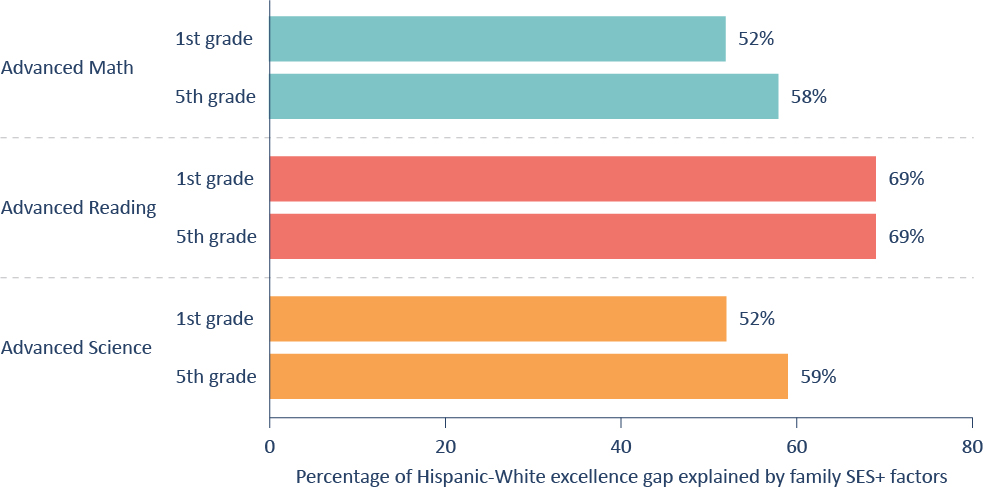
Figure F-5. Family SES+ factors explain between 52 and 69 percent of the Hispanic-White excellence gaps.
Making sense of the findings
These findings are generally consistent with Fryer and Levitt’s study from two decades ago. Socioeconomic factors can explain a large proportion of racial achievement gaps. But the current study adds a great amount of detail and nuance to our understanding of the relationships at play, while raising new questions:
1. How can we explain the different patterns for the Black-White achievement gap for reading, on the one hand, and math and science, on the other? Why is first grade reading such an outlier, given that it’s the only subject and grade combination where we see SES explaining a majority of the Black-White gap (about two-thirds)—especially when we combine that pattern with the finding that the Black-White reading gap continues to grow as students make their way through school?
Here’s one hypothesis: As scholars, including E.D. Hirsch, Jr., have long argued, initial reading skills are more closely correlated to family SES than are math and science ones. This is likely because parents play a larger role, especially in a child’s first five years, in transmitting language abilities than they do for math and science. That can occur via behaviors, such as reading to their children, but also through their own use of verbal language. The advantages of high SES—and disadvantages of low SES—thus show up more for students’ initial reading skills than for their math and science ones. As students get older and benefit from classroom instruction, their relative advantages and disadvantages start to matter less.
As Paul Morgan explains, “Children from higher SES families, who are disproportionately White and Asian, have a head start in terms of acquisition of early reading skills, so their better reading abilities show up early on the reading achievement measures. Over time, those from lower SES families acquire these early reading skills, including while attending school, and so the SES/racial gap narrows and begins to approximate those in the other subjects.”
That’s good news from an equity perspective, but let’s not forget that the Black-White achievement gap (including in reading) continues to grow as students age through elementary school. Consistent with Fryer and Levitt’s paper, that likely means that we still haven’t closed the “school quality gap” between Black students and their White peers.
2. Why does SES explain so much more of the Hispanic-White gap than the Black-White gap? One explanation might be that Hispanic children being raised in Spanish-speaking families have latent potential that is obscured by their lack of English skills (which become stronger as the grade level increases).
It may also be helpful to ponder what might be included in the “not SES” category. As explained earlier, possibilities include health-related factors, such as low-birth weight and being the child of a teenage mom—factors related to poverty that affect Black children more than their Hispanic peers.[1] It might also include various forms and effects of racism and bias, which might affect Black children at higher rates. For lower-income Black children, who are more likely to experience deep, persistent poverty than other groups, the combination of “adverse childhood experiences” might exacerbate inequalities. And for middle class Black children, bias, stereotype threat, and related factors might be especially at play.
This might also be why the Black-White achievement gap grows over the course of elementary school, while the Hispanic-White gap shrinks. As Eric Hengyu Hu pointed out, “research by von Hipper et al. (2018) using both old and new ECLS data found school years tend to equalize early-grade Hispanic-White gaps but not Black-White gaps.” That might be because of the greater challenges Black students face outside of school, but it is likely also because of their inequitable access to effective schools.
3. What’s the role of household structure in the Black-White and Hispanic-White gaps? Hu and Morgan find that “family structure explains between 1 and 22 percent of the gaps, but is more important for explaining the Black-White achievement gap (10 to 22 percent of the gap explained) than the Hispanic-White achievement gap (1 to 4 percent of the gap explained).” That makes sense, given that Hispanic students are far more likely than their Black peers to live in two-parent families (74 percent versus 40 percent, respectively)—a rate which is much closer to that for White children (84 percent).
But these findings likely understate the role of family structure, especially for Black children, given the relationship between the number of parents in the household and household income. As shown in Table F-2, there’s a correlation of 0.32 between these two variables for the latest ECLS cohort, which is quite strong. On top of the many non-material benefits of growing up with two loving parents, it’s clearly the case that two incomes are usually better than one when it comes to boosting families out of poverty. And increasing the proportion of two-parent, two-income families in the Black community would thus help to narrow the Black-White achievement gap, as well.
***
None of this lends itself to simple takeaways, but the authors’ recommendations in the report—especially their suggestion to invest in early childhood education and to supplement families’ incomes, perhaps via an expanded child tax credit—deserve serious consideration.
As has been clear since the Coleman Report, when it comes to the interplay between race, poverty, and schooling, the honest read is that it’s complicated. What’s undeniable, though, is that much hard work remains, especially when it comes to providing effective schools to marginalized students, especially those who are Black. Let’s keep at it.
Introduction
Significant racial and ethnic achievement gaps exist between students in the U.S. by elementary school.[2] However, the underlying causes for these achievement gaps differ.[3] Thus, a better understanding of why racial/ethnic achievement gaps occur can help inform policies that promote educational and societal opportunities for all students.
One factor for racial/ethnic achievement gaps is between-group differences in socioeconomic status (SES), particularly exposure to poverty. For example, Black and Hispanic students perform, on average, at significantly lower levels academically than Asian and White students, which is primarily because Black and Hispanic students are more likely to grow up in less-resourced homes and neighborhoods.[4] According to this explanation, racial/ethnic achievement gaps result from socioeconomic factors; therefore, addressing these gaps would emphasize race-neutral policies and practices that lessen the negative effects of economic adversity.
Moreover, other factors contributing to racial and ethnic achievement gaps include bias, cultural insensitivity, stereotypes, and individual and systemic racism. Here, socioeconomic factors are simply one part of the story.[5] For example, why else would upper-middle-class Black students tend to perform worse than upper-middle-class White and Asian students? Or why do achievement gaps among fourth graders persist even when accounting for exposure to economic adversity?[6] This all suggests the need not for race-neutral but race-conscious policies (e.g., ensuring that Black or Hispanic students are taught by Black or Hispanic teachers and introducing ethnic studies curricula during K–12 schooling, using affirmative action in higher education) to address racial and ethnic achievement gaps.
Our understanding of the extent to which SES explains racial and ethnic achievement gaps during elementary school is limited in several important aspects. That is, available research mainly analyzed cross-sectional data rather than longitudinal data, used imprecise measures of SES (e.g., receipt of free or reduced-price lunch status), examined achievement gaps in certain academic subjects while excluding others (e.g., reading but not mathematics and science), and did not assess how SES may have changed as an explanatory factor across different cohorts of U.S. elementary students.[7]
Our study examines the extent to which socioeconomic factors explain gaps in reading, mathematics, and science achievement among racial and ethnic groups of U.S. elementary students. We use four macro- and eleven micro-level measures of family background to identify factors that best explain these achievement gaps. Our analyses include descriptive statistics and regression models. The results provide nonexperimental evidence of factors that might be the focus of experimentally assessed policies and practices attempting to lessen racial and ethnic achievement gaps in U.S. elementary schools. They also help determine the extent to which SES explains these gaps. Furthermore, we expect that the findings of this study will provide insights into the ongoing discussion of whether race-neutral or race-conscious policies are more effective in addressing these gaps.
We examine the following research questions:
- To what extent does a broad set of family SES indicators explain initially observed racial and ethnic achievement gaps?
- To what extent do specific family SES indicators explain racial and ethnic achievement gaps?
- To what extent do the family SES indicators correlate, and how have they changed over time?
- To what extent does family SES help explain racial and ethnic disparities among high achievers?
Background
A Broader View of Socioeconomic Status
Researchers often used receipt of free or reduced-price lunch or household income to represent a family’s SES.[8] However, SES is most certainly a much broader factor, encompassing social patterns and aspects of family life that may relate to, but are not solely dependent on, household income. In this study, we used federal data on two cohorts of kindergarten students. Accordingly, our report included eleven indicators of a student’s family life (which can be aggregated into four key factors) for a more detailed view of the relationship between SES and student racial or ethnic background and academic achievement, including but not limited to the family’s household income (Table 1).
Table 1. Family SES measures included in the study
|
Parent Background |
Mother’s education background |
|
Father’s education background |
|
|
Mother’s occupation prestige |
|
|
Father’s occupation prestige |
|
|
Family finances |
Household income |
|
Household Structure |
Whom child lives with |
|
Household Opportunity Factors |
Cognitive stimulation |
|
Emergent literacy activities |
|
|
Parent-child activities |
|
|
Family rules for TV |
|
|
Parental warmth |
Initial Racial and Ethnic Gaps in Academic Achievement
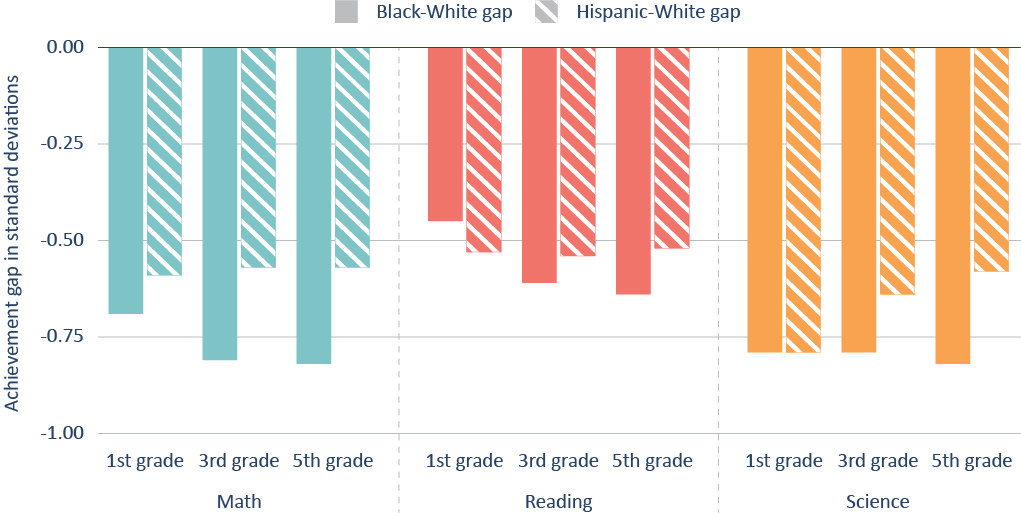
Before delving into the role of SES in academic achievement, it’s essential to first understand the existing racial and ethnic gaps in general. Figure 1 presents data from the federally administered Early Child Longitudinal Study (2010-11 kindergarten cohort). The figure demonstrates the racial and ethnic gaps in assessment scores using the largest student group (White students) as the reference group. On average, Black and Hispanic students score substantially lower than White students in all subjects, whereas Asian students score slightly higher than White students. Figure 2 illustrates the disparities between different ethnic groups in terms of math and reading scores. Regarding math scores, the Black-White gap tended to grow throughout elementary school, whereas the Hispanic-White gap narrowed slightly.
Figure 1. Racial/ethnic gaps in student achievement in fifth grade are substantial.
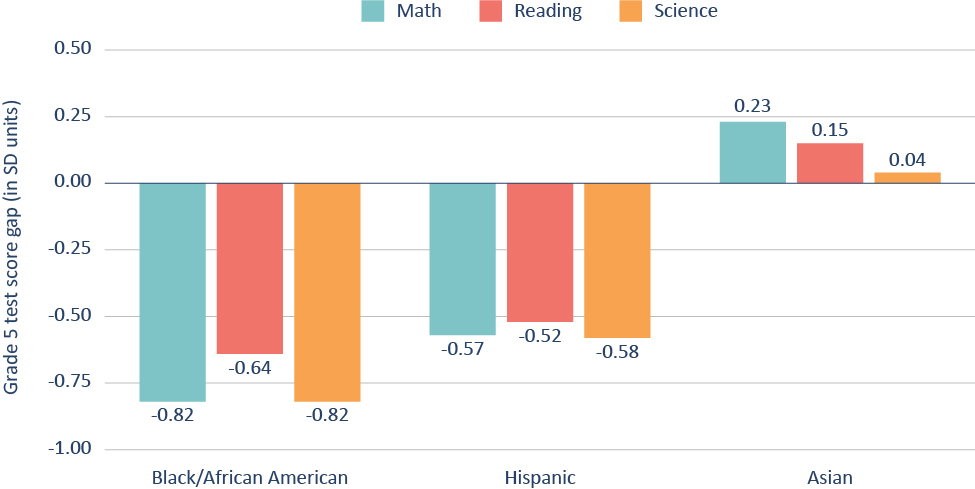
Figure 2. The Black-White achievement gap grows across elementary grades.
Disentangling Race and Class
SES factors, including parental education, income, and occupation, strongly predict children’s academic achievement,[9] with higher SES consistently associated with greater academic achievement.[10] Being from a higher SES family undoubtedly provides students with many advantages, such as greater access to higher-quality educational resources, enriched learning environments, and increased parental time and involvement in their education.[11] Prior studies suggested that parental education plays an outsized role in shaping children’s academic trajectories. This could be because parental education is often associated with a stronger emphasis on the value of education, which may lead to more positive learning environments for children.[12] There’s also the possibility that adults who have the skills—cognitive and otherwise—to persist in their own educational attainment are likely to bequeath similar skills to their children.
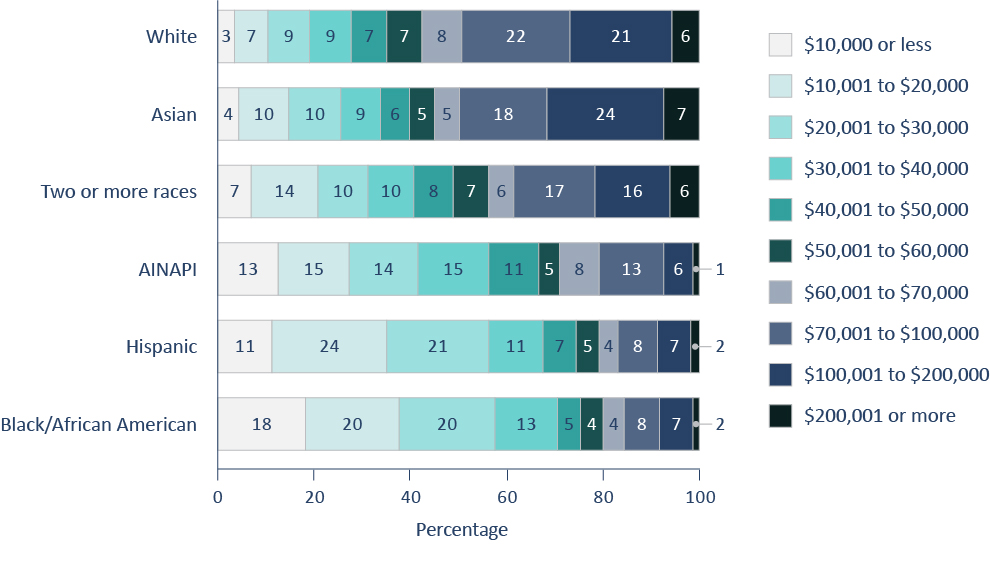
A challenge often encountered during the analysis of social patterns is the presence of many factors that may correlate with a given outcome, as well as explanatory factors that may correlate with each other and other factors. Analyzing differences in academic achievement by race, ethnicity, or family SES background highlights this problem. For example, Figure 3 depicts how household income varies for students in the 2010-11 ECLS-K kindergarten cohort. About half of White students (49 percent) and Asian students (49 percent) are being raised in families who are in the top three income categories. In contrast, less than one in five Black students (17 percent) or Hispanic students (17 percent) come from such families.
Instead, Black and Hispanic students are much more likely to live in poverty than their White and Asian peers. Most Black students (58 percent) and Hispanic students (56 percent) come from families in the bottom three income categories. Only one in five White students (19 percent) and one-fourth of Asian students (24 percent) come from families with the lowest income levels.
Figure 3. Household income varies across racial and ethnic groups from the kindergarten cohort of 2010-11.
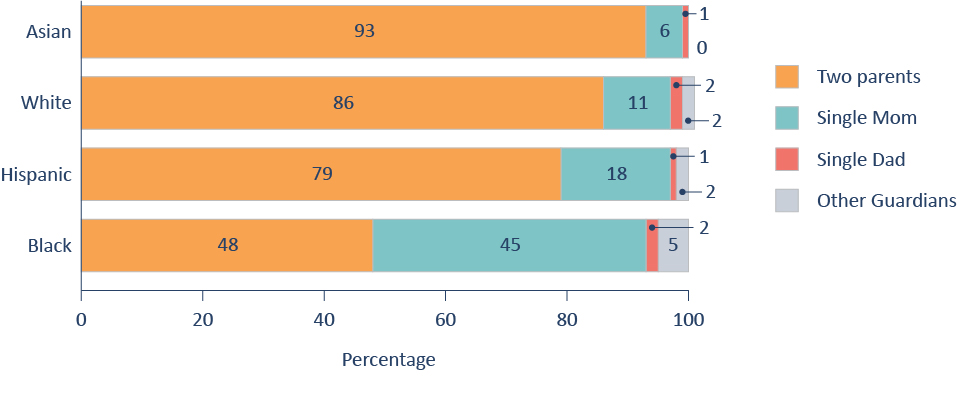
As stated above, economic factors such as household income are only one aspect of SES, as there are other SES factors associated with race and ethnicity. For example, household structure is a factor that measures whether a child lives with a single parent, two parents, or other guardians. Figure 4 illustrates the significant variation in household structure among different racial and ethnic student groups. That is, 93 percent of Asian students and 86 percent of White students live in two-parent households. On the other hand, just 48 percent of Black students do. Moreover, Hispanic students, who are nearly as likely as their Black peers to live at low-income levels (Figure 3), have a significantly higher probability of living in two-parent families than those peers (79 percent versus 48 percent, respectively).
Figure 4. Household structure varies across racial and ethnic groups, as per the kindergarten cohort of 2010-11.
The correlations among family SES variables are often strong, but not always. Table 2 lists the correlation coefficients between family SES factors and additional home environment measures (collectively, we refer to the SES factors and the home environment factors as “SES+”). These coefficients have a possible range from +1 (perfect direct correlation) to -1 (perfect inverse correlation). All the (bolded) statistically significant correlation coefficients in Table 2 are positive except for the relationship between household structure and parental warmth, which indicates a very weak negative correlation (-0.06). Apart from the parental warmth factor, all relationships between SES+ factors are positive, but they range from practically and statistically insignificant positive correlations (e.g., the 0.01 coefficient for household structure and family rules for TV) to strong positive correlations (e.g., the 0.65 correlation for mother’s educational background and father’s educational background).
Table 2. Various indicators of family SES+ are positively associated with each other.
|
Kindergarten class of 2010-11 cohort |
||||||||||
|
(1) |
(2) |
(3) |
(4) |
(5) |
(6) |
(7) |
(8) |
(9) |
(10) |
|
|
(1) Mother’s educational background |
|
|
|
|
|
|||||
|
(2) Father’s educational background |
0.65 |
|
|
|
|
|
||||
|
(3) Mother’s occupational prestige |
0.58 |
0.41 |
|
|
|
|
|
|||
|
(4) Father’s occupational prestige |
0.42 |
0.57 |
0.34 |
|
|
|
|
|
||
|
(5) Household income |
0.58 |
0.56 |
0.48 |
0.40 |
|
|
|
|
|
|
|
(6) Household structure |
0.16 |
0.06 |
0.16 |
0.04 |
0.32 |
|
|
|
|
|
|
(7) Cognitive stimulation |
0.10 |
0.07 |
0.04 |
0.03 |
0.03 |
0.01 |
|
|
|
|
|
(8) Emergent literacy activities |
0.23 |
0.21 |
0.14 |
0.13 |
0.17 |
0.05 |
0.41 |
|
|
|
|
(9) Parent-child activities |
0.38 |
0.36 |
0.24 |
0.21 |
0.32 |
0.09 |
0.26 |
0.31 |
|
|
|
(10) Family rules for TV |
0.07 |
0.07 |
0.05 |
0.05 |
0.03 |
0.01 |
0.11 |
0.08 |
0.13 |
|
|
(11) Parental warmth |
0.04 |
0.04 |
0.00 |
0.01 |
0.03 |
-0.06 |
0.20 |
0.12 |
0.10 |
0.08 |
These analyses suggest that students’ race and ethnicity, family SES+, and academic achievement are interrelated in multiple ways. Throughout the rest of this study, we will examine to what extent accounting for family SES+ helps explain initially observed racial and ethnic achievement gaps.
This report uses federal data from the public-use version of the Early Childhood Longitudinal Study, Kindergarten Class of 1998-99[13] (ECLS-K:1998-99), and the Early Childhood Longitudinal Study, Kindergarten Class of 2010-11[14] (ECLS-K:2010-11). The former is a longitudinal study that tracks the same cohort of children from kindergarten through the eighth grade. The latter follows a different cohort of children from kindergarten through the fifth grade. Both datasets have extensive information on student-level academic achievement, sociodemographic characteristics, and home environments for children who entered kindergarten during the fall of 1998 and spring of 1999, as well as the fall of 2010 and spring of 2011. The total number of students included in ECLS-K:1998-99 was 21,409, while that in ECLS-K:2010-11 was 18,174.
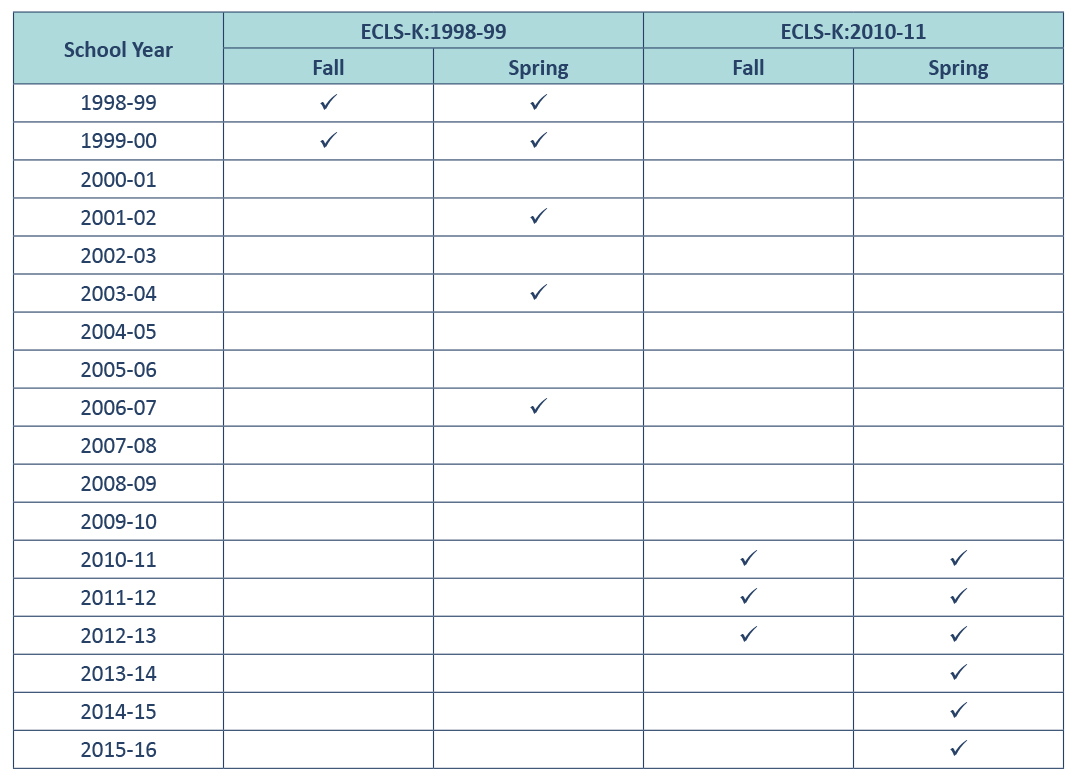
Table 3 displays the frequency at which data were gathered for students participating in each study.
Table 3: Data gathering intervals for ECLS-K:1998-99 and ECLS-K:2010-11
The ECLS-K datasets include individually assessed reading, mathematics, and science achievement measures in each grade reported on a consistent scale.[15] We used scores from first, third, and fifth grade reading, mathematics, and science assessments as continuous measures of academic achievement. See the Appendix for a description of the content assessed on each of the three subject-specific tests.
The ECLS-K datasets include the parent-reported race and ethnicity of individual students. Possible responses included the following: White, non-Hispanic; Black/African American, non-Hispanic; Hispanic, race specified; Hispanic, no race specified; Asian, non-Hispanic; Native Hawaiian or Other Pacific Islander, non-Hispanic; American Indian or Alaska Native, non-Hispanic; and more than one race, non-Hispanic. We combined the responses of Hispanic, race specified, and Hispanic, no race specified, into one Hispanic group. We also merged the categories of American Indian or Alaska Native, non-Hispanic, and Native Hawaiian or Other Pacific Islander into one American Indian, Native American, Pacific Islander (AINAPI) group.
We constructed family SES measures from parent surveys in the fall or spring of the student’s kindergarten year. The highest education level for mothers and fathers included five categories. These categories are as follows: (a) not high school graduate (reference group); (b) high school graduate or equivalent (e.g., GED); (c) some college; (d) bachelor’s degree; and (e) master’s degree or higher. The occupational prestige scores for mothers and fathers were measured based on occupations coded using the “Manual for Coding Industries and Occupations,” which was created for the National Household Education Surveys Program and uses an aggregated version of occupation codes.[16] Household income was derived from parental reports and divided into 18 categories ranging from $5,000 or less to $200,001 or more.[17] The household structure variable included four categories that refer to who raises the student: (a) two parents (b) single mother; (c) single father; and (d) other guardians (e.g., grandparents).[18]
Additionally, we considered five broad measures of “home opportunity factors.” These factors are used to assess parent engagement and aspects of the home environment, including (a) cognitively stimulating activities (e.g., playing games or doing arts and crafts); (b) emergent literary activities (e.g., reading to your child; number of books the child owns); (c) parent-child activities (e.g., visits to the zoo, bookstore, or library); (d) parental warmth (e.g., expressions of love and affection); and (e) family TV rules (e.g., how much time the child is allowed to watch TV and when). Additional description of these measures can be found in the Appendix.
We also created a composite variable called “SES+” by combining the family SES variables, including household income and mother’s occupational status, with the home environment variables, such as parental warmth and emergent literacy activities.
Analysis
This report includes an analysis of student race and ethnicity, family SES and home environment measures, and three measures of academic achievement. Here, we analyzed reading, mathematics, and science scores separately from the spring of first, third, and fifth grade across the two cohorts. The fall or spring kindergarten measurements are the primary predictors. The findings are derived from correlation and regression analyses.[19] We used sampling weights to ensure that the results were nationally representative. Additional details of the analyses can be found in the Appendix.
A vital aspect of this analysis involves examining the reduction of the racial and ethnic achievement gaps after including family SES factors in the regression models. Each regression was run twice: once without family SES+ factors and again with SES+ factors included in the model. We refer to these in shorthand as “reduction rates,” which is synonymous with “percentage of achievement gap explained by SES+” and represents the coefficient for the race/ethnicity variable in the second model divided by the coefficient for the race variable in the first model.
For instance, for the 2010-11 kindergarten cohort, the Black-White reading gap in first grade is -0.45 SD and statistically significant (p < .001). Including the mother’s educational background in the regression reduces the estimated Black-White reading gap in first grade to -0.29 SD, which continues to be considerably significant (p < .001). We calculated this reduction as a percentage decrease as follows: (0.45 - 0.29) / 0.45 * 100 = 36 percent reduction. Thus, statistically adjusting for the mother’s education background reduces the estimated Black-White reading gap in first grade by 36 percent for the kindergarten cohort of 2010-11.
Findings
Finding 1: Taken together, family SES+ factors explain between 34 and 64 percent of the Black-White achievement gap (depending on subject and grade level) and between 51 and 77 percent of the Hispanic-White achievement gap.
This section examines the degree to which family SES+, including all eleven indicators, explains the racial and ethnic achievement gaps in analyses across grades, subjects, and ECLS-K cohorts. We focus on gaps among the three largest racial and ethnic student groups, including the Black-White and Hispanic-White gaps, for which we compare reduction rates across ECLS cohorts and grades. (Again, these rates refer to the difference in the effect size of racial and ethnic categories before and after including family SES+ factors in the regression models.)
Figure 5 shows that the inclusion of SES+ factors explains nearly two-thirds of the first grade Black-White reading achievement gap but less than half of those gaps in fifth grade reading and other subjects, regardless of grade level.
For the Black-White reading achievement gap, the reduction rate is notably decreased from first to fifth grade (64 percent to 48 percent). This suggests that SES+ is somewhat less influential in later grades for reading. This could be either because of a lengthening time interval between the measurement of the two factors or because family SES+ became increasingly less predictive of reading achievement as Black students age.
For the Black-White mathematics and science achievement gaps, the role of SES+ remains stable across grades. (For analysis of the role of SES+ in explaining Black-White achievement gaps in the earlier ECLS-K cohort, see the Appendix, Figure A1.)
Figure 5. Family SES+ explains more of the Black-White achievement gap in reading than in other subjects.
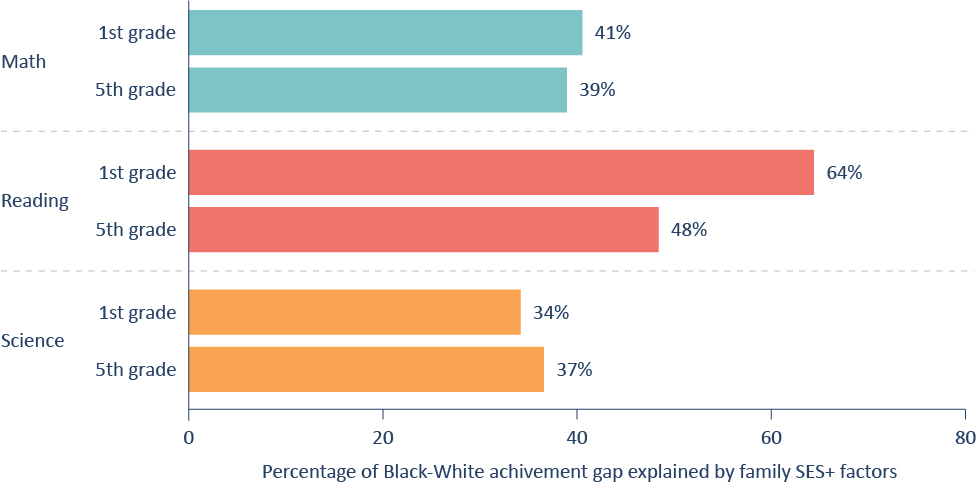
Figure 6 shows that the Hispanic-White achievement gap is considerably better explained by SES+ factors than the Black-White achievement gap. All the analyses show that SES+ factors explain more than half of the achievement gap, and in some analyses, SES+ factors explain about three-fourths of the gaps, namely, in first grade reading (74 percent) and fifth grade reading (77 percent).
Figure 6. Family SES+ explains more of the Hispanic-White achievement gap than the Black-White achievement gap.
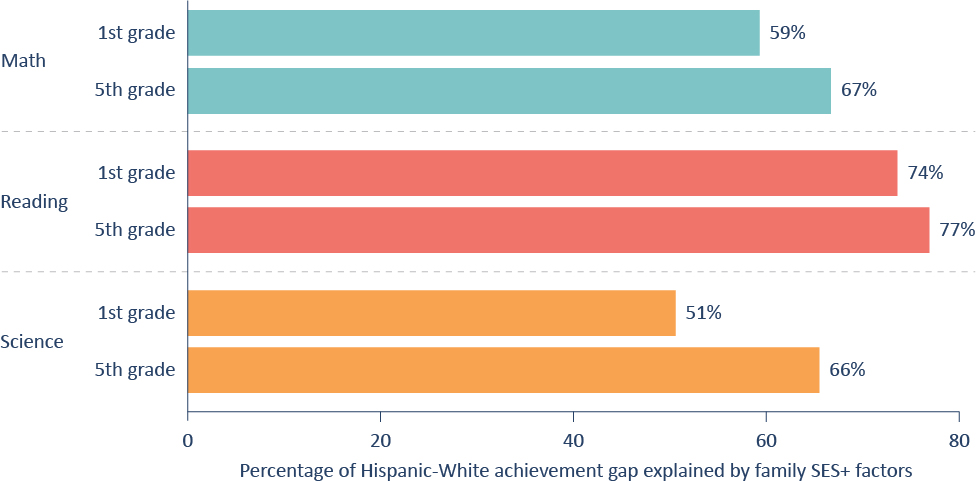
SES+ factors better explain the Hispanic-White achievement gaps in fifth grade than in first grade, regardless of subject. For mathematics and science achievement gaps, the difference across grades is more substantial than in reading. SES+ factors explain 59 percent and 51 percent of the math and science gaps, respectively, in first grade, but they explain 67 percent and 66 percent of those gaps, respectively, in fifth grade. (For analysis of the role of SES+ in explaining Hispanic-White achievement gaps in the earlier ECLS-K cohort, see the Appendix, Figure A2.)
To summarize, including the SES+ explanatory factors in an analysis of racial and ethnic achievement gaps reduces the estimated size of the gaps, but they remain. This is particularly evident in the Black-White achievement gap, where SES+ factors generally explain less than half of the gap in mathematics, science, and to some extent, reading.
Finding 2: Household income and mother’s education are the SES+ factors that best help explain the Black-White and Hispanic-White achievement gaps, respectively.
Next, we break down the measures of SES+, evaluating the extent to which they individually explain racial and ethnic achievement gaps. These analyses are designed to determine which of the study’s different family SES+ indicators best explains the observed racial and ethnic achievement gaps. Each measure of SES+ was incorporated separately into our regression model. Continuing our focus on the three largest student racial/ethnic groups, we examined the achievement of first-grade students in the more recent ECLS-K cohort. (Similar findings were observed for other grade levels and the earlier ECLS cohort.)
Overall, household income and mother’s education are the two SES+ factors that best help explain the achievement gaps. Figure 7, Figure 8, and Figure 9 depict the extent to which each SES+ factor accounts for the racial and ethnic achievement gap in first grade for each subject, respectively. Household income is the primary SES+ factor for explaining the Black-White achievement gap in all analyses, explaining between 30 percent to 56 percent of the Black-White gap, depending on the subject. It also important for explaining the Hispanic-White achievement gap, explaining between 29 and 45 percent of the gap, depending on the subject. Family opportunity factors, such as emerging literacy activities and family rules for television, explain very little of the racial and ethnic achievement gaps in all analyses.
Mother’s education is the most critical SES+ factor for explaining the Hispanic-White achievement gap in all analyses, accounting for 37 percent to 55 percent, depending on the subject. Moreover, this factor significantly explained the Black-White achievement gap, with values ranging between 20 and 36 percent, depending on the subject.
Father’s education is also an essential family SES+ factor for explaining these gaps. It is just as important as the mother’s education for explaining the Black-White achievement gap, explaining 20 to 36 percent of the gap, depending on the subject. It is also of similar significance to household income for explaining the Hispanic-White achievement gap, explaining 29 to 43 percent of the gap, depending on the subject.
Compared to the other four SES+ factors, parent occupational prestige and household structure are less influential in explaining racial and ethnic achievement gaps. Mother’s occupational prestige explains between 13 and 25 percent of the gaps, depending on race and subject. In contrast, father’s occupational prestige explains 9 to16 percent of the gaps, depending on race and subject. Family structure explains between 1 and 22 percent of the gaps. However, it explains the Black-White achievement gap (10 to 22 percent) better than the Hispanic-White achievement gap (1 to 4 percent).
Figure 7. Among individual SES+ factors, household income best explains the Black-White gap in reading achievement and mother’s education best explains the Hispanic-White gap.
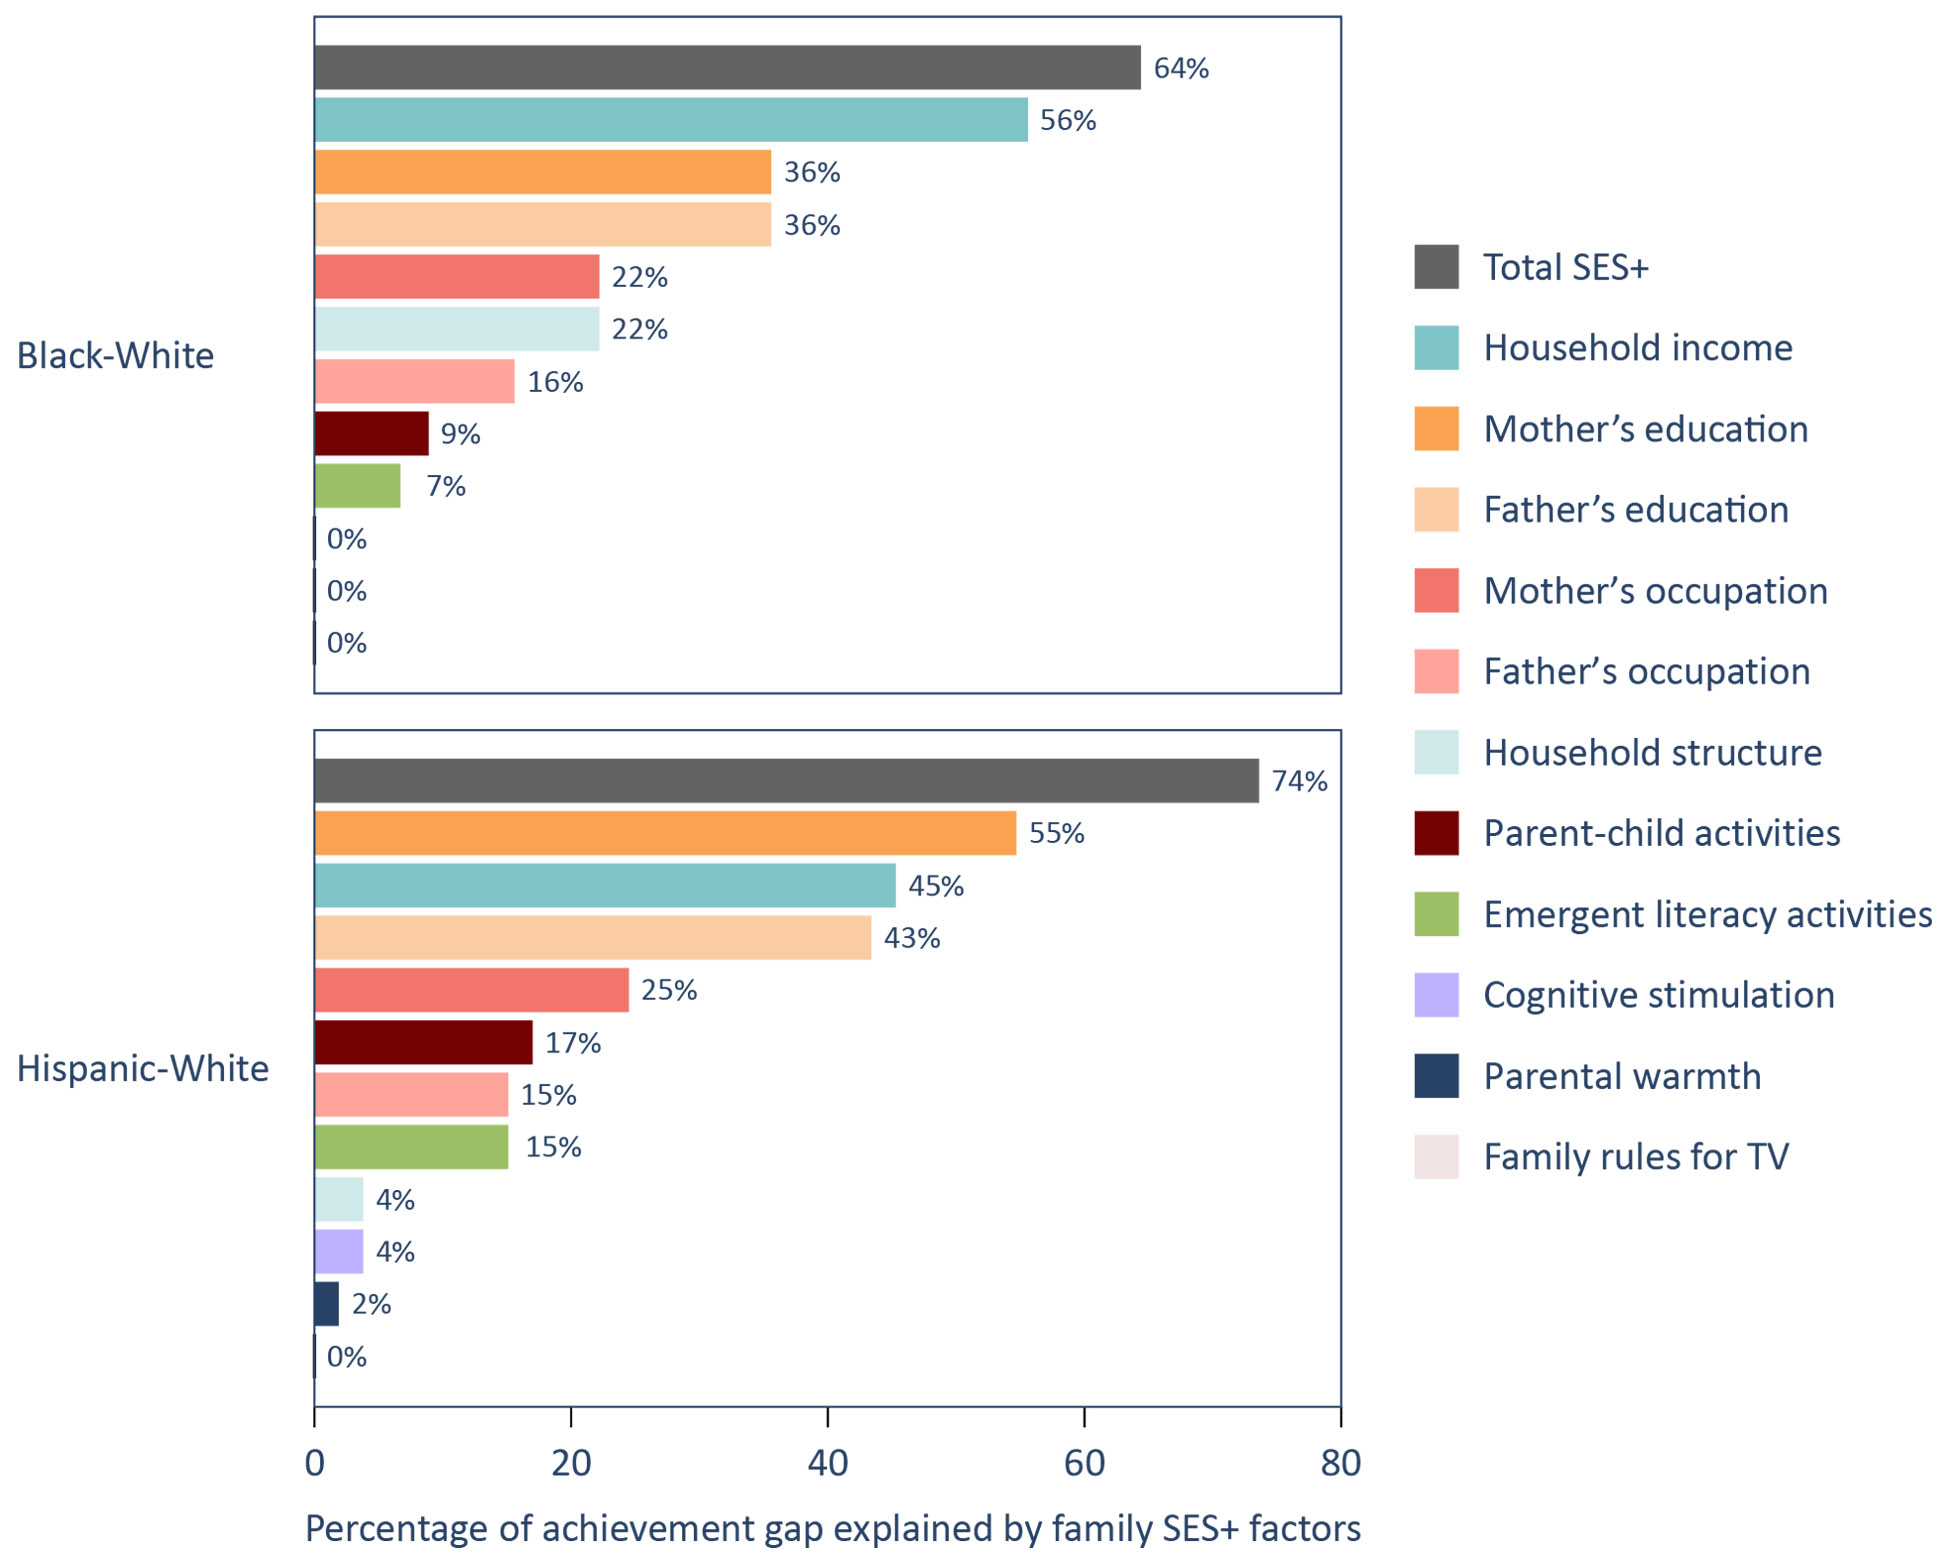
Figure 8. Among individual SES+ factors, household income best explains the Black-White gap in math achievement and mother’s education best explains the Hispanic-White gap.
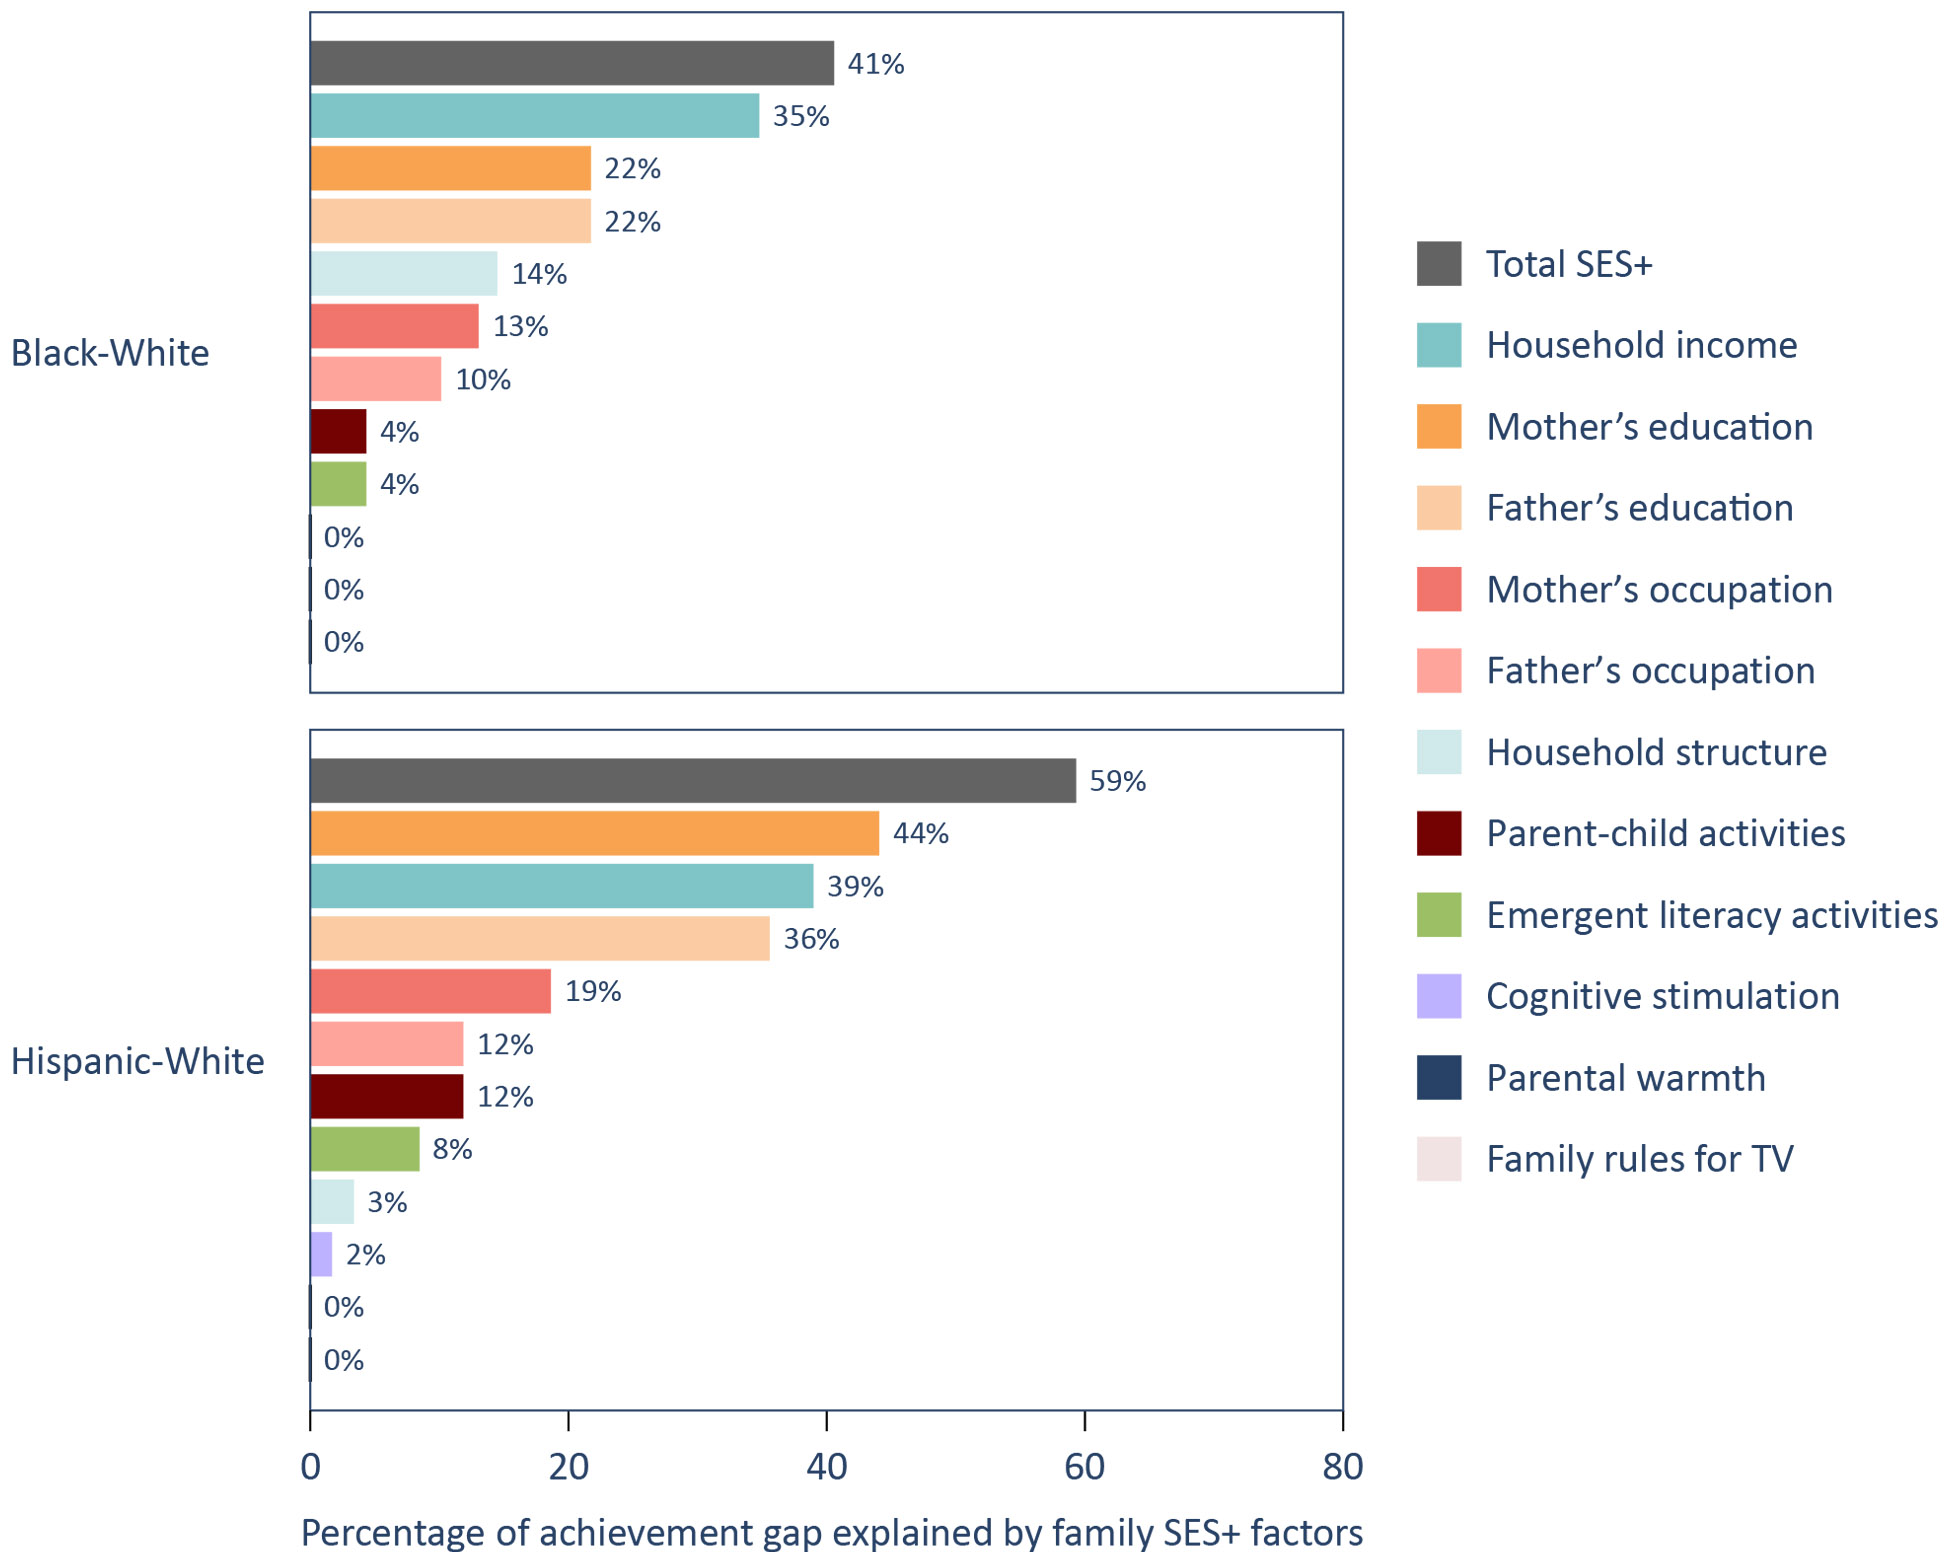
Figure 9. Among individual SES+ factors, household income best explains the Black-White gap in science achievement and mother’s education best explains the Hispanic-White gap.
Finding 3: Family SES+ indicators, and the extent to which they explain racial/ethnic achievement gaps, are stable over time (1998-99 and 2010-11).
Overall, the differences in the results between the two ECLS-K cohorts, which are 12 years apart, are relatively minor, implying that the relations between the variables of interest did not change substantially over this period. These similarities are shown in the analysis above, and they also apply to individual elements of SES+ and the relationships between the SES+ factors.
Table 4 displays the similarities in each component of SES+ across students in the ECLS-K:1998-99 and ECLS-K:2010-11 cohorts. For example, the share of students whose parents had “some college” education is identical across cohorts. However, there were some slight differences. Parental education levels increased between cohorts, with the share of mothers with bachelor’s degrees rising from 16 percent to 20 percent and the share of parents with graduate degrees rising even more (e.g., 5 percent to 10 percent for mothers). The percentage of students living in two-parent households increased from 74 percent to 79 percent between the two cohorts.
Table 4. Family SES+ components did not change substantially across the two cohorts.
|
Multidimensional measures of family SES+ |
ECLS-K:1998-99 |
ECLS-K:2010-11 |
||
|
Mother |
Father |
Mother |
Father |
|
|
%/Mean (SD) |
||||
|
Parental education background |
||||
|
Not high school graduate |
15% |
14% |
14% |
14% |
|
High school graduate |
37% |
38% |
29% |
33% |
|
Some college |
27% |
21% |
27% |
21% |
|
Bachelor’s degree |
16% |
17% |
20% |
20% |
|
Master’s degree or higher |
5% |
10% |
10% |
12% |
|
Parental occupation prestige |
43.10 (11.01) |
42.68 (10.74) |
44.45 (11.87) |
43.14 (10.96) |
|
Household income |
||||
|
$5,000 or less |
3% |
3% |
||
|
$5,001 to $10,000 |
4% |
4% |
||
|
$10,001 to $15,000 |
7% |
6% |
||
|
$15,001 to $20,000 |
7% |
7% |
||
|
$20,001 to $25,000 |
7% |
8% |
||
|
$25,001 to $30,000 |
9% |
5% |
||
|
$30,001 to $35,000 |
7% |
5% |
||
|
$35,001 to $40,000 |
7% |
5% |
||
|
$40,001 to $45,000 |
11% |
3% |
||
|
$45,001 to $50,000 |
4% |
|||
|
$50,001 to $55,000 |
18% |
3% |
||
|
$55,001 to $60,000 |
3% |
|||
|
$60,001 to $65,000 |
3% |
|||
|
$65,001 to $70,000 |
3% |
|||
|
$70,001 to $75,000 |
4% |
|||
|
$75,001 to $100,000 |
10% |
13% |
||
|
$100,001 to $200,000 |
8% |
17% |
||
|
$200,001 or more |
3% |
4% |
||
|
Household structure |
||||
|
Two parents |
74% |
79% |
||
|
Single mom |
21% |
17% |
||
|
Single dad |
2% |
1% |
||
|
Other guardians |
3% |
2% |
||
Table 5 depicts the correlation coefficients demonstrating the relationships between SES+ factors for both cohorts. As discussed above, these coefficients can range from +1 (perfect positive relationship) to -1 (perfect negative relationship). The coefficients in Table 5 range from weak positive correlations (e.g., for household structure and parent educational background) to strong positive correlations (e.g., for mother’s educational background and father’s educational background).
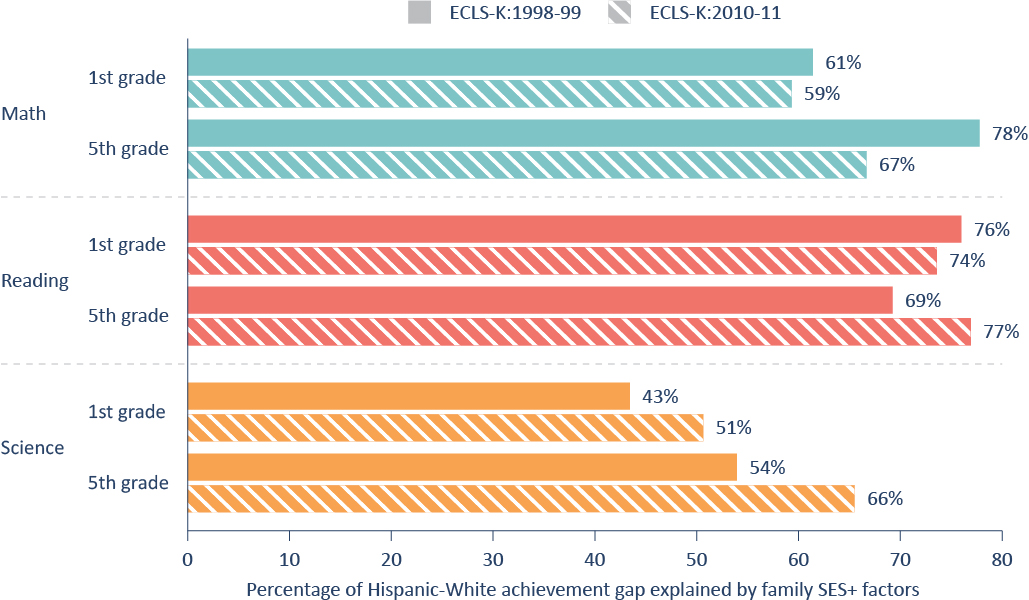
These relations are quite similar across the cohorts, with all correlations between SES+ factors in a similar range from one cohort to the other. For example, the relationship between household structure and mother’s education is 0.16 in the later cohort and 0.19 in the earlier cohort (column 1). The reduction rates, such as those shown in the analysis above, are also stable across cohorts (see Appendix, Figures A1 and A2).
Table 5. Various indicators of family SES+ are moderately correlated with each other across the two kindergarten cohorts.
|
Kindergarten Class of 2010-11 Cohort |
||||||||||
|
|
(1) |
(2) |
(3) |
(4) |
(5) |
(6) |
(7) |
(8) |
(9) |
(10) |
|
(1) Mother’s education background |
|
|
|
|
|
|
|
|
|
|
|
(2) Father’s education background |
0.65 |
|
|
|
|
|
|
|
|
|
|
(3) Mother’s occupation prestige |
0.58 |
0.41 |
|
|
|
|
|
|
|
|
|
(4) Father’s occupation prestige |
0.42 |
0.57 |
0.34 |
|
|
|
|
|
|
|
|
(5) Household income |
0.58 |
0.56 |
0.48 |
0.40 |
|
|
|
|
|
|
|
(6) Household structure |
0.16 |
0.06 |
0.16 |
0.04 |
0.32 |
|
|
|
|
|
|
(7) Cognitive stimulation |
0.10 |
0.07 |
0.04 |
0.03 |
0.03 |
0.01 |
|
|
|
|
|
(8) Emergent literacy activities |
0.23 |
0.21 |
0.14 |
0.13 |
0.17 |
0.05 |
0.41 |
|
|
|
|
(9) Parent-child activities |
0.38 |
0.36 |
0.24 |
0.21 |
0.32 |
0.09 |
0.26 |
0.31 |
|
|
|
(10) Family rules for TV |
0.07 |
0.07 |
0.05 |
0.05 |
0.03 |
0.01 |
0.11 |
0.08 |
0.13 |
|
|
(11) Parental warmth |
0.04 |
0.04 |
0.00 |
0.01 |
0.03 |
-0.06 |
0.20 |
0.12 |
0.10 |
0.08 |
|
Kindergarten Class of 1998-99 Cohort |
||||||||||
|
|
(1) |
(2) |
(3) |
(4) |
(5) |
(6) |
(7) |
(8) |
(9) |
(10) |
|
(1) Mother’s education level |
|
|
|
|
|
|
|
|
|
|
|
(2) Father’s education level |
0.64 |
|
|
|
|
|
|
|
|
|
|
(3) Mother’s occupation prestige |
0.56 |
0.40 |
|
|
|
|
|
|
|
|
|
(4) Father’s occupation prestige |
0.42 |
0.58 |
0.32 |
|
|
|
|
|
|
|
|
(5) Household income |
0.55 |
0.55 |
0.38 |
0.38 |
|
|
|
|
|
|
|
(6) Household structure |
0.19 |
0.09 |
0.12 |
0.06 |
0.36 |
|
|
|
|
|
|
(7) Cognitive stimulation |
0.13 |
0.13 |
0.08 |
0.08 |
0.07 |
0.02 |
|
|
|
|
|
(8) Emergent literacy activities |
0.28 |
0.25 |
0.17 |
0.18 |
0.25 |
0.11 |
0.39 |
|
|
|
|
(9) Parent-child activities |
0.40 |
0.38 |
0.25 |
0.26 |
0.37 |
0.11 |
0.27 |
0.34 |
|
|
|
(10) Family rules for TV |
0.08 |
0.07 |
0.06 |
0.05 |
0.04 |
0.02 |
0.13 |
0.09 |
0.13 |
|
|
(11) Parental warmth |
0.02 |
0.01 |
0.01 |
0.01 |
0.01 |
-0.03 |
0.19 |
0.10 |
0.10 |
0.10 |
Finding 4: The inclusion of family SES+ helps explain racial and ethnic excellence gaps.
Finally, we examine whether the racial/ethnic achievement gaps are moderated by SES+ factors differently based on student performance levels. Differences in the proportions of student groups within the highest education levels are often termed “excellence gaps.”[20] This analysis uses the top quartile as the cutoff point to determine whether each student is an advanced achiever in reading, mathematics, or science in the first and fifth grades. (The analysis is limited to the kindergarten 2010-11 cohort.)
Figure 10 illustrates that family SES+ factors explain 60 percent of the reading excellence gap in the first grade and half in the fifth grade. SES+ factors account for 38 to 45 percent of the math excellence gaps and 36 to 45 percent of the science excellence gaps for Black and White students, depending on the grade.
Figure 10. Family SES+ factors explain 36 to 60 percent of the Black-White excellence gaps.
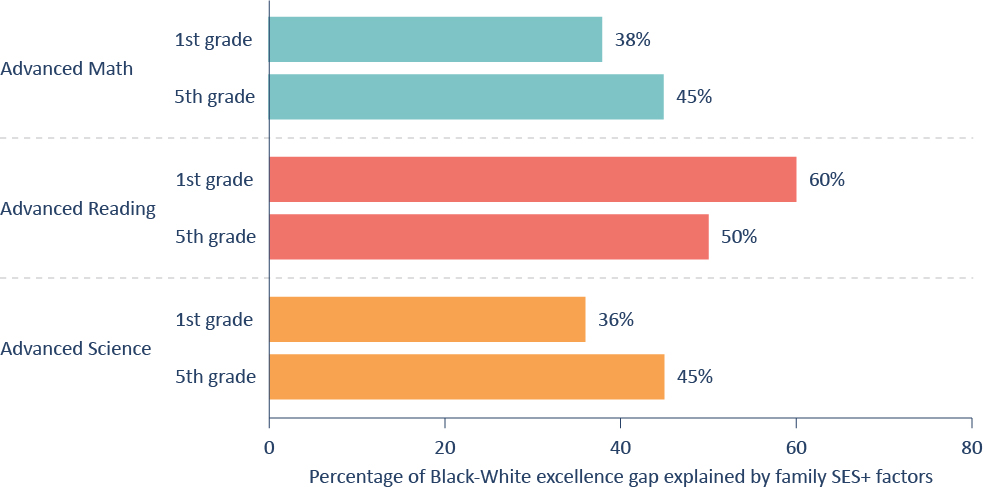
Figure 11 shows that the inclusion of SES+ factors explains a larger share of Hispanic-White excellence gaps than Black-White excellence gaps across the board. More than half of the Hispanic-White excellence gap is explained by SES+ in every subject and grade. Furthermore, more than two-thirds of these gaps are explained by SES+ in reading.
Figure 11. Family SES+ factors explain between 52 and 69 percent of the Hispanic-White excellence gaps.
Discussion
Our findings suggest that students’ SES and home factors help to explain initially observed racial and ethnic achievement gaps. In many cases, the analyzed SES+ factors explain more than half of racial and ethnic achievement gaps. At the same time it is evident that SES, no matter how broadly construed, does not fully explain the racial gaps. SES+ can be less predictive over time, and it was found to be a less explanatory factor for racial than ethnic achievement gaps.
Educational policy solutions should reflect this complexity, as well as the comprehensive nature of the problem. Any number of well-executed policies would likely narrow achievement gaps of all kinds. Below, we present a few ideas, none of which are novel but all of which might help. Most are not cost-neutral. Moreover, we emphasize race-neutral policies in light of our findings, which reveal that family SES+ helps to substantially or fully explain racial and ethnic disparities in achievement. Race-conscious policies might also be helpful in further reducing these achievement gaps.
Whatever the approach, there is no denying the urgency of making the U.S. educational system more equitable.
The following are the proposed solutions:
1. Support programs to help parents earn their high school diplomas or higher education credentials: Because parental education, especially that of mothers, strongly correlates with children’s academic success, policymakers should consider increasing access to adult education and lifelong learning opportunities. This could include funding for adult education classes, online learning platforms, and community college courses.[21]
2. Focus on early childhood education: Because achievement gaps are already evident by elementary school, including as early as kindergarten, investing in high-quality early childhood education programs, especially in underprivileged communities, may be beneficial in mitigating the effects of socioeconomic disparities.[22]
3. Provide economic support and financial aid for low-income families: Income support programs that provide financial assistance should be implemented or enhanced to ensure that low-income families have the necessary resources to support their children’s education.[23]
4. Address racial and ethnic disparities: Policies that directly address the racial and ethnic achievement gaps should be developed and implemented, including the adoption of curricula that reflect diverse cultures and programs that specifically support underrepresented students. There is some evidence to indicate that student-teacher racial and ethnic matching may be of benefit, although whether such matching will address racial and ethnic disparities in achievement during elementary school is still unclear.[24]
The time to act is now. By enacting comprehensive and inclusive policies, we can narrow achievement gaps and create a more just educational landscape for the next generation.
Appendix
This appendix provides further information related to the methodology and supplementary documentation of findings.
Additional Notes on Methodology
Description of Assessment Measures
Reading Achievement. The reading assessment included questions measuring basic skills (print familiarity, letter recognition, beginning and ending sounds, rhyming words, word recognition), vocabulary knowledge, and reading comprehension. Reading comprehension questions asked the child to identify information specifically stated in the text (e.g., definitions, facts, supporting details), make complex inferences within and across texts, and consider the text objectively and judge its appropriateness and quality.
Mathematics Achievement. The mathematics assessment was designed to measure skills in conceptual knowledge, procedural knowledge, and problem-solving. The assessment consisted of questions on number sense, properties, and operations; measurement; geometry and spatial sense; data analysis, statistics, and probability; and patterns, algebra, and functions.
Science Achievement. The science assessment included questions about physical sciences, life sciences, Earth and space sciences, and scientific inquiry. Meanwhile, for ECLS-K:1998-99 dataset, in the spring of first grade, student’s general knowledge was measured, which consisted of items that assessed knowledge in the natural sciences and social studies on a single scale. The social studies subdomain included questions that measured children’s knowledge in a wide range of disciplines, such as history, government, culture, geography, economics, and law. The science subdomain included questions from the fields of earth, space, physical, and life sciences.
Description of Home Opportunity Factors
Cognitive stimulation was a standardized sum of nine questions that assessed the frequency that parents engaged in activities with their children during a typical week. The activities included storytelling, singing, arts and crafts, playing games or puzzles, engaging in science projects or discussing nature, playing with construction toys, performing household chores, exercising or playing sports, and practicing reading, writing, or numeracy skills.
Emergent literacy was a standardized composite score of five items that evaluated literacy activities. Three items assessed the frequency of parental engagement in book reading and picture book reading with their children, as well as the children’s reading activities outside of school. Two items reported the number of books the children owned and the amount of time parents spent reading to their children. We combined the standardized scores of the first three items with those of the final two items to create the standardized composite score.
Parent-child activities was a standardized composite score of six items that assessed the frequency of parent-child engagement in activities over the prior month, including visits to libraries, bookstores, art galleries, concerts, zoos, and sports events. Twelve additional questions evaluated whether children participated in extracurricular activities, such as academic programs (e.g., tutoring or math lab), lessons in dance, music, drama, art, or crafts, organized athletic or club programs, volunteer work, and other forms of instruction (e.g., non-English language classes or religious instruction).
Family TV rules was a standardized composite of three binary questions indicating whether the family had established rules regarding: allowable TV programs, the maximum number of hours children could watch TV, and what time of day children could watch TV.
Parental warmth was a four-item scale that asked parents to self-assess their relationship with their children, specifically assessing their expressions of love, affection, quality time spent together, and child-parent closeness. These items were originally scaled from one to four, indicating “completely true” to “not at all true.” We reverse-coded the responses so that higher scores indicated greater warmth.
Description of Statistical Analyses
We conducted ordinary least squares (OLS) regression using the continuous version of outcomes, where we regressed student’s reading, mathematics, and science achievement from first, third, and fifth grade on student’s race or ethnicity. Then we added different family SES indicators separately, then together, through a serious of models for each grade level and subject. Each model incrementally adds variables to parse out their unique contributions. Model 1 begins with race or ethnicity as the main predictor. Models 2 to 12 added each SES indicator of mother/father’s education background, mother/father’s occupational prestige, household income, and household structure, as well as five indicators of home opportunity factors, separately. Model 13 added all SES+ indictors together. The following equation represents the fully adjusted Model 13:

Then we used 25 percent as the cut-off point to identify students who were high or low achievers. We considered as high achievers those students scoring above the 75th percentile of the academic achievement distribution in a specific grade. We considered as low achievers those students scoring below the 25th percentile of the academic achievement distribution. In this way, our outcomes became dummy variables, and we conducted both OLS and logistic regression models. The modeling strategy is the same as above.
Additional Documentation of Findings
Figure A1. Similar reduction rates of Black-White achievement gaps appear across cohorts.
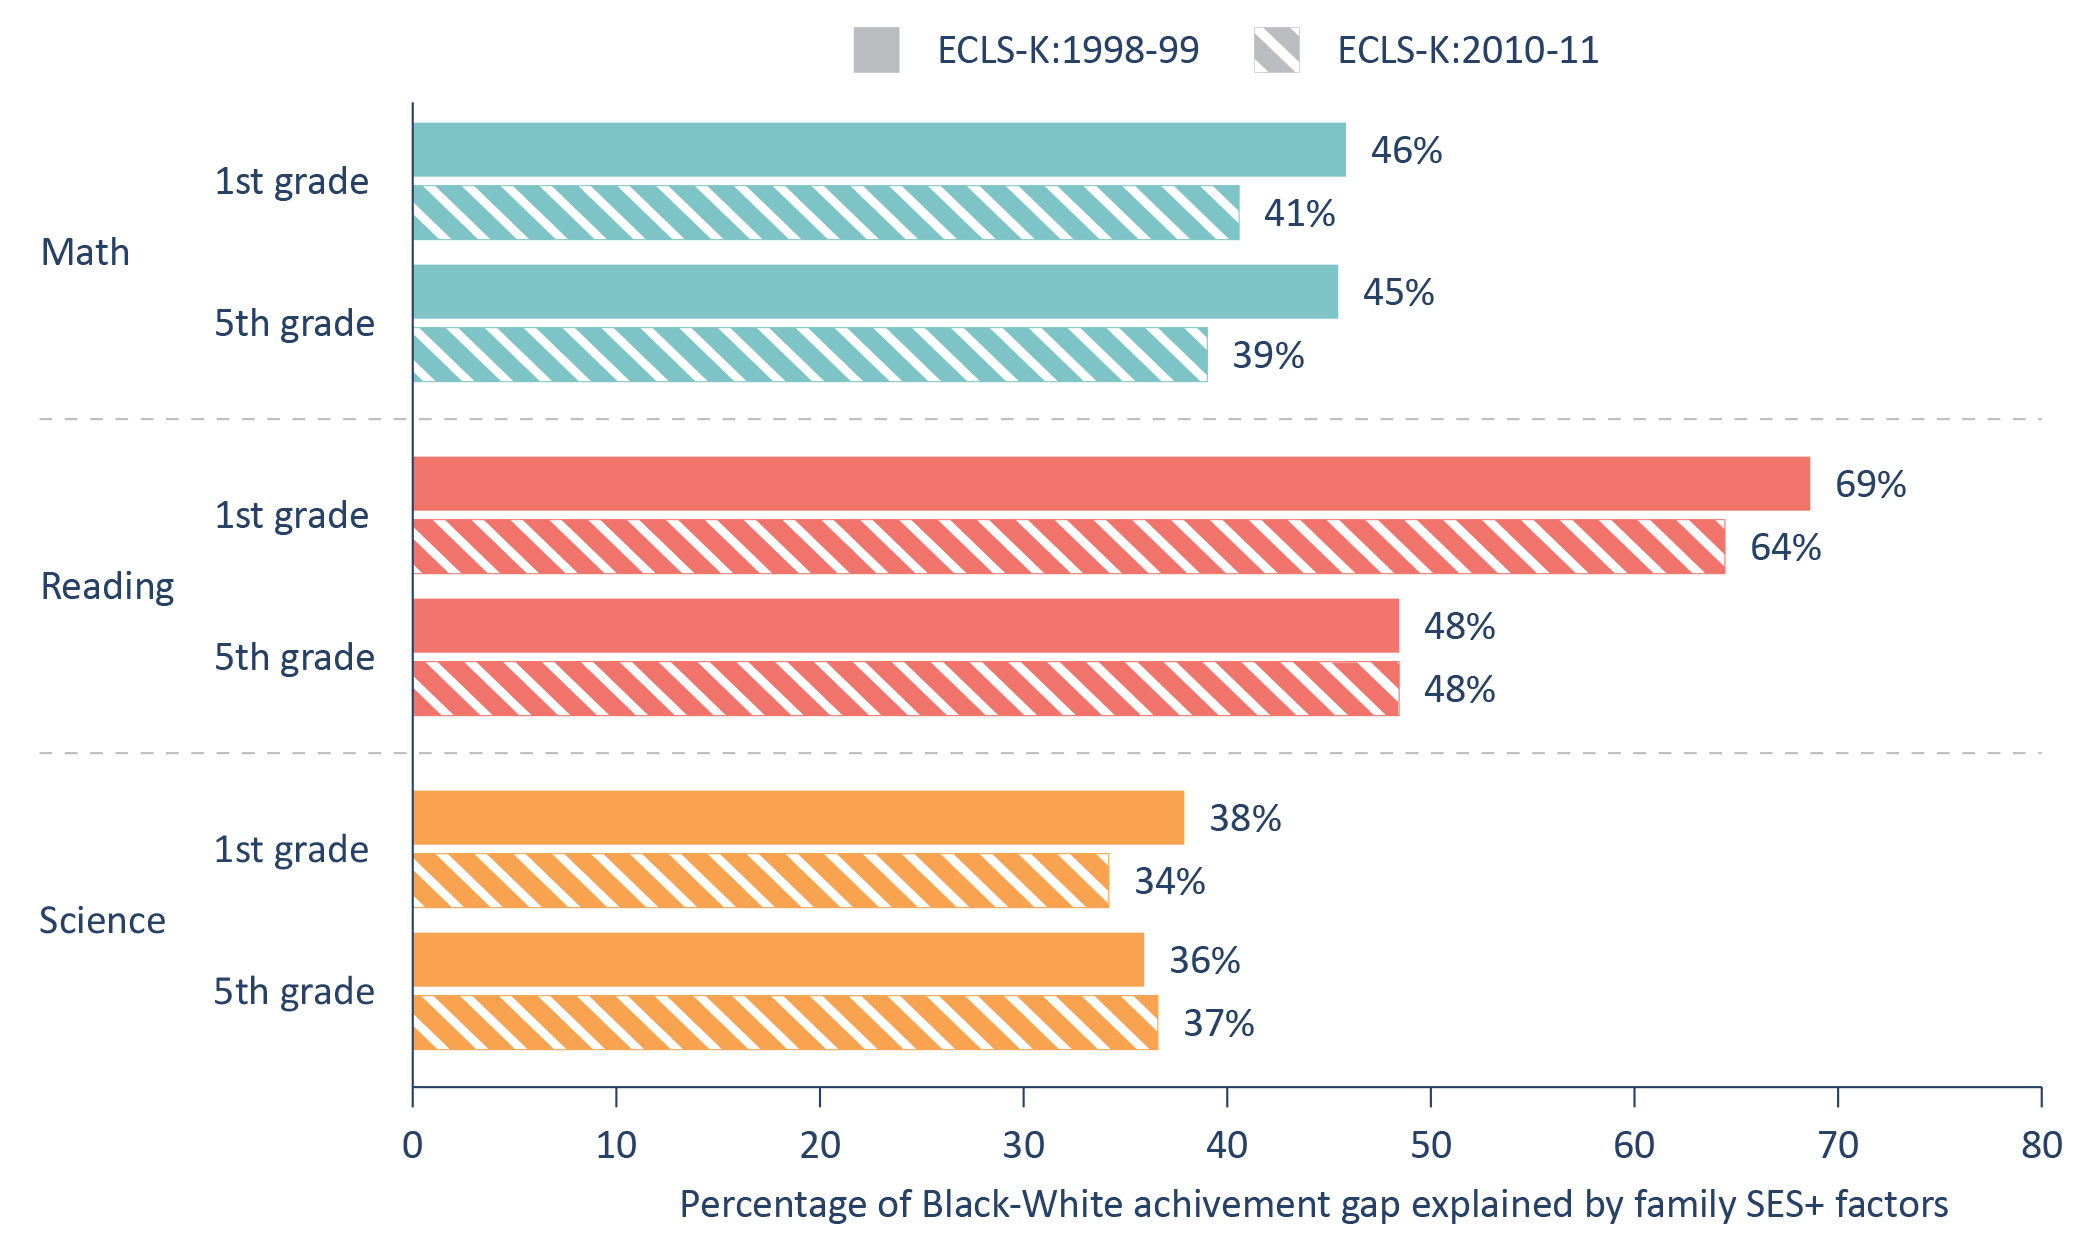
Figure A2. Similar reduction rates of Hispanic-White achievement gaps appear across cohorts.
Endnotes
[1] “Low birth-weight babies by race and ethnicity in United States.” Kids Count Data Center. Accessed: 12 August 2024. https://datacenter.aecf.org/data/tables/9817-low-birth-weight-babies-by…
[2] Barshay, Jill. “Proof Points: Tracing Black-White Achievement Gaps since the Brown Decision.” The Hechinger Report, May 13, 2024. https://hechingerreport.org/proof-points-black-white-achievement-gaps-since-brown/; “Racial and Ethnic Achievement Gaps.” The Educational Opportunity Monitoring Project: Racial and Ethnic Achievement Gaps. Accessed July 29, 2024. https://cepa.stanford.edu/educational-opportunity-monitoring-project/achievement-gaps/race/.
[3] Roland G. Fryer, Jr. and Steven D. Levitt, “Understanding the Black-White Test Score Gap in the First Two Years of School,” The Review of Economics and Statistics 86, no. 2 (May 2004): 447-464, https://doi.org/10.1162/003465304323031049; Megan Kuhfeld, Elizabeth Gershoff, and Katherine Paschall, “The Development of Racial/Ethnic and Socioeconomic Achievement Gaps During the School Years,” Journal of Applied Developmental Psychology 57 (July 2018): 62-73, https://doi.org/10.1016/j.appdev.2018.07.001; Paul L. Morgan, George Farkas, Marianne M. Hillemeier, and Steve Maczuga, “Science Achievement Gaps Begin Very Early, Persist, and Are Largely Explained by Modifiable Factors,” Educational Researcher 45, no. 1 (January 2016): 18-35, https://doi.org/10.3102/0013189X16633182; David M. Quinn, “Kindergarten Black–White Test Score Gaps: Re-examining the Roles of Socioeconomic Status and School Quality with New Data,” Sociology of Education 88, no. 2 (April 2015): 120-139, https://doi.org/10.1177/0038040715573027; David M. Quinn and North Cooc, “Science Achievement Gaps by Gender and Race/Ethnicity in Elementary and Middle School: Trends and Predictors,” Educational Researcher 44, no. 6 (Aug/Sept 2015): 336-346, https://doi.org/10.3102/0013189X15598539; Sean F. Reardon, Joseph P. Robinson-Cimpian, and Ericka S. Weathers, “Patterns and Trends in Racial/Ethnic and Socioeconomic Academic Achievement Gaps,” in Handbook of Research in Education Finance and Policy, 2nd ed., eds. Helen F. Ladd and Margaret E. Goertz (New York: Routledge, 2015); Sean F. Reardon and Claudia Galindo, “The Hispanic-White Achievement Gap in Math and Reading in the Elementary Grades,” American Educational Research Journal 46, no. 3 (Sept 2009): 853-891, https://doi.org/10.3102/0002831209333184
[4] Although Hispanic students may be of any race, throughout this report we simplify the student groupings by referring to Hispanic students of any race as “Hispanic” and non-Hispanic students of other races by their racial category.
[5] Fryer and Levitt, 2004; Reardon et al., 2015; Reardon and Galindo, 2009; F. Chris Curran, “Income-Based Disparities in Early Elementary School Science Achievement,” The Elementary School Journal 118, no. 2 (Oct 2017): 207-231, https://doi.org/10.1086/694218; Daphne A. Henry, Laura Betancur Cortés, and Elizabeth Votruba-Drzal, “Black-White Achievement Gaps Differ by Family Socioeconomic Status from Early Childhood through Early Adolescence,” Journal of Educational Psychology 112, no. 8 (Nov 2020): 1471-1489, https://doi.org/10.1037/edu0000439; Jung-Sook Lee and Natasha K. Bowen, “Parent Involvement, Cultural Capital, and the Achievement Gap Among Elementary School Children,” American Educational Research Journal 43, no. 2 (Summer 2006): 193-218, https://doi.org/10.3102/00028312043002193
[6] Burchinal, Margaret, Kathleen McCartney, Laurence Steinberg, Robert Crosnoe, Sarah L. Friedman, Vonnie McLoyd, Robert Pianta, and NICHD Early Child Care Research Network. "Examining the Black–White achievement gap among low‐income children using the NICHD study of early child care and youth development." Child development 82, no. 5 (2011): 1404-1420. https://doi.org/10.1111/j.1467-8624.2011.01620.x;
[7] See above note 2.
[8] See discussion of using free or reduced school lunch measure as SES here: Domina, Thurston, Nikolas Pharris-Ciurej, Andrew M. Penner, Emily K. Penner, Quentin Brummet, Sonya R. Porter, and Tanya Sanabria. "Is free and reduced-price lunch a valid measure of educational disadvantage?." Educational Researcher 47, no. 9 (2018): 539-555. https://doi.org/10.3102/0013189X18797609.
[9] Reardon et al., 2015; Henry et al., 2020; Pamela E. Davis-Kean, “The Influence of Parent Education and Family Income on Child Achievement: The Indirect Role of Parental Expectations and the Home Environment,” Journal of Family Psychology 19, no. 2 (June 2005): 294-304, https://doi.org/10.1037/0893-3200.19.2.294; Amy J. Orr, “Black-White Differences in Achievement: The Importance of Wealth,” Sociology of Education 76, no. 4 (Oct 2003): 281-304, https://doi.org/10.2307/1519867
[10] Quinn, 2015; Curran, 2017; Nikki L. Aikens and Oscar A. Barbarin, “Socioeconomic Differences in Reading Trajectories: The Contribution of Family, Neighborhood, and School Contexts,” Journal of Educational Psychology 100, no. 2 (May 2008): 235-251, https://doi.org/10.1037/0022-0663.100.2.235; Selcuk R. Sirin, “Socioeconomic Status and Academic Achievement: A Meta-Analytic Review of Research,” Review of Educational Research 75, no. 3 (Fall 2005): 417-453, https://doi.org/10.3102/00346543075003417
[11] See the factsheet provided by American Psychological Association (APA) with additional resources: https://www.apa.org/pi/ses/resources/publications/education
[12] Davis-Kean, 2005; Annette Lareau, “Invisible Inequality: Social Class and Childrearing in Black Families and White Families,” American Sociological Review 67, no. 5 (Oct 2002): 747-776, https://doi.org/10.2307/3088916
[13] ECLS-K: 1998-99; https://nces.ed.gov/ecls/kindergarten.asp
[14] ECLS-K: 2010-11; https://nces.ed.gov/ecls/kindergarten2011.asp
[15] Trained field personnel individually assessed reading, mathematics, and science achievement in each grade using untimed and item response theory (IRT) scaled measures. The assessment process consisted of two stages. The first stage included items of varying difficulty levels that determined the student's initial performance level. This was followed by one of three second-stage assessments that included additional low-, middle-, or high-difficulty items. We used scores from these measures of academic achievement as continuous variables.
[16] Centers for Disease Control and Prevention (CDC). Census 2010 Occupation and Industry Coding Instructions. National Institute for Occupational Safety and Health (NIOSH). August 11, 2011. https://www.cdc.gov/niosh/
[17] For ECLS-K:2011, the household income included 18 categories: 1) $5,000 or less, 2) $5,001 to $10,000, 3) $10,001 to $15,000, 4) $15,001 to $20,000, 5) $20,001 to $25,000, 6) $25,001 to $30,000 … 16) $75,001 to $100,000, 17) $100,001 to $200,000, and 18) $200,001 or more. For ECLS-K, the household income included 13 categories: 1) $5,000 or less, 2) $5,001 to $10,000, 3) $10,001 to $15,000, 4) $15,001 to $20,000, 5) $20,001 to $25,000, 6) $25,001 to $30,000, 7) $30,001 to $35,000, 8) $35,001 to $40,000, 9) $40,001 to $50,000, 10) $50,001 to $75,000, 11) $75,001 to $100,000, 12) $100,001 to $200,000, and 13) $200,001 or more. We treated them as a continuous variable in our analyses.
[18] Very little research on racial and/or socioeconomic gaps considers the role of family structure, so inclusion of this variable fills a hole in the literature that tends to be focused on race, class, and gender differences. For more, see https://www.city-journal.org/article/measure-what-matters
[19] Ordinary least squares (OLS) regression models include adjusted robust standard errors with clustering at the school (kindergarten) level. Multiple imputation is used to address missing data.
[20] Jonathan A. Plucker and Scott J. Peters, Excellence Gaps in Education: Expanding Opportunities for Talented Students (Cambridge, MA: Harvard Education Press, 2016).
[21] U.S. Department of Education provides different kinds of resources under Division of Adult Education & Literacy: https://aefla.ed.gov/.
[22] Schoch, Annie D., Cassie S. Gerson, Tamara Halle, and Meg Bredeson. "Children's Learning and Development Benefits from High-Quality Early Care and Education: A Summary of the Evidence. Research Highlight. OPRE Report 2023-226." Office of Planning, Research and Evaluation (2023). https://www.acf.hhs.gov/opre/report/childrens-learning-and-development-benefits-high-quality-early-care-and-education
[23] Gennetian, Lisa A., and Katherine Magnuson. "Three Reasons Why Providing Cash to Families With Children Is a Sound Policy Investment." Journal of Human Resources 55, no. 2 (2018): 387-427. Sherman, Arloc, and Tazra Mitchell. "Economic security programs help low-income children succeed over long term, many studies find." Washington: Center on Budget and Policy Priorities.” https://www. cbpp. org/sites/default/files/atoms/files/7-17-17pov. pdf (2017).
[24] Paul L. Morgan and Eric Hengyu Hu, “Fixed Effect Estimates of Student-Teacher Racial or Ethnic Matching in U.S. Elementary Schools,” Early Childhood Research Quarterly 63 (Nov 2022): 98-112, https://doi.org/10.1016/j.ecresq.2022.11.003
Acknowledgments
This report was made possible through the generous support of the Achelis and Bodman Foundation and the Thomas B. Fordham Foundation. We are especially grateful to Paul L. Morgan and Eric Hengyu Hu for conducting the analysis and authoring the report. In addition, we extend our appreciation to Andrew Conway, professor at New Mexico State University, and Jing Liu, assistant professor at the University of Maryland, College Park, for their timely and helpful feedback on a draft of the report. We also extend our gratitude to Super Copy Editors for copyediting and Dave Williams for designing the figures and tables. At Fordham, we would like to thank Chester E. Finn, Jr., Michael J. Petrilli, Amber M. Northern and Adam Tyner for reviewing drafts; Heena Kuwayama for assisting with editing; Elainah Elkins for handling funder communications; Victoria McDougald for her role in dissemination; and Stephanie Distler for developing the report’s cover art and coordinating production.
