Statewide laws and policies provide crucial groundwork, but the real action takes place in the classroom. That’s why we at the Thomas B. Fordham Institute want to know: With more than 40 states having passed SOR legislation, what comes next? What will make science of reading laws succeed? Last month, we gathered a team of literacy and implementation experts to get their take. Here’s some of what we learned (check out the whole recording for more).
1. It’s not just “plug and play” from here.
Above all, the experts agree: Education leaders have miles to go before they sleep when it comes to SOR implementation. For states newer to SOR work, “Mississippi Marathon” leader Kymyona Burk cautions against attempts to “plug and play” from another state. Although states can certainly learn from one another, Burk emphasizes the need for each state to examine its own student and teacher data to identify “breakdowns” in understanding and implementation. From there, state leaders can tailor policies to meet the needs of their unique populations.
Even in more seasoned states, however, Instruction Partners co-founder Emily Freitag fears that many policymakers incorrectly “think they did the big work” already. The reality, she says, is that implementation is more complex than scaling practices. How can education leaders figure out what it is they don’t know about implementation? According to Freitag, establishing challenging goals (e.g., 80 percent of kids will read on grade level, with no achievement gaps, within five years) will force more authentic inquiry into how to make SOR ambitions into reality.
Once education leaders have established goals, where should they go next?
2. “Start with teachers.”
Burk suggests that the next move for implementation is to “start with teachers.” That includes training and professional development, of course, but it’s in no small part a matter of building buy-in. When educators have dedicated their careers to teaching a certain way—having been trained that way, truly believing in that way—an isolated training or even a new curriculum is unlikely to change their practice.
To advance SOR, one of the important mindset shifts is around the role of knowledge in reading instruction. For years, the emphasis around reading instruction has been on abstract skills over content. That’s partly because, a decade and a half ago, education leaders wanted to persuade as many states as possible to sign onto the Common Core Standards. In reading, prescribing specific content seemed like a bridge too far—no state wanted to sacrifice so much autonomy—so the compromise was to design Common Core reading standards around skills (e.g., “compare and contrast,” “describe characters, settings, and major events”). An unintended consequence of designing standards (and their aligned assessments) around skills, however, was an overemphasis on abstract “skills” as the goal of instruction. As Freitag said, the message was delivered to a generation of educators: “My job as a teacher or leader is to teach the standards, and one by one I’m going to move through them.”
How can the message be delivered that reading instruction shouldn’t be centered on skills-of-the week?
3. Assessment may help shift this mindset.
Especially amidst a federal emphasis on “returning education to the states,” revamped Common Core standards are unlikely at best. Content-rich curricula can help, but they aren’t enough. As literacy expert Louisa Moats emphasizes, “The material doesn’t do the teaching; the teacher does the teaching.” If they don’t buy into a particular curriculum, individual educators can and often do bypass mandated curricula. (Ask any veteran teacher how we know.)
Educator preparation programs and ongoing professional development are critical, and longtime Core Knowledge advocate David Steiner also highlights assessment as a viable means of reframing educators’ priorities. Because we don’t expect kids to be familiar with any particular content in English language arts, Steiner explains, we test them on abstract skills like “demonstrating understanding,” “inferencing,” and the like. But because this structure necessarily means that students end up being assessed on random passages, the tests end up testing their background knowledge. Think of it this way: In a famous 1980s study, kids who read a narrative about baseball understood it better if they were familiar with baseball. They understood who was involved because they knew what a shortstop was. They understood how “bases loaded” contributed to narrative tension. No amount of skills practice could’ve replaced this knowledge crucial for comprehension.
But, as Steiner notes, if teachers and students know the specific content that will be tested, then they can work to ensure that students are familiar with that content in advance of the assessment. Even in the U.S., with our emphasis on state autonomy, Steiner believes a move to this type of assessment is possible. He notes the success of Louisiana, where over 90 percent of teachers use the same state-vetted ELA curriculum.
Making the change to content-centered assessment wouldn’t be a light lift, but it could certainly help shift how educators perceive their role. If they don’t have any way to predict the content on a reading assessment—as currently is almost always the case—then it makes sense for them to emphasize reading skills. What practical alternative do they have?
Teachers want their students to be successful on assessments, and they know that that’s a core part of their job. If they know certain content will appear on the test, then they will absorb the message that they are responsible for teaching that content. And, as webinar panelist Eric Tucker and his blog post co-author Edmund Gordon argued, a stronger culture of formative assessment can help teachers see what knowledge is sticking along the way. Assessment won’t do it alone, but it can help create the “schema change” that Freitag has called for.
—
In sum, when it comes to the science of reading, states are jumping the gun if they declare victory before classroom practice actually changes. In many states, the policy battles may be won—at least for now—but the “big work” lies ahead.
As 2025 drew to a close, the nation lost two leaders whose careers spanned very different worlds—but whose legacies converged around a shared conviction.
Jim Hunt, who served two stints as governor of North Carolina from 1977–1985 and again from 1993–2001, was one of the most influential education governors of the modern era. Lou Gerstner, the former chairman and CEO of IBM, is widely credited with orchestrating one of the most significant corporate turnarounds of the 1990s.
Amid their many accomplishments, Hunt and Gerstner shared a deep, unwavering belief that education is the linchpin of economic opportunity for individuals and of long-term competitiveness for the nation as a whole. Their passing is a moment not only for reflection, but for reckoning—because the conditions that brought them together nearly three decades ago are strikingly similar to those we face today.
In the mid-1990s, Hunt and Gerstner were prominent voices among a group of visionary governors and CEOs who chose collaboration over complacency. They worked across state and party lines to set a collective agenda for educational improvement tied directly to a vision of economic competitiveness. That effort culminated in the 1996 National Education Summit, which convened more than 40 governors and CEOs from some of the world’s most influential companies.
The summit marked a pivotal moment. Business and policy leaders—Democrats and Republicans alike—came together with a shared sense of urgency and responsibility. They understood that America’s economic future depended on the strength of its education system and the skills of its workforce, and they were unwilling to wait for Washington to solve the problem.
Looking back on that moment, there are striking similarities to this one.
Like today, the mid-1990s were marked by uncertainty and disruption. Leaders faced questions about global competition, economic security, and whether the United States was preparing enough people for the jobs of the future. Resources were constrained. Trust across political lines was thin. And yet there was broad agreement on one essential truth: education and the economy were inseparable.
There was also a shared recognition that while the challenges were national, the solutions didn’t need to come from the federal government. Instead, Governors and CEOs decided to take up the mantle themselves. They believed states were best positioned to act—and that business had a responsibility to help shape the conditions under which talent and innovation could flourish.
Concerns about international competitiveness loomed large. Leaders worried the U.S. was falling behind other countries in preparing workers with the skills needed to drive growth in critical industries. Their call to action—build a world-class education system aligned to economic needs—would resonate powerfully today.
Gerstner, Hunt, and their peers understood that without a highly skilled, well-prepared workforce, the United States could not achieve the competitiveness it sought. They recognized the direct link between economic development and talent development, and that bridging the two required intentional policy and sustained collaboration.
The agenda they forged was ambitious: higher expectations for students, stronger systems to measure performance, and real accountability for results. They believed the country simply wasn’t aiming high enough in its schools to produce the talent that the future demanded.
Importantly, they created a unique table. A bipartisan group of governors sat shoulder to shoulder with CEOs of global companies. Together, they benchmarked U.S. expectations against international peers and allowed states to measure themselves against one another. The result was what could be described as “competitive collaboration”—a dynamic that pushed states to raise standards, build better data systems, and inspire excellence without federal mandates.
And it worked. In the years that followed, all states set higher academic standards, scores on the Nation’s Report Card rose, and students from all walks of life began to receive better preparation for career success.
It took visionary leadership, political courage, and a genuine spirit of partnership between education and business—and across party lines.
Those ingredients are desperately needed again. While there is widespread recognition today that education must be more closely connected to workforce and economic agendas, the mechanisms to realize that vision are weak. Collaboration across state lines exists, but not at anything close to the scale or intensity of the 1990s. The bipartisan spirit that allowed leaders to develop shared solutions while maintaining their own state priorities is largely absent.
And yet the need has only grown.
We are heading into a year in which gubernatorial races will be held in 36 states. A significant number of new governors could take office. What would it look like if they aspired to be education governors in the mold of Jim Hunt? Or of Tommy Thompson, John Engler, and Roy Romer—leaders from both parties who worked across state lines to advance a shared education agenda? What would it look like for more CEOs to embrace a commitment to improving our education system not just as corporate social responsibility, but as an investment in their companies’ growth and the prosperity of our nation?
There are signs of possibility. The current and immediately previous chairs of the National Governors Association, Governor Stitt of Oklahoma and Governor Polis of Colorado, have both focused their initiatives on education. JPMorgan Chase CEO Jamie Dimon recently committed significant resources through the firm’s “security and resiliency initiative,” which aims to dramatically accelerate innovation in areas critical to U.S. competitiveness. That spirit echoes the mindset of business leaders in the 1990s—including the CEOs of Procter & Gamble, Boeing, Intel, Prudential, State Farm, and others—who understood that competitiveness required long-term investment—and that those investments were most effective when made in partnership with states.
The challenges we face today are not confined to any single state or company. As AI reshapes every industry from medicine to manufacturing, business leaders of all stripes are wrestling with how best to meet this moment and ensure that they have prepared talent.
Governors, too, are grappling with common questions: How do we ensure students build strong foundational skills in their K–12 experiences? How do we improve ROI in higher education and strengthen these systems as engines of innovation, research, and talent production? How do we govern more efficiently, align fragmented systems, and reduce bureaucracy? And how do we ensure the workforce can meet the shifting skill demands as a result of AI?
The challenges before us are national in scope, as they were when Lou Gerstner and Jim Hunt joined fellow governors and CEOs to confront the forces reshaping the economy. What mattered then—and what matters now—was not uniformity of approach, but a shared seriousness of purpose and a willingness to take responsibility for outcomes.
Today’s governors and business leaders face a similar moment of choice. Will they treat education as peripheral, or as foundational to growth, security and competitiveness? Will they invest, innovate, and govern with the long view in mind?
The answer to those questions will shape not only our education systems, but the nation’s economic future.
Editor’s note: This was first published by Forbes.
In the past few months, there has been much rending of cloths and gnashing of teeth over the decline in classroom book reading (see here, here, here, and here, for example). Heck, I penned my own lamentation, weeping over how few whole books teachers assign.
In the pages of the New York Times, Dana Goldstein notes that this phenomenon isn’t just standard adult-grumbling about young generations. The average number of books assigned per year really has dropped.
The accused are numerous. Karen Vaites blames publishing companies, who hawk excerpt-heavy textbooks for a tidy profit. It’s probably safe to lay much blame at the algorithmic feet of social media and AI. Others harangue standards-based reform. And I cast aspersions at teacher professional organizations that explicitly encourage English teachers to decenter book reading from their classes.
However, I come here today not to sift and winnow between the causes of reduced reading loads or suss out whether there really are fewer books in English classes. Rather, I want to push back on the pushback a bit.
My book-loving credentials are in order. I spent my time in schools as an English teacher and an administrator in the classical education world. To Kill a Mockingbird, Of Mice and Men, Animal Farm, The Odyssey—I lived and breathed these books for years. I read them out loud with students, savored the language, assigned chapters, assessed comprehension, broke down beautiful lines and metaphors, and tested and measured student understandings.
But I assigned writings other than novels, too: speeches, poems, short stories, and essays. These have as much value as a complete book.
I agree with Doug Lemov and others that longer works—plays, novels, epic poems—ought to be the core of any English class. Length allows for more complex characterization and plotting, demands more of students, and facilitates coherent, extended units. But shorter works have their own value.
For example, with my sixth graders, I included a unit on Romantic poetry—think nature and short lyrics, not roses and hearts. I couched it between more difficult novel-length studies as something of a curricular reprieve. Short works break up the year and pace out the rigor. After finishing a final exam and before picking up another dense, heavy novel, we spent just a few weeks delighting in verse.
Over the course of studying a novel, students experience one author. Through a unit on Romantic poetry, students read Blake, Wordsworth, Coleridge, Longfellow, Shelley, and others. They encounter compelling metaphors, rhythm and rhyme, complex language, and beautiful images in condensed, accessible bites that could get overlooked in the waterfall of text in a novel.
It’s also worth reading many short works simply because they are great in themselves. In the lead up to Halloween every year, I had my seventh graders read Edgar Allan Poe. They let out an “eewww” in the final lines of Annabel Lee. They winced at the thought of the Pit and the Pendulum. They fell silent at the haunting image of party-goers falling, one by one, into a bloody seizure as humanity goes extinct at close of the Masque of the Red Death.
Edgar Allan Poe—though I’ll be the first to admit that his prose is at times needlessly verbose and turgid—crafted a compendium of mythological imagery akin to the images of Sisyphus or Icarus. The beating heart of guilt under the floor boards, an unstoppable scythe swinging ever closer to bring death, a chained man bricked into a tomb—these are literary images that stand the test of time.
Plenty of other short works have equal value. What would a high school education be without A Letter from Birmingham Jail or What to a Slave is the Fourth of July? Should we not introduce Emily Dickinson, Robert Frost, and Langston Hughes to our students that their verse might be a companion to them? Should we keep Gettysburg, I Have a Dream, or Washington’s Farewell from students because they’re each only a few pages long?
To be fair, I know that no one who penned the aforementioned protest over the decline of book reading in classrooms would argue that students should only ever read books. But seeing as the pendulum of education policy and fads ever swings too far, it’s worth pausing for a moment to acknowledge the benefits of short works. As a happy medium in discipline would settle somewhere between “suspension for checking the clock” and “here’s a bag of chips for punching your teacher,” so the literature classroom should settle between “no novels” and “only novels.”
Fundamentally, the English classroom exists for twin purposes: improve literacy and introduce students to the best that has been thought and said. An English classroom that includes no novels or only excerpts fails miserably at that dual purpose. But the villain here is the complete lack of novels and the tendency to include only excerpts. Short stories, poems, and speeches—these are not the bad guy in this storyline.
Last month, punditsdebated the validity of Mississippi’s remarkable gains in student achievement. In the January 2026 issue of Significance, statisticians invoke David Hume and Immanuel Kant while questioning the idea that Mississippi produced improvements for its children, instead arguing that selection bias and tricky math—driven by excluding struggling students from testing cohorts—is behind rising scores. They suggest paltry spending on reading interventions in Mississippi compared to national per pupil spending is particularly suspect. The authors narrow in on third-grade retention policies as the source of artificially inflated achievement. Do retention policies make cohorts appear stronger without real gains, or do they actually drive improvement?
A new working paper by economist Sakib Mahmud breaks down how third-grade reading retention policies impact student outcomes—and not just in Mississippi. He doesn’t set out to settle the debate on retention-cohort samples, and the analysis was conducted before the recent round of statistical disagreements. Still, the findings suggest improvements reflect real learning rather than testing low-performing kids a year later.
Using a staggered-adoption difference-in-differences design, Mahmud analyzes retention policies in Arizona, North Carolina, and Ohio beginning in 2013–14 and in Mississippi starting in 2014–15. Each state implemented literacy reforms during this time period, including statewide third-grade retention policies. He relies on 2010 to 2019 data from SEDA (Stanford Education Data Archive), which creates a uniform scale of state and district scores aligned with NAEP to assess academic trends.
The first comparison looks at student outcomes in retention-mandate states compared to places without statewide policies during the study period. The retention states show improvement in fourth grade reading scores compared to states without retention policies (0.07 to 0.10 standard deviations, a range that’s both statistically and practically significant). Further, duration appears to matter, with post-treatment estimates indicating sustained improvement over time. He also adjusts for Mississippi’s policy timing—the state announced the Literacy-Based Promotion Act in 2013, giving schools extra time before implementing the retention mandate in 2014–15. It appears the preparation period led to even larger gains (0.159 standard deviations).
Isolating the state retention mandate by comparing to states with similar literacy reforms where retention policies are determined at the local level allows Mahmud to examine whether the retention policies are responsible for student gains. Here, the effect almost disappears in Arizona, North Carolina, and Ohio (0.001 standard deviations for this group). Only Mississippi shows a positive and statistically significant improvement due to its state-mandated retention policy specifically, but the effect size drops dramatically to about 0.04 standard deviations in mean language arts scores. In other words, retention played a role, but it wasn’t the primary driver of the state’s improvement.
Retention is never the first choice when a young student struggles to develop critical skills. In Mississippi, it was a piece of a much larger slate of interventions that included progress monitoring, teacher training, and individualized support via literacy coaches. Mahmud indicates that it is this comprehensive approach, rather than the standalone impact of the retention policy, that drives improvements—findings that support insights from the professionals who developed and implemented Mississippi’s reforms. Don’t call it a miracle, they insist, but rather the result of sustained commitment to evidence-backed strategies. As Mahmud writes, success in Mississippi is “primarily due to the intensity of its implementation” rather than the retention policy. Improvements began before the 2014–15 retention policy, when state legislators demanded improvement and backed up that demand with a $15 million annual allocation to support teacher training and other interventions. This amount may seem small to statisticians working outside K–12 education, but it was a substantial commitment in one of the country’s poorest states and appears to be one that led to measurable gains.
There’s no singular solution for improving early literacy. In this study, state retention mandates in Arizona, North Carolina, and Ohio did not appear to increase the effectiveness of their comprehensive reform efforts. Mississippi is different, but not because the state is manipulating student data to create a mirage of improvement. Rather, the evidence suggests that Mississippi’s state-level leadership and significant financial investment—before the retention policy began—drove its improvements in reading. Sustained commitment to evidence-based literacy instruction, coupled with this support, matters far more for student success than state-mandated third grade retention.
News stories featured in Gadfly Bites may require a paid subscription to read in full. Just sayin’.
National School Choice Week is still 10 days away, but every reporter and commentator around here seems to be talking about choice right now. Some talking truth, some talking smack. Either way, I love a hot topic. Let’s dig in!
Andrew Campanella, CEO for NSCW, has an op-ed in the Portsmouth Daily Times today discussing the under-appreciated topic of school choice in rural areas. “Families in small towns may find that their education options feel more limited than those available in larger cities. But that does not mean meaningful choices do not exist,” he concludes. “If you are considering a change—whether your child is entering a new grade level, you are looking for a better fit, or you simply want to understand what is available—taking time now to explore your options can be worthwhile. You may be surprised by what you find, and the right choice could make a lasting difference for your child’s future.” (Portsmouth Daily Times, 1/13/26)
You know what else might be a revelation to Cleveland.com readers? A history of all the non-voucher public funding provided to private schools in Ohio for the last 60-some years. This includes textbooks, transportation, administrative support, and more to the tune of millions of dollars every year since before I was born. All without a peep from these Johnny-Come-Lately voucher grouchers. Unfortunately, former legislator Mike Curtain doesn’t manage to get to any of that in his 240-year anti-voucher history lesson/op-ed…despite the fact that his status as emeritus editor of the Dispatch clearly allows him to ignore the editorial word limit that every other pontificator has to obey and to yap about whatever history he cares to include for as long as he wants. Nice perk, amiright? (Columbus Dispatch, 1/14/26)
Dual-enrollment programs have long provided students with opportunities to take advanced courses and earn college credit during high school. This can give students a head start on college and possibly defray higher education costs by allowing them to earn a degree in less time.
Understanding the potential benefits, Ohio lawmakers revamped the state’s dual-enrollment program in 2015 and rebranded it College Credit Plus (CCP). The overhaul generally aimed to increase access to college-level coursework and encourage greater student participation. For instance, schools are now required to provide students with program information and counseling, and students as early as seventh grade may participate (previously, it had been limited to grades 9–12). Policymakers also encourage dual enrollment through the report card system, as districts receive points on the post-secondary readiness measure when students earn college credits. State officials routinely champion the program and tout its benefits.
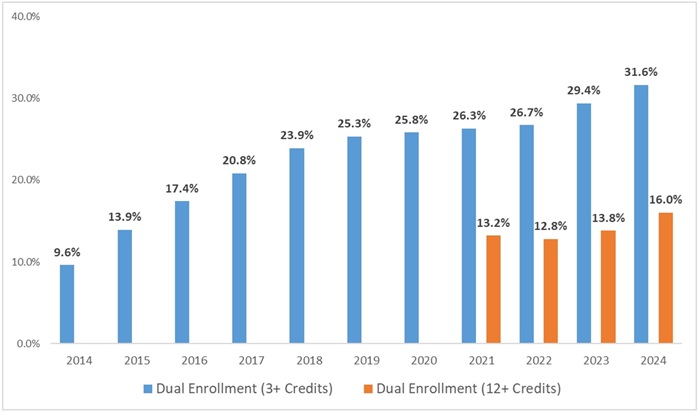
Buoyed by these policy developments, participation and attainment numbers have skyrocketed. Prior to 2015, roughly one in ten students earned at least three college credits through dual enrollment. Now, just over 30 percent of students exit high school with three or more credits, and about half that number—16 percent—earn almost a semester’s worth of college credit (twelve or more).
Figure 1: Percentage of students earning college credits via dual enrollment, graduating classes of 2014 to 2024
Source: Ohio Department of Education and Workforce. Note: The percentage of students earning 12 or more credits was first reported for the class of 2021.
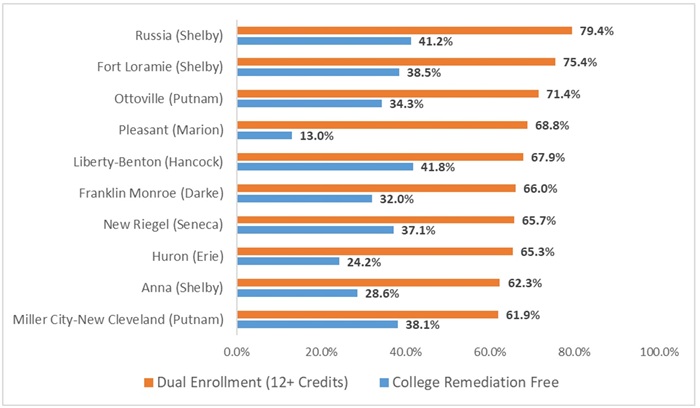
At first blush, the rapid rise of college credits being earned in high school might seem like cause for celebration, as more students are now earning credits that could put them on the fast-track to degrees. But there are also concerning signs in the data. In some districts, substantial numbers of students who are not actually “college ready” are participating in CCP and stockpiling college credits. Consider the figure below, which shows the ten districts with the highest percentage of students earning 12 or more credits, along with the percentage of students earning a remediation-free score on the ACT or SAT. These scores are established by the presidents of Ohio’s colleges and are based on research that relates scores to students’ likelihoodof success in freshman-level coursework. We notice large disparities in the two rates. In Russia Local, 79 percent of its graduating class earned 12 or more dual-enrollment credits. Yet just 41 percent of the class met remediation-free standards. In Pleasant Local, 69 percent of students received nearly a semester of credit, even though a scant 13 percent achieved a remediation-free score.
Figure 2: Percentage of students earning 12 or more college credits versus college remediation-free rates, graduating class of 2024
Source: Ohio Department of Education and Workforce. Note: The districts that appear on this chart are largely rural and small town; their counties are displayed in parentheses. Data are not reported on the types of courses students completed; an exact count of non-college-ready students who earn college credit is not possible given the data made publicly available.
What gives? How can students who haven’t met the remediation-free bar rack up so many college credits?
The answer lies in a policy loophole that allows non-college-ready students to participate in CCP. Under state law, students are eligible for the program if they achieve a remediation-free score on the ACT, SAT, or a handful of other alternative tests. So far, so good. Strict adherence to that entrance standard would ensure that only students who demonstrate clear academic readiness are allowed to take college-level courses. But here’s the twist: Under state administrative rules (authorized by statute), students can bypass exam-based standards and qualify for CCP based on their grade point average (GPA). Specifically, students are eligible if they have either a cumulative high school GPA of 3.0 or higher, or a 2.75–3.00 GPA and an A or B in a loosely defined “relevant high school course.”
In an era of rampant grade inflation, it’s not hard to imagine large numbers of marginally proficient students getting A’s and B’s, and thus qualifying for CCP through these alternative routes. This raises some thorny questions. Are CCP courses—mostly taken in high schools or online—truly college-level? Or are students taking courses that have been watered down for the sake of those who aren’t academically prepared, making them “college” classes in name only? And how will these students fare when they need to pass upper-level courses to complete their degree? Are we setting them up for failure if and when they continue their post-secondary education?
From the inception of CCP, Fordham has (unsuccessfully) urgedmore stringent eligibility requirements. Strong entrance standards would ensure the program is geared to academically prepared students and provides challenging, college-level content. Remember also that front-end requirements are especially critical in dual-enrollment settings because, unlike AP or IB programs, students are not required to pass a standardized exam at the end of the course to earn credit. Course credit in CCP hinges on the grades of teachers, who may not hold to rigorous standards.
Given that hundreds, possibly thousands, of non-college-ready students are availing themselves to CCP, Ohio policymakers should tighten eligibility requirements. One option is to simply remove the GPA-based alternatives and establish a strict college remediation-free standard based on exams. A more relaxed option might allow students to participate in CCP if they score within one standard error of the college remediation-free scores and have an unweighted high school GPA of 3.0 or above.[1]
Awarding college credit is serious business. It should be earned based on mastery of rigorous college-level material. But when non-college-ready students are racking up credits, it makes you wonder whether Ohio has set the dual-enrollment bar too low.
[1] This is a slightly modified version of Ohio’s earlier CCP eligibility requirements. In all variations of CCP policy, including the current one, students must meet a college’s admissions requirements, though these may not be very stringent for open-access two-year institutions.
Economist Joel Mokyr, who won the Nobel Prize in 2025, asks why some societies generate sustained economic growth while others, with seemingly similar resources and institutions, do not. At a time of great uncertainty about our social and economic progress, his question feels urgent.
In A Culture of Growth, he argues that economic growth depends not just on capital accumulation and literacy. Instead, the key is something subtler: the accumulation, transmission, and exploitation of “useful knowledge,” supported by cultural norms that value truth-seeking, experimentation, and the application of ideas to practical problems. Growth happens when societies create the conditions under which knowledge actually compounds, not just by sending more people to school for more time.
Mokyr’s insight rests in part on research by development economist Lant Pritchett. In 2001, he asked a very discomfiting question for those of us in the school business: “Where Has All the Education Gone?” Examining decades of global data, Pritchett found that the dramatic expansion of years of schooling, across much of the world in the second half of the twentieth century, did not reliably translate into faster economic growth.
To be clear, Pritchett and Mokyr both agree that education matters. There are tons of evidence that, for individuals, schooling raises wages and life chances. But those who advocate for policy interventions must ask why large, well-intentioned investments in mass schooling haven’t delivered the kind of broad-based economic or civic returns we hoped for.
Since 2001, Prittchett’s critics have emphasized a simple point: What schools teach—and whether students actually learn it—matters most. The goal must be building knowledge that can be used productively, both at work and as citizens. In many contexts, we reward credentialing rather than competence—producing, most recently, college freshmen who struggle with remedial math or can’t sustain reading complex books. In far too many cases, what looks like “education” on paper doesn’t produce either deep learning or civic engagement.
Reading this with Mokyr in mind, I couldn’t shake the feeling that we’ve been having a parallel conversation (often without realizing it) in K–12 education. For readers familiar with E.D. Hirsch, who has long argued that shared background knowledge is essential for literacy and civic participation, this sounds familiar. But Mokyr adds a deeper—and timely—claim: that shared knowledge is not only socially binding, but epistemically productive. It is the foundation of a truth-seeking culture that allows societies to generate, test, and improve ideas over time.
For decades, we have expanded American schooling in exactly the ways Pritchett would predict might disappoint at scale. More standards. More assessments. More emphasis on generalized skills like critical thinking and problem-solving. Reading strategies that we mistakenly believe transfer across subjects. And yet, we continue to see stubbornly flat outcomes in reading comprehension, history knowledge, and civic understanding. It’s not that schools aren’t trying. It’s that activity and alignment have come to substitute for the accumulation of knowledge.
Here’s where Mokyr’s argument becomes unexpectedly relevant to elementary education.
Mokyr shows that growth depends not just on access to education, but on what kind of knowledge is being built and how coherently it is transmitted. Useful knowledge, in his sense, is cumulative. It stacks. It provides a foundation for further learning and application. Without that foundation, societies can look busy and educated without becoming more capable.
Mokyr also emphasizes an idea that has become a third-rail in education debates: truth-seeking, not just as a civic virtue, but as a social mechanism. His claim is that growth depends not just on creativity or critique, but on norms that allow societies to distinguish better ideas from worse ones. That focus is distinct from the argument for knowledge as cultural literacy alone; Mokyr is describing the conditions under which knowledge becomes self-correcting and cumulative.
That distinction matters enormously for schools. Far too often “critical thinking” is treated as a general skill, detachable from subject matter. But without background knowledge—shared facts, concepts, and reference points—there is very little to think critically about or to evaluate as true or false. Skepticism without knowledge collapses into opinion; analysis without content becomes performance. In practice, truth-seeking requires familiarity with a domain before judgment is even possible. Kids cannot evaluate historical claims without history, scientific arguments without science, or texts without vocabulary and context. Content is a precondition of critical thinking, not its enemy.
Yet in the early grades, especially K–5, we often do the opposite. We prioritize skills divorced from content. We treat knowledge as interchangeable, or worse, as a distraction from “learning how to learn.” Far from stifling curiosity, shared knowledge gives students something meaningful to be curious about.
This challenge is particularly acute for disadvantaged students. Less likely to accumulate cultural capital at home, they depend more heavily on school—especially K–5—to lay that foundation. A skills-based approach denies these kids the very thing that makes schooling productive.
This is the primary and secondary school analogue of Pritchett’s puzzle. Education goes in. Human capital doesn’t reliably come out.
Mokyr’s life has been dedicated to explaining how countries that take seriously the production, transmission, and application of knowledge expand economic opportunity for all their citizens. It follows, therefore, that elementary education is not peripheral to economic and civic life. It is foundational. K–5 is where we decide whether our schooling “investments” are the equivalent of crypto or ideas that are built to last. Whether these investments will actually compound over time or fail to beat even inflation.
The implications are not especially ideological, but they are demanding. Being serious about education’s contribution to growth means being serious about curriculum. It means asking not just whether children are “engaged” or “thinking critically,” but what knowledge they are accumulating, how coherent it is across grades, and whether it prepares them to read widely, reason carefully, and participate meaningfully in civic life.
That can sound old-fashioned when many experts demand we focus on “21st century skills.” But Mokyr’s work reminds us that societies do not advance by cultivating skills in the abstract. They advance by building institutions, like schools, that take truth seriously, transmit knowledge coherently, and allow ideas to compound over time. If we want education to deliver on its economic and democratic promise, especially at scale, we can’t treat content as optional enrichment. It must be understood as the mechanism by which schooling actually works. The question is not whether students should think critically, creatively, or independently—but what they need to know to do so in ways that are meaningful, truthful, and durable.
The growth question, it turns out, begins in elementary school.
The value of annual state testing continues to be subject to debate, with skeptics claiming that the test results provide minimal value. This report examines the predictive value of Ohio’s state tests: Are students’ test results linked to college attendance and completion?
Conducted by Stéphane Lavertu, the analysis finds that test scores are predictive of post-secondary education outcomes. For more details, read the report below or download the full report, which includes technical appendixes and supplemental data.
Foreword
For more than two decades, Ohio has gauged students’ math and reading skills through a state assessment program. These tests serve important purposes. They provide essential transparency about student performance so that citizens and communities can check the progress of their local schools and understand the return on their taxpayer investment. They offer education leaders and analysts hard data about pupil outcomes, allowing them to track academic improvements and evaluate programs. They give parents objective information about their child’s performance against state standards, something that has gained importance as report cards become chock full of A’s and B’s.[1]
But do state exams also predict college attendance and completion? This is a key question, especially for parents, many of whom wish to see their children pursue post-secondary education and attain degrees.[2] If exams are reliably predictive, parents could be encouraged to start planning for college (if results indicate being on track) or seek help if scores are not as strong as expected.
This study finds that Ohio’s state tests do indeed predict four-year college attendance and degree completion. For instance, approximately four in five students scoring “advanced” on the state’s Algebra I and English 2 exams went on to attend four-year colleges, a considerably higher college-going rate than those scoring at lower achievement marks. Similar relationships emerge between eighth grade test results and college outcomes.
We understand that these results won’t surprise most experts in the field. However, by confirming the link between test performance and college outcomes, this report should give parents and policymakers greater confidence that Ohio’s state exams provide solid information about students’ post-secondary prospects. The analysis goes one step further and shows that improving students’ test scores is also related to increased college attendance and completion. This indicates that no single test score is destiny. That’s where parents and educators—acting on the data—can intervene and change students’ academic trajectories.
Overview
Policymakers across the political spectrum have long championed the use of statewide tests to monitor whether Ohio students are on track for future success. The educators and subject experts who developed Ohio’s learning standards, to which state tests align, assert that these standards capture the knowledge and skills students need to succeed in college and careers. Consequently, by administering state tests annually starting in third grade, parents, teachers, and principals can identify struggling students who need help getting on a path to college and career opportunities, and they can identify high-achieving students who might benefit from enrichment and acceleration to realize their postsecondary potential. Annual tests also provide state leaders with information about the effectiveness of Ohio schools and the return on investment for taxpayers.
Extensive evidence indicates that students with higher scores on standardized math and English tests do, on average, have better life outcomes, including higher rates of college attendance and graduation.[3] But we don’t know the extent to which scores on Ohio’s state tests predict such longer-term student outcomes. This report answers that question by examining how scores on Ohio’s eighth-grade tests and high school end-of-course exams in math and English correspond to student attendance and graduation from four-year colleges and universities.[4] It also examines whether test-score growth since third grade (the earliest grade of statewide testing) is associated with these postsecondary outcomes.
The results indicate the following:
Higher scores on Ohio state tests predict higher rates of college attendance and graduation. For example, 41 percent of students who score at the Accomplished level on the Algebra I end-of-course exam go on to graduate from a four-year college or university within five years of completing high school, whereas 18 percent of students scoring at the Proficient level reach that milestone. The results are similar for math and English exams administered in eighth grade and high school.
Greater growth in test scores as students progress through school predicts higher rates of college attendance and graduation. For example, students whose test-score growth from third grade to high school was at approximately the 70th percentile were 6 to 7 percentage points more likely to graduate from a four-year college within five years of finishing high school than similarly achieving third-graders who had more typical (50th percentile) test-score growth from third grade to high school. Growth at the 70th percentile is roughly equivalent to the achievement gains a student would have if they attended a school from fourth grade through high school that, every year, had a four-star Progress rating instead of a three-star Progress rating on Ohio’s school report cards.
The analysis makes clear that current Ohio state tests are useful for assessing whether students are on track to attend and graduate from four-year colleges and universities. It also demonstrates the benefits of continuing to administer tests annually to monitor progress, as student test-score growth is also predictive of college-going and completion.
Data
The analysis employs student-level data to examine the relationship between scores on state tests and postsecondary attainment. It focuses on Ohio state tests in math and English that students typically take in the spring of eighth grade, as well as end-of-course exams (EOCs)—Algebra I and English Language Arts 2—that students typically take at the end of ninth and tenth grade, respectively. Post-secondary attainment is captured by students’ rates of attendance at four-year colleges and universities (in or out of state) within two years of their projected graduation from high school, as well as their rates of graduation from four-year colleges and universities within five years of high school graduation. The analysis employs a sample of students who had at least one third-grade test score and who were in ninth grade in 2014–15 or 2015–16, as that enables the observation of students five years after their expected high school graduation.[5]Appendix A provides additional information on the data and descriptive statistics for the four student samples used in the analysis below.
Part 1: Performance Levels and Post-Secondary Attainment
This analysis first considers college attendance and graduation rates for students who scored at each of five performance levels that are tied to Ohio learning standards: Limited, Basic, Proficient, Accomplished, and Advanced. Table 1 provides more information on these designations, as well as links to web-based resources that describe in detail the knowledge and skills that the performance levels capture for each Ohio state test (OST).
Table 1. Performance-Level Descriptions according to Ohio Educators and Content Experts
Note. The descriptions of performance levels are from guides that the Ohio Department of Education & Workforce makes publicly available here. The information in this table is based on a guide called Understanding Ohio’s State Tests Score Reports. Detailed Performance Level Descriptors are also available for each test. The proportion of students at each performance level in 2025 is available on DEW’s reports portal. Note that the total for the Advanced level (tagged with a star) also includes the Advanced Plus level of performance. Totals do not add to 100 percent because untested students are omitted.
As Table 1 shows, Ohio educators and subject experts have established that students who score at the Proficient level have an “appropriate” command of Ohio’s learning standards. As of fall 2025, approximately 60 percent of the state’s students achieved this performance level or higher. Table 1 also shows that Ohio educators and subject experts deem students to be on track for college readiness if they score at the Accomplished or Advanced level, which includes approximately 37 percent of Ohio students as of fall 2025.
Figure 1 (below) plots rates of college attendance for students scoring at each performance level on the four tests that are the focus of this analysis.[6] It indicates that, across all four tests, students scoring at higher levels are significantly more likely to attend a four-year college within two years of finishing high school than students scoring at lower levels. Consistent with state guidance that the Accomplished level denotes college readiness, a large majority of students scoring at the Accomplished or Advanced level attended college within two years of their on-time high school graduation. College attendance rates are below 50 percent for students scoring lower. The results also indicate that the predictiveness of math and English tests is comparable.[7]
Figure 1. Student Performance on Ohio Tests and College Attendance
Note. The figure illustrates the association between students’ performance levels on four Ohio state tests and their rates of attendance at four-year colleges and universities within two years of their projected high school graduation. The four state tests are the grade-8 ELA test, grade-8 math test, Algebra I end-of-course exam, and ELA 2 end-of-course exam. The sample consists of students in ninth grade during the 2014–15 and 2015–16 school years.
Figure 2. Student Performance on Ohio Tests and College Graduation
Note. The figure illustrates the association between students’ performance levels on four Ohio state tests and their rates of graduation from four year colleges and universities within five years of their projected high school graduation. The four state tests are the grade-8 ELA test, grade-8 math test, Algebra I end-of-course exam, and ELA 2 end-of-course exam. The sample consists of students in ninth grade during the 2014–15 and 2015–16 school years.
Similarly, Figure 2 (above) shows that, across all four tests, students are more likely to graduate from a four-year college within five years as their performance levels increase. Rates of graduation are up to 42 percent and 59 percent among students who scored at the Accomplished and Advanced levels, respectively. Note, however, that only students who scored at the Advanced level have a greater than 50 percent chance of graduating from a four-year college or university within five years of finishing high school. This is a reminder that factors affecting college attendance and graduation include not only academic aptitude but also student aspirations, financial cost, advising and coursework opportunities, and the proximity and quality of college options.[8]
Finally, note that, once again, performance on math and English exams is similarly predictive of graduation, and that performance levels remain predictive of college graduation even when the analysis is limited to students who attend college.[9] For example, as the appendix reveals, among students who enrolled in college within two years of their projected high school graduation, a clear majority of those who scored at the Accomplished and Advanced levels ultimately graduated within five years of completing high school. However, among college attendees, between 38 and 49 percent of those who scored at the Proficient level graduated within five years of completing high school.
Part 2: Test-Score Growth and Post-Secondary Attainment
The analysis above indicates that math and English tests administered primarily in eighth grade and high school have considerable (and similar) predictive value, but these results could be primarily attributable to capacities students possessed before entering tested grades. If that were so, then annually testing students as they progressed through school would have far less value, as their performance levels and probability of going to college would change little from year to year. To assess whether tests do in fact capture progress toward college readiness, one must examine whether test-score growth (or decline) over time also predicts entry into and graduation from four-year colleges and universities.
This portion of the analysis assesses the extent to which Ohio students with greater test-score growth since third grade (the earliest year of statewide testing) attend and graduate from four-year colleges at higher rates than the average student who had similar third-grade test scores.[10] Figure 3 (below) indicates that students who demonstrated more growth on Ohio state tests (growth at about the 70th percentile relative to other Ohio students) indeed attended and graduated from college at higher rates than students who had similar third grade test scores but then had average test-score growth (at approximately the 50th percentile) between third-grade and high school.[11] Growth at the 70th percentile is roughly equivalent to the achievement gains a student would have if they attended a school from fourth grade through high school that, every year, had a four-star Progress rating instead of a three-star Progress rating on Ohio’s school report cards.[12]
Figure 3. Test-Score Growth and College Attendance and Graduation Rates
Note. The figure illustrates the differences in rates of college attendance and graduation between third grade students whose test-score growth through high school was at the 70th percentile as compared to similarly achieving third graders whose test-score growth was at the 50th percentile statewide. Four tests were used to capture the endpoint for that growth: grade-8 ELA and math tests and Algebra I and English Language Arts 2 end-of-course exams. The sample consists of students in ninth grade during the 2014–15 and 2015–16 school years.
Figure 3 indicates that going from the 50th percentile to the 70th percentile in test-score growth corresponds to an increase in the probability of college attendance of 7 to 9 percentage points and an increase in the probability of college graduation of 6 to 7 percentage points. (Going in the other direction, from the median to the 30th percentile, corresponds to reductions in college-going and graduation of similar magnitudes.) These effect sizes correspond to approximately 8,500 more Ohio students attending a four-year college every year, and approximately 6,500 additional students graduating from those colleges within five years of finishing high school.
Finally, as with the results for performance levels, estimates of test-score growth captured by the four tests are similarly predictive of college attendance and graduation,[13] and growth predicts college graduation even if the analysis is limited to students who attend college.[14] In other words, students who demonstrate more test-score growth through high school are more likely to persist once in college.
Conclusion
The evidence shows that Ohio state tests have considerable value for gauging whether students are on track to attend and graduate from four-year colleges and universities. These results are consistent with rigorous research cited above, which indicates that interventions that boost scores on standardized math and reading tests can yield a host of desirable outcomes, such as higher rates of college attendance and, consequently, greater earnings in adulthood. Considered alongside such studies, the analysis demonstrates the benefits of continuing to administer OSTs annually to monitor progress, as well as the value of communicating performance levels and test-score growth to families and educators, such as through the Progress measure on the Ohio report card.
Acknowledgments
We wish to thank Dr. Stéphane Lavertu for his fine work conducting the analysis and authoring this report. Special thanks also to the Ohio Department of Education and Workforce for providing the data necessary for the analysis.
On the Fordham team, we appreciate the thoughtful feedback from our colleagues Michael J. Petrilli and Chester E. Finn, Jr., as well as assistance from Jeff Murray. We’re grateful to Kathi Kizirnis for copy editing the document and Andy Kittles for laying out the publication.
—Aaron Churchill and Chad L. Aldis
Thomas B. Fordham Institute
[4] For evidence of the substantial financial returns to four-year colleges and universities, see Mountjoy, Jack. 2024. “Marginal Returns to Public Universities.” NBER Working Paper No. 32296. Cambridge, MA: National Bureau of Economic Research; Bleemer, Zachary, and Sarah Quincy. 2025. “Changes in the College Mobility Pipeline Since 1900.” NBER Working Paper No. 33797. Cambridge, MA: National Bureau of Economic Research.
[5] Ohio’s end-of-course exams were first introduced during the 2014-15 school year. Thus, to assess college outcomes, this analysis must be limited to 2014-15 and 2015-16 test data. Note that the 2014-15 and 2015-16 ninth grade cohorts took elementary, middle, and high school tests associated with different testing regimes, including Partnership for Assessment of Readiness for College and Careers (PARCC). The results are similar if the analysis is limited to end-of-course exams that the 2015-16 cohort took, which are similar to the end-of-course exams currently in use.
[6] Note that this analysis is for students in ninth grade during the 2014–15 and 2015–16 school years. The performance cutoffs—and the proportion of students who scored at each cutoff—are not identical to those presented in Table 1. See Table A1 in Appendix A for descriptive statistics and see Table A2 for the results in tabular form.
[7] One should be cautious about comparing the predictiveness of performance levels across test subjects and grades, as the student samples and share of students scoring at each performance level vary across tests (see Table A1 in Appendix 1). Analyses using continuous test scores are in Appendix B and indicate all four tests are similarly predictive of college outcomes.
[9] Analyses using continuous test scores are in Appendix B and indicate all four tests are similarly predictive of college outcomes. Table B4 in Appendix B limits the graduation analysis to students who attend a four-year college or university.
[10] Characterizing the analysis as examining “growth” is a stylization. Statistically, the analysis estimates the extent to which scores on the four tests (administered primarily in eighth grade and high school) are predictive of college attendance and graduation when controlling for students’ third grade scores in math and English. Appendix B describes the statistical methods and provides the results in tabular form in columns labeled “Grade 3 Test Controls.”
[11] The results in the figure are from comparing the average college-going and graduation rates (conditional on third-grade test scores) of students whose test-score growth was between the 45th and 55th percentile to the conditional college-going and graduation rates of students whose test-score growth was between the 65th and 75th percentile. The percentile changes were calculated by generating the distribution of test-score growth conditional on third-grade test scores, creating new z scores based on that growth distribution, and then calculating percentiles based on those new z-scores.
[12] The “effect sizes” reported for the Progress component of Ohio’s school report cards are z-scores based on the statewide annual growth distribution, which can be converted to growth percentiles by calculating the area under the standard normal curve for a given z-score. The average annual effect size for four-star schools on Ohio’s 2025 report card is 0.11 of a standard deviation of growth—average annual achievement gains that are greater than those of 54.4 percent of Ohio students (i.e., 54th percentile of the growth distribution). That implies growth of roughly 0.55 of a standard deviation (approximately the 70th percentile) if a student attended a four-star school, as opposed to a three-star school, from fourth grade through eighth grade. Note that this is a rough benchmarking procedure that makes strong assumptions about the year-to-year stability and additive nature of school effects. It is intended simply to provide a qualitative sense for the magnitudes of the effect sizes reported in Figure 3.
[13] The figure suggests that the predictiveness of growth measured by end-of-course exams, particularly Algebra I, is greater than that of eighth grade tests. However, as noted above, comparing the results across tests can be misleading. The tabular results in Appendix B indicate that the predictive value of all four tests is comparable.
The new year brings new discussion of the topic of the constitutionality of religiously-based charter schools. While the U.S. Supreme Court tied 4-4 on the question last year after one justice recused herself, Erica Meltzer writes in Chalkbeat this week that several new cases are brewing—such as those in Tennesseeand Colorado—that likely won’t require any recusals and which could decide the question once and for all should they once again be taken up by the Supreme Court.
You’re invited: National Charter School Summit
The National Charter Schools Institute’s 2026 Summit—titled Bold by Choice—will be held April 27-29, 2026, in Grand Rapids, Michigan. The goal is to bring together school leaders, teachers, students, policymakers, advocates, and employers to celebrate successes, to reimagine what young people need to thrive in a rapidly changing world, and to bring those ideas back to their communities. More information and registration details can be found here.
*****
Did you know you can have every edition of the Ohio Charter News Weekly sent directly to your Inbox? Subscribe by clicking here.