Mobile Navigation

  • National
    • Policy
      • High Expectations
      • Quality Choices
      • Personalized Pathways
    • Research
    • Commentary
      • Gadfly Newsletter
      • Flypaper Blog
    • Events
    • Scholars Program
  • Ohio
    • Policy
      • Priorities
      • Media & Testimony
    • Research
    • Commentary
      • Ohio Education Gadfly Biweekly
      • Ohio Gadfly Daily
  • Charter Authorizing
    • Application
    • Sponsored Schools
    • Resources
  • About
    • Mission
    • Board
    • Staff
    • Career
Home
Home
Advancing Educational Excellence

Main Navigation

  • National
  • Ohio
  • Charter Authorizing
  • About

Michael J. Petrilli
6.30.2026
Harvard College entrance
Getty Images/HABesen
Listen to this article
Loading the Elevenlabs Text to Speech AudioNative Player...

Editor’s note: This was first published as part of a newsletter for Mike’s Substack, SCHOOLED.

Matt Barnum wrote a great post last week illustrating that most “non-college career pathways” don’t lead to high-paying jobs:

The most common non-college jobs make far below the median. For instance, there are over 4 million people who work as home health and personal care aides in America, the largest single occupation. That’s more than the number of plumbers, electricians, carpenters, HVAC specialists, welders, car mechanics, roofers, and power-line installers combined. The Bureau of Labor Statistics predicts more growth in jobs for home health aides than any other occupation. The median salary is about $35,000 a year.

Other large non-college vocations—each encompassing millions of people—include retail sales workers, cashiers, order stockers, waiters and waitresses, fast-food workers, and janitors. All of these pay substantially below the median. One exception is truck driving, a position that pays relatively well and employs millions of people. But many fear the job is at particularly high risk of automation.

All this maps onto other data showing that college-educated workers have a large wage advantage, on average, compared to those without a degree.

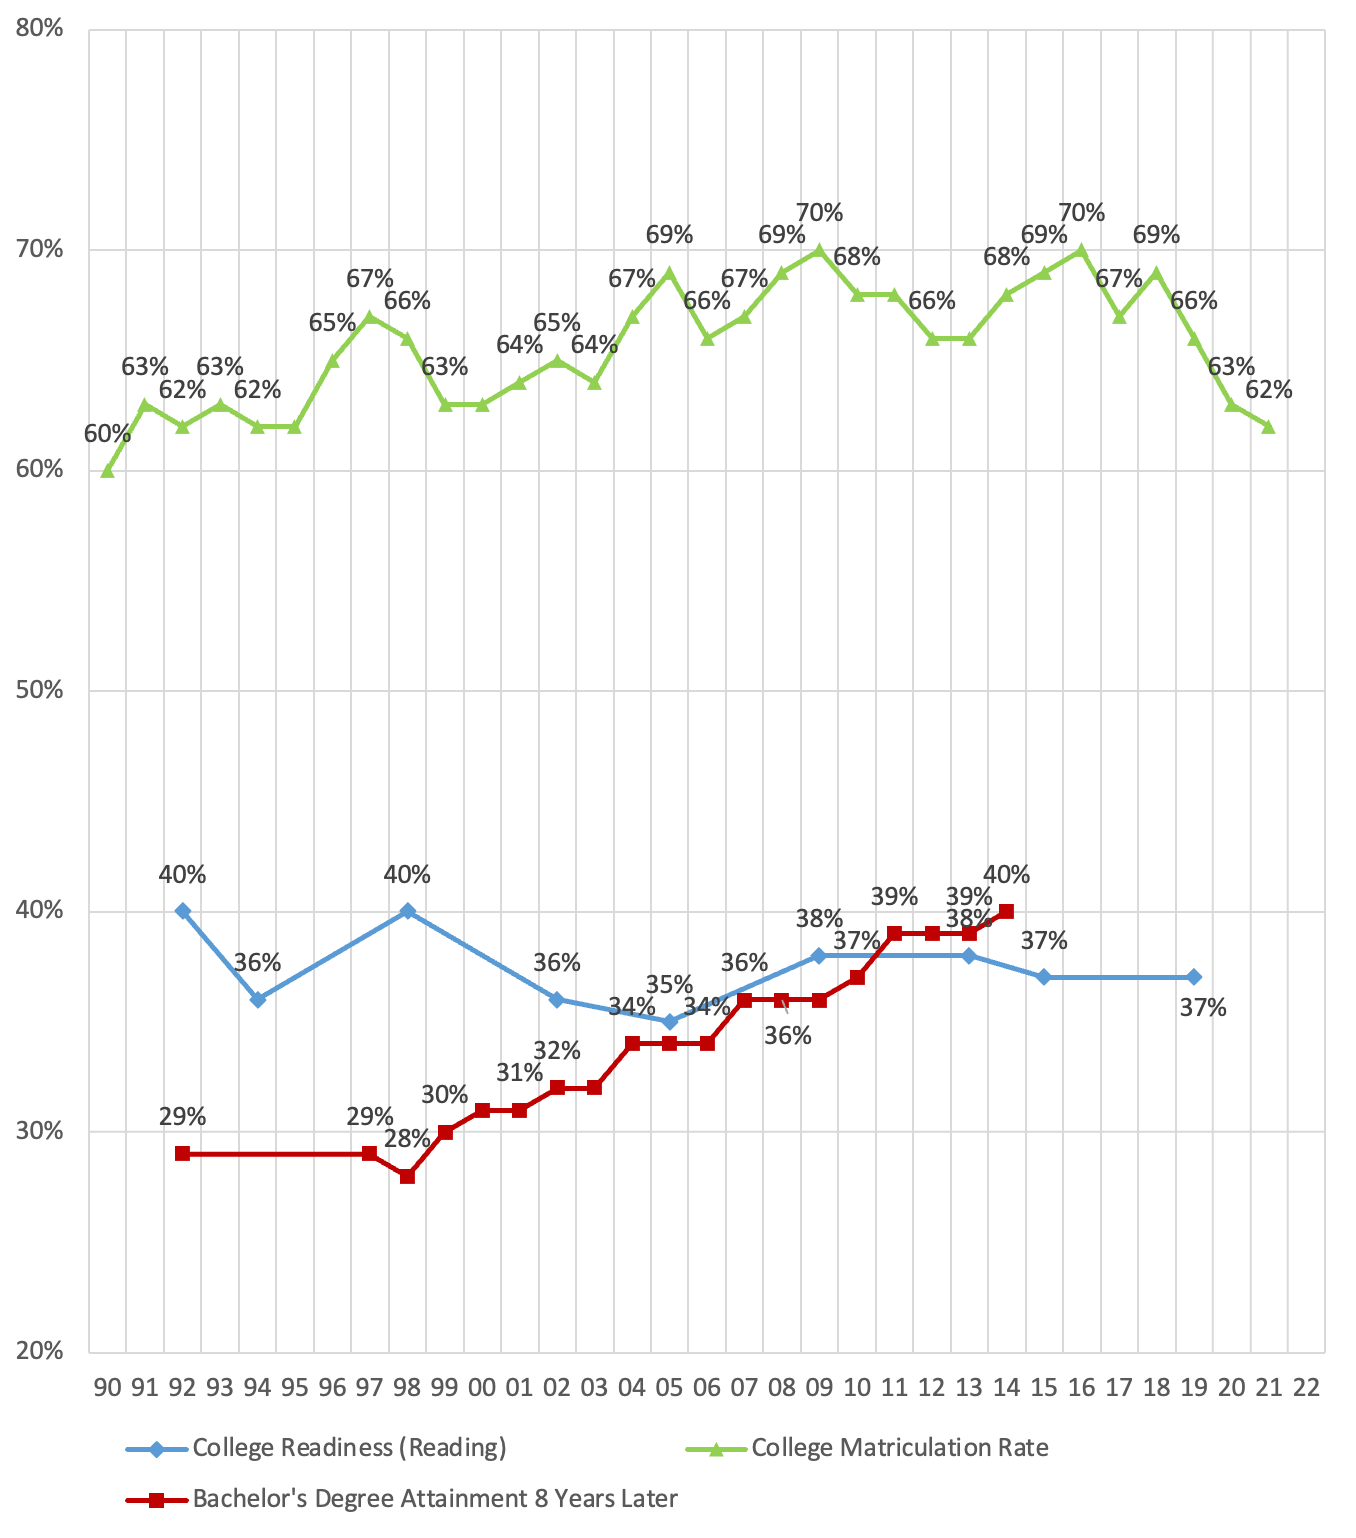
This is all true, but I wish that Matt had written that of course the college wage premium only flows to those who complete college. And it’s hard to do that if you’re not among the 30 or 40 percent of American 18-year-olds who graduate high school academically-prepared for college. See this chart I published back in 2023, showing that about the same number of students now graduate from college as were academically ready for college, even though many more give college a try:

Chart 1 displays the percentage of twelfth-graders in a given high school graduating class who reached the National Assessment’s “college-prepared“ level in reading over the past three decades, which, according to the National Assessment Governing Board, equates to “proficient.”

[It] also shows the percentage of students in that same high school graduating class who matriculated directly to college, as well as the percentage of that class that eventually graduated with bachelor’s degrees within eight years. The most recent college completion data come from 2022, for the high school class of 2014.

Chart 1: College preparedness, college matriculation, and college completion
1

To argue that most of the people becoming home health aides, fast-food workers, and the like could have gone to college and ended up with much higher wages requires ignoring the fact that many of those folks were nowhere near college ready at the end of high school. It’s hard to complete college if you’re reading and doing math at a sixth-grade level. Which is a strong argument for education reform and our work to dramatically improve the K-12 system and boost achievement as early as possible! Teenagers with low academic skills face bleak prospects—and taking on student loans they can’t afford to repay only makes them bleaker.

I don’t mean to pick on Matt. But we see this line of thinking everywhere. For example, consider Emmanuel Lalande’s recent article in the Hechinger Report about the college completion crisis, which blamed said crisis on everything but academic readiness or the lack thereof.

On the flip side, though, it also strikes me as crazy to think that students who are high-achieving academically should consider skipping college. My friend Scott Laband, for example, writes that “the college-first mindset is an outdated relic that’s failing us all.”

A quality education at a top-level university is right for some, yes, but for many others, the path to success looks like an excellent apprenticeship program, a modern community college pathway, employer-led training, or short-term credentials that are tied to real labor market demand.

All true, as were Scott’s strong arguments for shifting more of our tax dollars away from traditional higher education and into training for the trades. But I wish Scott had said that a “top level university is right” for students with strong grades and high test scores, who are best positioned to complete college and reap the college wage premium.

The tough calls are for students in the middle of the performance spectrum—in NAEP parlance, those who are above basic but below proficient, meaning they have solid basic skills but would likely struggle in college. Matt pointed me to a study by Jack Mountjoy indicating that even kids around 32nd percentile in achievement benefited from attending community college; that’s an argument for thinking that our definition of “college ready” might be too high and too exclusive (or perhaps should only apply to four-year schools).

On the other hand, as Preston Cooper just pointed out, a new Justice Department interpretation of disparate-impact law could make it easier for companies to test applicants again, making a college degree less useful as a proxy for academic readiness and reducing the “sheepskin effect.”

Under disparate-impact doctrine, employers generally cannot rely on hiring tests or screening criteria that produce substantially different outcomes across demographic groups unless those criteria are “job related for the position in question and consistent with business necessity.”

…[R]egulators have interpreted this law to block employers’ use of employment aptitude tests, written exams, and English proficiency tests, among other things. Curiously—and for reasons that are unclear even to legal experts—regulators have not applied the same logic to college degrees…

In a new opinion to the Equal Employment Opportunity Commission, the Justice Department…moves toward placing other hiring practices, such as knowledge or aptitude tests, on a level playing field with college degrees. This gives employers legal cover to shift away from degree requirements towards other measures of job fitness.

So this is my request, fellow writers and analysts: When discussing whether students should go to college, let’s be clear about whether we’re talking about young people with strong academic skills, weak academic skills, or something in between. And we need lots more studies to help the vast majority of 18-year-olds, who find themselves in the middle of the performance distribution, to determine which kind of post-secondary education or training is right for them.


Policy Priority:
High Expectations
Topics:
Career & Technical Education
Curriculum & Instruction
Teachers & School Leaders
Katherine Bowser
6.26.2026
Teacher and students with hands raised
Getty Images/Pongtep Chithan
Listen to this article
Loading the Elevenlabs Text to Speech AudioNative Player...

Teacher evaluation systems and their reforms were built, in part, on the idea that rubric-based classroom observations, paired with feedback, would improve teacher performance and raise student achievement. Not every reform delivered on this promise, but there were bright spots. Tennessee’s evaluation system—the Tennessee Educator Acceleration Model (TEAM)—was among a small group of system reforms that were associated with gains in math and reading scores.[1] Whether TEAM is connected to other important outcomes, like student discipline, is a question worth asking.

In a new study, Seth Hunter of George Mason University, Adam Kho of the University of Kentucky, and I asked whether the teacher observations Tennessee assigns to teachers in TEAM affect student discipline outcomes (SDOs). We focused specifically on exclusionary SDOs (in-school suspensions, out-of-school suspensions, and expulsions).

Why discipline?

Teachers and administrators have considerable discretion over how students are disciplined, and those decisions can bring longer lasting effects. Students who receive exclusionary discipline are more likely to drop out of school, more likely to be incarcerated, and less likely to attend college.[2] These negative consequences are particularly alarming given clear evidence of racial bias in student discipline decisions.[3] If classroom management can be improved, and improving it can curb exclusionary discipline and the longer- term consequences, then it is worth investigating already-existing levers that may do so.

See NCTQ’s Classroom Management Framework for more on why classroom management matters and what teacher preparation programs can do to foster classroom management skills before teachers are on their own in the classroom.

What did we find?

Each year, Tennessee policy requires administrators to conduct a specific number of TEAM observations for each teacher, with more frequent observations of teachers who scored lower the prior year or who are earlier in their careers. A teacher rated 5 on the state’s 1-to-5 effectiveness scale receives a single observation, while a teacher rated 1 receives four. Teachers in the middle range of effectiveness receive two or four observations, depending on years of experience.[4] We draw on six years of Tennessee student and teacher data. The student data include every in-school suspension, out-of-school suspension, and expulsion. The teacher data include each observation a teacher received and its score, along with their overall effectiveness ratings and years of experience.[5]

Our study examined whether the total number of observations assigned to a school’s teachers was related to the share of its students who received at least one exclusionary SDO. We found that as state policy assigned more observations within a school, a smaller share of students received an exclusionary SDO. In the average Tennessee school during the study period, 8.45 percent of students experienced a suspension or expulsion. Within a school, an additional 25 policy-assigned observations was associated with a statistically significant reduction of about 0.3 percentage points in the share of students receiving an exclusionary SDO. For the average school, that is roughly a 3.5 percent decrease.

This overall reduction was driven primarily by in-school suspensions, which was expected. The behaviors that lead to an out-of-school suspension or expulsion are more severe, and therefore harder to disrupt, than behaviors that ultimately lead to in-school suspensions.

How do more observations decrease exclusionary discipline outcomes?

We tested several hypotheses and found that improved teachers’ classroom management skills account for part of the decline in in-school suspensions. In practical terms, teachers got better at managing and de-escalating student misbehavior, which reduced the need to issue an office referral that can ultimately lead to suspension. More policy-assigned observations presumably mean that teachers receive more feedback and principals gain a clearer view of what is happening across classrooms, which may help them identify school-wide areas to improve, like classroom management, and address them through professional development or other initiatives.

Importantly, these findings apply specifically to policy-assigned observations. When principals exercise discretion and observe teachers more often than policy requires, we do not see the same benefits. Rather, results suggested the opposite—more discretionary observations are associated with higher rates of exclusionary discipline. The likeliest explanation is reverse causation. Principals decide to increase observations beyond what policy determines in response to discipline problems that already exist. Because of that, we cannot separate any effect of these additional discretionary observations from the conditions that prompted principals to conduct them.

What is the policy implication?

Results suggest that policymakers or district leaders who want to reduce exclusionary discipline and, in turn, improve related life outcomes for students, should consider evaluation systems that determine the number of observations each teacher receives using two criteria: a teacher’s prior year performance and years of experience. Assigning observations using a set rule can plausibly strengthen classroom management school-wide and, in turn, reduce the share of students who are suspended.

Editor's note: This was first published by NCTQ.

___

Endnotes

1. Bleiberg, J., Brunner, E., Harbatkin, E., Kraft, M. A., & Springer, M. G. (2025). Taking teacher evaluation to scale: The effect of state reforms on achievement and attainment. Journal of Political Economy Microeconomics, 3(3), 568–610.

2. Bacher-Hicks, A., Billings, S. B., & Deming, D. J. (2024). The school-to-prison pipeline: Long-run impacts of school suspensions on adult crime. American Economic Journal: Economic Policy, 16(4), 165–193. https://doi.org/10.1257/pol.20230052; Sorensen, L. C., Bushway, S. D., & Gifford, E. J. (2022). Getting tough? The effects of discretionary principal discipline on student outcomes. Education Finance and Policy, 17(2), 255–284. https://doi.org/10.1162/edfp_a_00341

3. Hayes, M. S., Liu, J., & Gershenson, S. (2023). Who refers whom? The effects of teacher characteristics on disciplinary office referrals. Economics of Education Review, 93, 102376. https://doi.org/10.1016/j.econedurev.2023.102376

4. Certification status effectively distinguishes early career, apprentice, teachers with fewer than four years of experience from professional teachers, with four or more years of experience. Teachers rated 2 through 4 in the prior year receive four observations if apprentice and two if professional. This description reflects the policy in place during the study period (2012 through 2018). The underlying logic of assigning more frequent observations to lower-rated and less-experienced teachers remains in place.

5. The data also include student, teacher, and administrator demographics, as well as responses from the Tennessee Educator Survey.

Aaron Churchill
6.26.2026
Classroom desks
Getty Images/smolaw11
Listen to this article
Loading the Elevenlabs Text to Speech AudioNative Player...

Thousands of Ohio students are M.I.A. from school and losing the opportunity to reach their potential. Nearly 385,000 students—about one in every four—were “chronically absent” in 2024–25, meaning they missed more than 10 percent of the school year. Of these students, 125,000 were absent more than 20 percent of the year, or about two months’ worth of school. In districts such as Cleveland, Lorain, and Youngstown, more than half of students were chronically absent. Based on preliminary data, attendance appears little improved in 2025–26.

Ohio has pursued various ideas to address this crisis. Governor DeWine pledged to dramatically cut absenteeism. State officials have created toolkits to provide advice for schools. A taskforce was convened and offered some helpful recommendations. Ohio has a philanthropy-led attendance effort. We at Fordham have suggested coaches and a stronger report-card measure to combat absenteeism.

These initiatives and ideas all have merit, but they may not be enough to vanquish widespread absenteeism. To add extra oomph, state policymakers should explore funding levers. One possibility in this realm is a move to an attendance-based school funding formula—an approach to funding that the nation’s two largest states (California and Texas) implement and that has encouraged their schools to take daily attendance seriously. 

Funding actual attendance, not just enrollment

Ohio provides state aid based on pupil enrollments.[1] Enrollment-driven funding is common across the U.S., but it’s also blind as to whether students actually show up for school. All that matters is whether students are on a school’s membership roll—not if they attend. Since attendance has no bearing on funding levels, schools aren’t as likely to take proactive measures, such as improved bussing, home visits and family supports, or even initiatives that directly reward students when they are present.

In contrast to Ohio’s enrollment-based system, California, Texas, and four other states fund schools based on attendance. Because state funding hinges on attendance, schools pay closer attention to it. In a recent report, the California Legislative Analyst’s Office argued in favor of maintaining an attendance-based system and wrote the following:

(1) the ADA [average daily attendance]‑based funding model creates a fiscal incentive for districts to prioritize actions that support increased attendance; (2) statewide attendance rates improved after the state changed its ADA model in the late 1990s to more closely link funding to student attendance; and (3) under the current model, districts have taken recent actions to support attendance.

A smattering of news reports corroborates that California districts do indeed respond to the financial incentive. In advocating for a comprehensive attendance strategy, one school board member recently said that it’s “the biggest [revenue] lever we have... We get paid by who shows up.” Notable also is that California has nearly restored attendance rates to pre-pandemic levels, while Ohio still lags its pre-pandemic marks.

One can also locate similar news stories about Texas districts pushing for attendance to boost their state aid. We also find a state comptroller report (2003) urging Texas schools to prioritize attendance because they can more than recoup their expenses by claiming the additional state dollars. It recommended:

Beef up truancy programs—more students in average daily attendance means more dollars allocated to the district through state funding formulas. Socorro ISD added three attendance officers to increase attendance and could get $1.2 million in additional state revenues over five years.

Lacking financial incentives, Ohio schools don’t have the same urgency as their California and Texas counterparts. In those states, attendance matters—real dollars are at stake—and their schools take more assertive measures to push for it.  

Navigating transition challenges

Despite its advantages, attendance-based funding would stir debate in Ohio. If done in isolation, a shift implies reduced funding, as the number of students present on a given day inevitably falls below enrollment.[2] This would raise political hackles, as well as the specter of hold-harmless “guarantees” to keep districts’ state funding afloat—yet also undercuts the fiscal incentive. Equity concerns may also surface, as high-poverty urban districts tend to have lower attendance and could face larger funding reductions under such a transition.

State policymakers would need to thoughtfully navigate these issues, but it could be done by considering the following.

First, Ohio could phase in the change to blunt the immediate impact of the lower attendance-based counts relative to enrollments. The state is already undertaking a phased approach to usher in more accurate (but lower) economically disadvantaged rates for purposes of disadvantaged pupil impact aid (DPIA) funding. A similar approach could be used to phase in attendance and phase out enrollment data for funding purposes.

Second, on the equity issue, Ohio already drives significant supplemental funds to high-poverty schools through DPIA (about $600 million statewide this year). Though this is already a substantial amount, Ohio could consider a bump in DPIA in conjunction with a move to attendance-based funding.[3] This would maintain the incentive—schools could still generate more state aid when more students are present—but also offset reductions associated with a transition.

Third, policymakers should consider the strong likelihood that attendance rates improve in response to the incentive. Should this occur, schools will experience smaller reductions due to the transition (all else being equal in the formula).

Fourth, Ohio already has funding policies embedded in school choice programs that take into account attendance. Online public charter schools must document that students are participating in learning opportunities (the equivalent of attendance)—not merely enrolled—to receive state aid. In addition, students participating in EdChoice lose their scholarships if they accumulate more than 20 unexcused absences. These policies are designed to incentivize attendance and protect taxpayer dollars. Why not apply the same logic to public education funding, writ large?

* * *

Students need to be in class to learn and excel academically. Conversely, bad attendance derails academic progress and could even build habits that undermine employment success when students start working. Ohio must consider all policy options to fight back against absenteeism. Attendance-based funding could be a powerful tool that encourages schools to do everything in their power to help students get to class.


[1] Ohio’s long-standing use of “guarantees” undermine the enrollment basis of the school funding formula, as they provide excess funds to prop up districts losing enrollment. Local funding is entirely disconnected from district enrollments (and attendance), as it depends on the local tax rate and tax base.

[2] The statewide attendance rate was 91.3 percent in 2024–25 and 93.5 percent in 2018–19 (pre-pandemic).

[3] The increase should be additive—that is, in addition to covering an already-needed increase to DPIA to account for the phase in of the lower (but more accurate) counts of low-income students.

Policy Priority:
High Expectations
Topics:
Accountability & Testing
School Finance
Governance
Teachers & School Leaders

Wyoming’s Teacher Union Strength Profile

This profile is one of 51 state profiles accompanying Fordham’s report, A Crowded Table: Teacher Union Strength in 2026, which updates Fordham’s 2012 rankings of state teacher union strength.

  • Read more about Wyoming’s Teacher Union Strength Profile

Maine’s Teacher Union Strength Profile

This profile is one of 51 state profiles accompanying Fordham’s report, A Crowded Table: Teacher Union Strength in 2026, which updates Fordham’s 2012 rankings of state teacher union strength.

  • Read more about Maine’s Teacher Union Strength Profile

South Dakota’s Teacher Union Strength Profile

This profile is one of 51 state profiles accompanying Fordham’s report, A Crowded Table: Teacher Union Strength in 2026, which updates Fordham’s 2012 rankings of state teacher union strength.

  • Read more about South Dakota’s Teacher Union Strength Profile
The Education Gadfly
6.26.2026
Gadfly Guy
Listen to this article
Loading the Elevenlabs Text to Speech AudioNative Player...

WHAT WE’RE READING

“Soon, half of all American schoolkids will be able to apply for state money to finance a private education, and many states will offer the scholarships even to families with high incomes,” write Bianca Vázquez Toness and Sharon Lurye. Yet many students from low-income families and those with disabilities are left behind by private school choice programs in their current iteration.

EXTRA CREDIT:

Jason Riley, “When Schools Try to Cover Up Their Failures”

Kaya Henderson, “To Save Our Schools, Trust Young People”

Rick Hess and Derek Black, “How State Courts Are Quietly Shaping U.S. Education”

Dr. Megan Schopp, “The Dirt Road to a Better Education Policy”

Sharif El-Mekki, “We Can’t Give Up on Teacher Diversity”

Matt Gandal, “Graduation Season Is Here. Is The High School Diploma Stuck In The Past?”


Editor's note: This was first published on Mike Petrilli's Substack, SCHOOLED, a twice-weekly free Substack and email newsletter restarting the education-reform conversation.

Click here to subscribe for:

  • Sharp analysis of the week’s biggest K–12 debates

  • Curated commentary from across the ed-policy world

  • Lively discussion—including reader reactions and pushback

The Education Gadfly
6.26.2026
Gadfly Guy
Listen to this article
Loading the Elevenlabs Text to Speech AudioNative Player...

CHEERS

Montgomery County Public Schools (MD) will no longer cover community college tuition bills for students who aren’t prepared for postsecondary work. Talia Richmanreports that “the district will only cover these costs for students who are deemed ‘college and career ready,’ based on a specific state definition that factors in GPA, course completion, and standardized test scores.” Some expressed disappointment at this change, but I think it’s an improvement. Nobody should pay for courses that students are unlikely to pass—and that should go for the federal government’s Pell Grants and student loans, too.

JEERS

Dana Goldstein describes the many ways AI helps students cheat and the challenge facing educators trying to maintain some semblance of academic integrity:

In some cases, the very same companies selling detection tools are also making apps that allow students to cheat, including by writing papers for them or rephrasing text written by others. The apps promise to help them avoid accusations of misconduct by scanning their work before they submit it, allowing them to rewrite passages identified as AI.

—

Patrick Anderson shares disappointing news from Rhode Island, where “Governor Dan McKee signed a three-year moratorium on new public charter schools into law on Thursday, June 18, completing a full reversal on an issue in which he was once a staunch charter backer. The legislation blocks new charters from opening through 2029 and lowers the statewide cap on charters from 35 to 28.” This despite Rhody’s charters’ strong record of success and overwhelming popularity—and the fact that McKee appears likely to lose his primary anyway.


Editor's note: This was first published on Mike Petrilli's Substack, SCHOOLED, a twice-weekly free Substack and email newsletter restarting the education-reform conversation.

Click here to subscribe for:

  • Sharp analysis of the week’s biggest K–12 debates

  • Curated commentary from across the ed-policy world

  • Lively discussion—including reader reactions and pushback

Jeff Murray
6.26.2026
Ohio charter news logo
Listen to this article
Loading the Elevenlabs Text to Speech AudioNative Player...

Stories featured in Ohio Charter News Weekly may require a paid subscription to read in full.

The school facilities debate continues in Ohio

Cleveland.com last week covered the question of whether Cleveland Metropolitan School District is flouting Ohio law with their efforts to sell off several recently-closed district buildings to developers without offering them to charter and private school operators first. Several charter supporters—including the Thomas B. Fordham Institute—are quoted in the affirmative, while CMSD officials believe they have a two-year window in which to offload their buildings without involving charters. While no consensus is reached on the current letter or spirt of the law in that piece, everyone does seem to agree that new legislation under debate in the General Assembly is both clearer and less susceptible to loopholes. Elected board members of Columbus City Schools also seem to recognize—and fear—that the clarity of SB 311 will put an end to the obfuscation and runarounds they and other districts have used to deny access to their un- and under-used facilities for charter and private school operators…should it become law.

The quiet part out loud

Meanwhile, the elected members of the Burke County (NC) Board of Education voted 5-2 this week to demolish a recently-closed elementary school, specifically because they didn’t want a charter school to buy it. What’s interesting in this situation is that district officials actually went on the record explaining what would be so bad about the competition moving in: “For a charter school to open it must have at least 80 students, per state law,” Finance Director Keith Lawson told his elected bosses. “If a school opened and grew by 2 percent each year, after five years it would cost the school system $3.5 million in state funding alone.” The superintendent added: “I’m not opposed to parental choice as long as those entities have the same guidelines that we are required to follow, per state standards, (such as) calendar law, school hours, teacher work days, things like that, testing requirements.”

Cleveland charter leaders weigh in

Similar vibes back in Cleveland, where two supporters of the Breakthrough Schools charter network published an op-ed recently reminding folks about the Cleveland Plan and the longstanding connection between high-performing charter schools and CMSD which that plan forged. Andrew McRae and Susan Ertle seem to sense a fraying of that connection in the wake of the district’s closure/consolidation efforts and opine in favor of reknitting that fabric: “When we stay grounded in our values, aligned to a clear strategy, and relentlessly focused on outcomes for scholars and families,” they write, “we move closer to the Cleveland we all believe in, a city where every child, regardless of ZIP code, has access to a first-class education.”

A test at the ballot box

The new board that oversees education in Indianapolis decided last week to place an operating levy on the ballot this fall. For the first time ever, proceeds will be split evenly between the district and charter schools in the city. Its success or failure will be a vital litmus test for the new education paradigm in Indy.

Moratorium in motion

As we discussed in our last edition, Rhode Island House Bill 7415 places a three-year moratorium on new charter schools and lowers the maximum number of charters allowed in the state from 35 to 28. That bill was signed into law by Gov. Dan McKee on June 18.

*****

Did you know you can have every edition of the Ohio Charter News Weekly sent directly to your Inbox? Subscribe by clicking here.

Policy Priority:
School Choice
Topics:
Charter Schools

New York’s Teacher Union Strength Profile

This profile is one of 51 state profiles accompanying Fordham’s report, A Crowded Table: Teacher Union Strength in 2026, which updates Fordham’s 2012 rankings of state teacher union strength.

  • Read more about New York’s Teacher Union Strength Profile

Pagination

  • First page « First
  • Previous page ‹ Previous
  • Page 24
  • Page 25
  • Page 26
  • Page 27
  • Current page 28
  • Page 29
  • Page 30
  • Page 31
  • Page 32
  • Next page Next ›
  • Last page Last »
Fordham Logo

© 2026 The Thomas B. Fordham Institute
Privacy Policy
Usage Agreement

National

P.O. Box 110
Burke, VA 22009

202.223.5452

[email protected]

Ohio

P.O. Box 82291
Columbus, OH 43202

614.223.1580

[email protected]

Sponsorship

130 West Second Street, Suite 410
Dayton, Ohio 45402

937.227.3368

[email protected]