Mobile Navigation

  • National
    • Policy
      • High Expectations
      • Quality Choices
      • Personalized Pathways
    • Research
    • Commentary
      • Gadfly Newsletter
      • Flypaper Blog
    • Events
    • Scholars Program
  • Ohio
    • Policy
      • Priorities
      • Media & Testimony
    • Research
    • Commentary
      • Ohio Education Gadfly Biweekly
      • Ohio Gadfly Daily
  • Charter Authorizing
    • Application
    • Sponsored Schools
    • Resources
  • About
    • Mission
    • Board
    • Staff
    • Career
Home
Home
Advancing Educational Excellence

Main Navigation

  • National
  • Ohio
  • Charter Authorizing
  • About

Alicia Anderson
7.9.2026
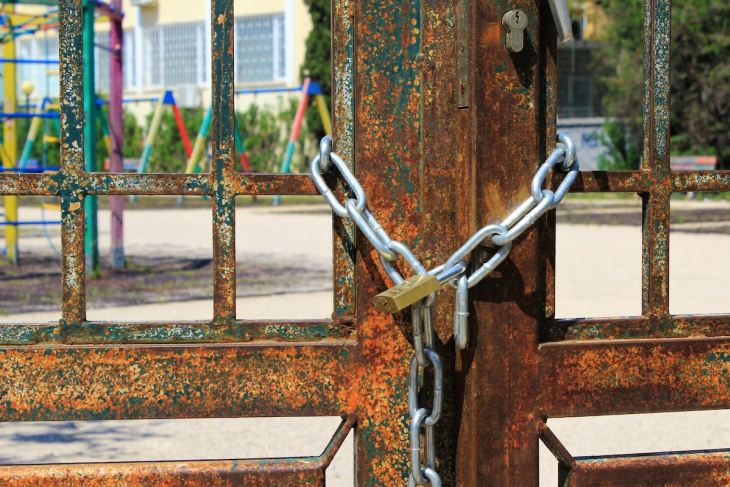
Closed school
Getty Images/Panagiotis Maravelis
Listen to this article
Loading the Elevenlabs Text to Speech AudioNative Player...

Throughout the first quarter of the 21st century, schools built up capacity to accommodate growing student populations, adding classroom space, teacher positions, and the many resources that go into educating a child. The Covid-19 pandemic accelerated the build-up through the injection of giant sums of federal money to supplement state and local budgets. In 2025, more students graduated from high school than in any other year in American history. Today, however, the population of young people is sharply declining and the trend shows no signs of slowing.

Districts around the country are seeing what happens to schools funded by per-pupil formulas when there are simply fewer pupils to go around. It’s a concern for teachers unions, with leaders desperately trying to strong-arm blue-state governors to keep existing budgets intact. It’s a concern for rural communities, who have seen this play out before. And it’s a concern for families who feel their children are pawns in an opaque and disruptive process that has the largest impact on communities already struggling.

It’s very easy to find emotional reasons to argue against closing underenrolled schools; it’s trickier to argue against the cold, hard fact that keeping empty schools running costs a lot of money while leaving students with less access to high-quality programming, safe facilities, and the non-academic resources that can help put struggling students on a better path.

This background makes a new analysis from Stanford’s Francis Pearman compelling. Using a synthetic difference-in-differences model, Pearman examined 796 California districts between 2011 and 2019 to see whether closure decisions led to balanced budgets. The sample design is important: Pearman looked at school district finances after the Great Recession but before the pandemic. He excluded districts with school closures underway at the beginning of the study period because the analysis requires a pre-treatment baseline, plus dropped single-school districts and any districts with missing data. These choices allow for a sophisticated statistical analysis but potentially exclude some districts facing circumstances similar to those making closure decisions today.

Pearman found that the closures in California reduced the number of students within a district by an average of 287 students, and reports that closures “left districts’ funding deficits and probability of achieving a balanced budget unchanged.” The null result held for districts in financial distress and for financially stable systems.

Why? Spending went down by about $447 per pupil, with a standard error of $388—nearly as large as the estimate—but revenue fell at effectively the same rate. California’s Local Control Funding Formula (LCFF) creates a large degree of state allocation variance based on local student counts, as state funding (about 55 percent of total funding at the start of the study period) drops when students leave the district with no hold-harmless cushion. Plus, closing schools had no effect on the total number of teachers and staff despite shuttered buildings and a drop in enrolled students. Fixed costs like required salary and benefits payments did not change following the closures.

Rather than truly right-sizing schools, it appears the districts just moved around adults.

With over three-fourths of all public school expenditures going to personnel costs and the average public school teacher salary in California during the 2024–25 school year reaching six figures, district leaders have limited tools to adjust their budgets. California has the second-strongest teachers union in the country according to Fordham’s latest analysis, working hard to protect its members’ jobs and raise salaries even when those costs extend beyond what districts can afford. Beyond union pressure, the regulatory environment in California limits the ability to repurpose closed buildings to optimize revenue—a point Pearman considers in discussing how the state’s surplus land policies constrain local districts.

It’s hardly the case that as goes California, so goes the nation. Other states facing enrollment-related financial pressure may have very different results if local school leaders have flexibility to optimize revenue and right-size their workforce based on student needs rather than collective bargaining conditions. While anti-closure advocates have been quick to latch on to an oversimplified conclusion that school closures have no fiscal benefit, Pearman’s analysis points to a much more complicated picture of school closure decisions, particularly after looking at how regulatory pressure in California hamstrung local leaders in ways that do not apply to many other states.

That said, the impact of closures on communities is real, and school board members facing tension between their fiduciary responsibilities and the vocal desires of their constituents would be wise to walk through the reasons why consolidations often better serve children rather than staring at spreadsheets and announcing a top-down decision.

Leaders can make the case for fiscally responsible decisions with both compassion and tangible benefits for the families most impacted. Consolidations can expand access to better classes, more extracurriculars, safer facilities, and stronger wraparound support—gains too often underdiscussed amid emotional conversations about closures.

State and local leaders can also create conditions for smart facility reallocation like affordable housing for teachers and community services that support children and families. There is a role here for philanthropists aiming for broad impact to help ensure closed buildings become a boon rather than a blight in impacted neighborhoods. 

Tough choices lie ahead, and voters should keep leaders accountable rather than sending tax dollars toward poorly maintained, empty buildings where costs will rise as student enrollment continues to fall. Pearman’s findings suggest that conditions in California hindered financial savings from closing schools, but do not support the conclusion that closing schools doesn’t save money in an era of demographic decline. Instead, his analysis underscores the need for a holistic understanding of the factors impacting school budgets—from statehouse on down—and a policy approach that looks at both revenue production and cost reduction. Leaders should take heed quickly: Kicking the can further down the road leaves bigger problems for affected communities, while wise decisions today provide an opportunity to build out improved programs that are right-sized and tailored to the children they serve.

SOURCE: Francis A. Pearman II. “The Fiscal Consequences of School Closures in California: Evidence from a Statewide Synthetic Difference-in-Differences Design,” Stanford SCALE (May 2026).

Policy Priority:
High Expectations
Topics:
Evidence-Based Learning
Facilities
School Finance
Governance
Jim Cowen
7.8.2026
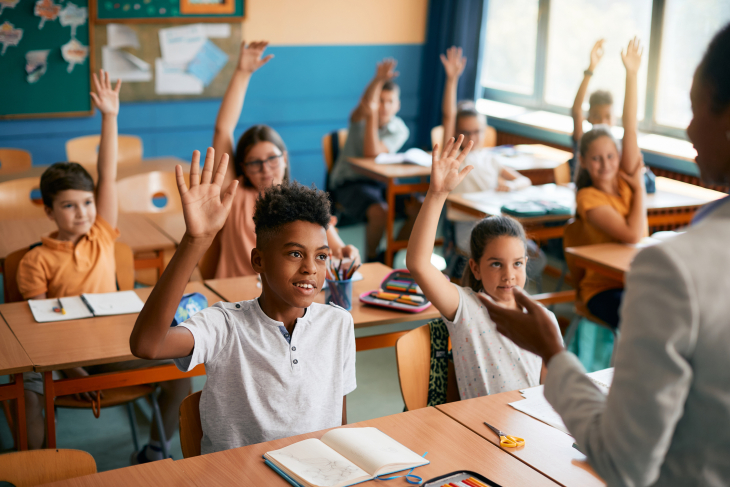
Students with hands raised
Getty Images/Drazen Zigic
Listen to this article
Loading the Elevenlabs Text to Speech AudioNative Player...

In the latest National Assessment of Educational Progress Long Term Trends analysis, 23 percent of the 13-year-olds surveyed report that they are enrolled in Algebra I.

For those seventh and eighth graders, that’s great news.

According to the NAEP release, students who take Algebra I by the eighth grade score higher than their peers across all other courses. While the National Assessment Governing Board is careful to note this is not a causal relationship, it is a persistent trend over time. Importantly, these students also are better positioned for geometry, calculus, statistics, computer science, and other advanced coursework in high school. That knowledge provides a strong foundation for college, career training and an economy increasingly built around quantitative and STEM skills.

But how many kids have proven they are ready for advanced math and never get the opportunity?

Access to Algebra I is often shaped by uneven local practices. Placement can depend on teacher recommendations, parent advocacy, scheduling, school culture or whether a student is perceived as “a math person.” Those systems may not be intentionally unfair, but they can be inconsistent—and inconsistency leaves capable students behind.

We must close this “excellence gap” between student capability and student opportunity.

In Virginia, for example, more than 53,000 seventh grade students scored proficient or above in math on the 2024 statewide assessment, yet in 2025, just under 32,000 eighth grade students were enrolled in Algebra I, according to data from the Virginia Department of Education.

A tougher task is identifying how big that gap is across the country. Most states do not publicly report Algebra I enrollment data. For those that do, inconsistencies across systems make it difficult to impossible to determine how many students could be enrolled compared to those who are enrolled.

Despite the lack of a national Excellence Gap picture, it’s encouraging to see a growing number of states taking steps to address the issue. North Carolina, Virginia, Texas, Kentucky, and Indiana have all enacted formal “automatic enrollment” policies. The practice automatically advances students to higher level coursework when they’ve met or exceeded benchmarks on statewide assessments.

Of course, enrollment alone is not going to solve our math challenges.

More than 20 education organizations agree that real improvements are only going to come when states and districts take meaningful steps, such as expanding access to high-quality instructional materials aligned to strong standards, providing additional instructional time for students who need it, and better preparing teachers and math coaches who can help improve classroom practice.

Automatic enrollment should be part of a broader math strategy, not a standalone reform. Policymakers and educators can start with a simple commitment: When students demonstrate readiness for advanced math, schools should enroll them—and support them.

Students who are ready for Algebra I deserve access to it. It is time to make that access automatic.

Editor’s note: This was first published on Forbes.

Policy Priority:
High Expectations
Topics:
Curriculum & Instruction
Governance
Advanced Education
Teachers & School Leaders
Jeff Murray
7.8.2026
Gadfly Bites logo
Listen to this article
Loading the Elevenlabs Text to Speech AudioNative Player...

News stories featured in Gadfly Bites may require a paid subscription to read in full. You have been warned.

Post-vacation edition covering 6/24 – 7/6/26.

  1. Let’s start our recap with a few follow-up items from our last regular news clips/snarking service. First up is another look at SB 19, signed into law by Gov. DeWine on June 24. Fordham’s own Chad Aldis is quoted extolling the virtues of the math instruction provisions of the bill. The final version included a number of other education law changes not commented upon by Chad in this piece. But if you run into him on Capitol Square, feel free to ask him about it. I’m sure he’ll be willing to share. (Cleveland.com, 6/25/26)

  2. Next we have Fordham senior research fellow Vlad Kogan continuing his efforts to draw attention to the weak outcomes and enormous price tag of the Columbus Promise program in this Dispatch op-ed. He reiterates the points he made in his initial Ohio Gadfly blog post and comments on some critical responses published in its wake. “To the extent that my critics disagree with me,” he writes, “it seems to be on whether we should evaluate Columbus Promise based purely on the number of students who begin community college – regardless of how well they do – rather than the much smaller number who actually earn a credential.” Those defenders, Kogan says, describe the purpose of the program as “dramatically expand[ing] the pipeline of students from Columbus City Schools who have the opportunity to go on to post-secondary education.” But true pipelines, he reminds us, must actually lead somewhere: “A program that gets many students in the door only to see the vast majority fail and leave is not a pipeline,” he concludes, “it is a road to nowhere.” Brutal…and true. (Columbus Dispatch, 6/26/26)

  3. Back in mid-June, tiny Jefferson Township Local Schools made headlines when they fired all of their school principals (all 2 of them) and all their cafeteria workers to try and stave off a giant budget deficit. If you were concerned that the district’s 250-ish students would be leaderless and lunchless come the fall, fear not. Somewhere, the elected board found $225K to hire a catering company and an undisclosed amount of money (?!) to hire two new administrators whose job duties include principal-ish stuff amid a long list of other responsibilities. Bound to be a banner year out there, amiright? (Dayton Daily News, 6/29/26)

  4. Speaking of money (seriously: when aren’t we talking about that filthy green stuff?), here’s a piece that baffles me somewhat. It covers the findings of a committee convened by Columbus City Schools, analyzing individual school buildings’ academic returns on investment. Specifically: This is how much money goes into a given building, and this is how the students perform academically. I get the impression they were aiming to answer the question of “how much does it really cost to educate a student?”—which is laudable and important—but man did they open (in my opinion) a can of worms. The first two examples—presented at a meeting of the elected school board and covered in this piece—used the district’s two single-gender academies, likely because it was easiest for them to compute (small student body, unique specialty services, probably siloed expenditures). They found that the district spends a whopping $450,000 per math-proficient student at the boys-only academy and $180,000 per English language arts-proficient student. And while things are quite a bit better in the girls-only school—population 200—at $78,000 per math-proficient student and $35,000 per ELA-proficient student, this all just sounds really bad to me. Part of the issue is undoubtedly the very small number of students in the school (just 100 kids in a building equipped for hundreds more), and I have no doubt that district leaders will respond to these findings by saying, “See, we’re right: Expenses don’t decline commensurate with smaller enrollment,” and “See, we’re right: We need more money to educate our students.” But there’s another, bigger problem: The percentage of students reaching proficiency is just a fraction of the tiny whole. The committee also reported the average cost of educating a middle school student in the district overall and at each of the two academies, resulting in a much more reasonable range (from $13,000 to $35,000). But if I’m reading this correctly, those costs must be understood as not educating students to proficiency, but simply to successful promotion to high school. There is no further discussion of this latter point—as I’m sure the elected school board doesn’t have any idea how to message about it if they indeed even understand what their own report has found—but it seems really important to me to reiterate. Bottom line for me: Any school that can educate students to proficiency for less money (and $450K seems a pretty easy bar to clear in that regard) should be seen as a better option than Columbus City Schools. (Columbus Dispatch, 6/25/26)

  5. Meanwhile… We can forget the investment part and just focus on the return part with this piece, in which we learn that Columbus City Schools is under investigation by the Ohio Department of Education and Workforce for undefined “testing anomalies” at two high schools. No matter what is ultimately found to have happened, the fact is that all test scores for all students in all grades in those schools have been invalidated and efforts are ongoing over the summer to get as many students as possible to retake those tests—including a handful of kids who graduated in May with what could be an invalid diploma. A huge and costly mess, for which only students will likely experience consequences. (Columbus Dispatch, 7/2/26)

  6. This op-ed urges the elected board members running Cincinnati City Schools to consider the impacts of a cancellation or scaling back of the EdChoice Scholarship program (as the result of a putative voucher groucher lawsuit win) on the district’s enrollment and finances before deciding whether to ask voters for new levy funds. “This is not an argument for or against EdChoice. Nor is it an argument for or against a levy,” writes Dennis Doyle, who is a member of the “Enquirer Board of Contributors” (whatever that is) but does not appear to have any special interest in education. “It is,” he avers, “an argument for informed decision-making.” Personally, I think Mr. Doyle is selling the elected board members short. Despite whatever money they are flushing down the toilet paying the various law firms involved in their voucher suit, these politicians remain clear-eyed on the potential for a payoff: Winning is a longshot; only a fraction of voucherless families would consider attending the district even if that longshot comes true; and a final decision either way is still several red-ink-stained budgets away. And they are using their actual knowledge in this regard to guide their decision making. (Cincinnati Enquirer, 7/5/26)

  7. While I was out, Ohio apparently received a scarlet letter clickbait grade of F (38th worst in the nation!!!!!) in a report by some group called “Network for Public Education”. Cleveland.com’s Laura Hancock reports that Ohio was “dinged” because of its “charter and private school voucher policies”. That is: Because we have such policies at all, which is of course Very Bad, thanks for asking. Stop the presses indeed. (Cleveland.com, 7/1/26)

  8. Finally for our June/July catch up edition: Jason Segedy, identified here as the former director of urban planning for the City of Akron, opined last week on the topic of Akron City Schools closing more school buildings as a result of years of declining student enrollment. Specifically, he remembers a couple of buildings closed during his tenure which were left by the district to rot unsold and unused. A bad situation in every respect. With many more schools likely to close this time—and Akron already in a “chaotic” state generally from population loss—Segedy argues that such costly blight cannot be allowed to happen again. He urges the city to help with their redevelopment ASAP. Mr. Former Planner does not propose selling Akron’s unused district buildings to charter or private school operators—the simplest possible “redevelopment” scenario for all stakeholders, and indeed prescribed in state law as the proper thing to do in such a situation—but I can’t go so far as to impute any anti-choice motives to that “oversight” within his ABJ op-ed. There were a lot of moving parts to his argument after all. (Akron Beacon Journal, 7/1/26) However, in this news report, we learn that Jason Segedy’s current job is deputy director of administration in the neighboring city of North Canton. He and his fellow civil servants and elected leaders there are working on the many moving parts of a sweetheart deal between the city and the school district to swap a number of properties between them—with no money changing hands, naturally—over the next few years. This includes a public pool that will, for some reason, be owned by the district but operated by the city. One elected city council member calls the twisty mess “absolutely a win/win for the schools and city”, regardless of how ridiculous it sounds (and there are a number of residents raising questions about said twistiness). But North Canton City Schools’ superintendent is even more clear as to who wins…and who loses. The deal, he says, will make certain that the district’s soon-to-close middle school building is quickly demoed and turned over to the city so that the building does not “end up in the possession of a charter school from outside the community.”  Given all this proof that our civil servants are operating according to their own agenda, I’m ready to revise my take on Mr. Segedy’s previous op-ed. Shameless. (Canton Repository, 7/1/26)

Did you know you can have every edition of Gadfly Bites sent directly to your Inbox? Subscribe by clicking here.

Policy Priority:
School Funding
Topics:
Governance
The Education Gadfly
7.3.2026
Gadfly Guy
Listen to this article
Loading the Elevenlabs Text to Speech AudioNative Player...

WHAT WE’RE READING

Vermont passed a law restricting federal school choice scholarships to public school and low-income students. Matthew Stone reports on how the state’s new rules—the first of their kind—put Vermont “on a collision course with the Trump administration,” which is expected to prevent states from placing just this sort of restriction on scholarship-granting organizations.

—

Holly Korbey gets us up to speed on the growing trend of integrated math in high school: blending algebra and geometry concepts across multiple years instead of teaching standalone courses. “Some experts say blending algebra and geometry gives more students a shot at learning high-level math later on in high school and college,” she writes, “touting high-achieving European and Asian countries that have taught integrated math for decades.” Still, implementation is tricky, and it’s not clear the approach provides adequate preparation for all students, particularly those continuing into STEM fields.

EXTRA CREDIT:

Rick Hess and Lindsay Fryer, “The Ed. Dept.’s Civil Rights and Special Ed. Offices Are Relocating. Here’s What It Means”

Natalie Wexler, “More Test-Based Accountability? It’s Complicated”

Robert Pondiscio, “The Case for Texas’s New Curriculum — Why Bible Stories Matter for Literacy” (from 2024)

Josh Dunn, “Unitary Executive Theory 101: What it is, what it isn’t, and what it means for education” (from 2025)

Daniel Buck and Anna Low, “The Decline of Teachers Unions (and How to Advance the Trend)”

Darryl Cobb, “Lessons from Charters Where Every Student Graduates, Most of Them With a Plan”

Jeanne Allen, “What Laws Have to Do With It: Thirty Years of Lessons on What Makes Charter Schools Thrive”

Brian Kisida, “Race, Income and Why Some Democrats Have the Luxury of Opposing School Choice”

Michael McShane, “School Choice Programs: The Avocado Toast of State Education Funding”

Jorge Elorza, “Ten Reasons Democrats Should Not Repeal the Federal Scholarship Tax Credit”

Charlie Barone, “Sherrill must get behind tax credits for scholarship donors”

Paul Vallas, “How New Orleans Turned Around Its Failing Schools”

Christine Toribio Pitts, “Three Ways a Dollar Spent on Schools in Oregon Disappears”

Paul E. Peterson, “Beware of Washington D.C.’s Presumptive Mayor, Social Democrat Janeese Lewis George”


Editor's note: This was first published on Mike Petrilli's Substack, SCHOOLED, a twice-weekly free Substack and email newsletter restarting the education-reform conversation.

Click here to subscribe for:

  • Sharp analysis of the week’s biggest K–12 debates

  • Curated commentary from across the ed-policy world

  • Lively discussion—including reader reactions and pushback

The Education Gadfly
7.3.2026
Gadfly Guy
Listen to this article
Loading the Elevenlabs Text to Speech AudioNative Player...

CHEERS

Cheers to the bipartisan Virginia Board of Education, including Fordham’s Amber Northern, which last week rejected Governor Abigail Spanberger’s effort to delay implementation of higher standards for the commonwealth’s Standards of Learning (SOL) exams. Anna Bryson reports on the vote, noting Virginia’s severe “honesty gap”: dramatically lower NAEP proficiency scores compared to pass rates on the state tests across grades and subject areas.

JEERS

“Just one in ten kindergartners who start school at the bottom of their class in reading and math skills is proficient by third grade,” writes Erica Meltzer, sharing findings from a new NWEA analysis that underscores the need to assess young students to better understand where gaps exist and what interventions may help.


Editor's note: This was first published on Mike Petrilli's Substack, SCHOOLED, a twice-weekly free Substack and email newsletter restarting the education-reform conversation.

Click here to subscribe for:

  • Sharp analysis of the week’s biggest K–12 debates

  • Curated commentary from across the ed-policy world

  • Lively discussion—including reader reactions and pushback

Brandon L. Wright
7.2.2026
Student thinking math
Getty Images/isabella antonelli
Listen to this article
Loading the Elevenlabs Text to Speech AudioNative Player...

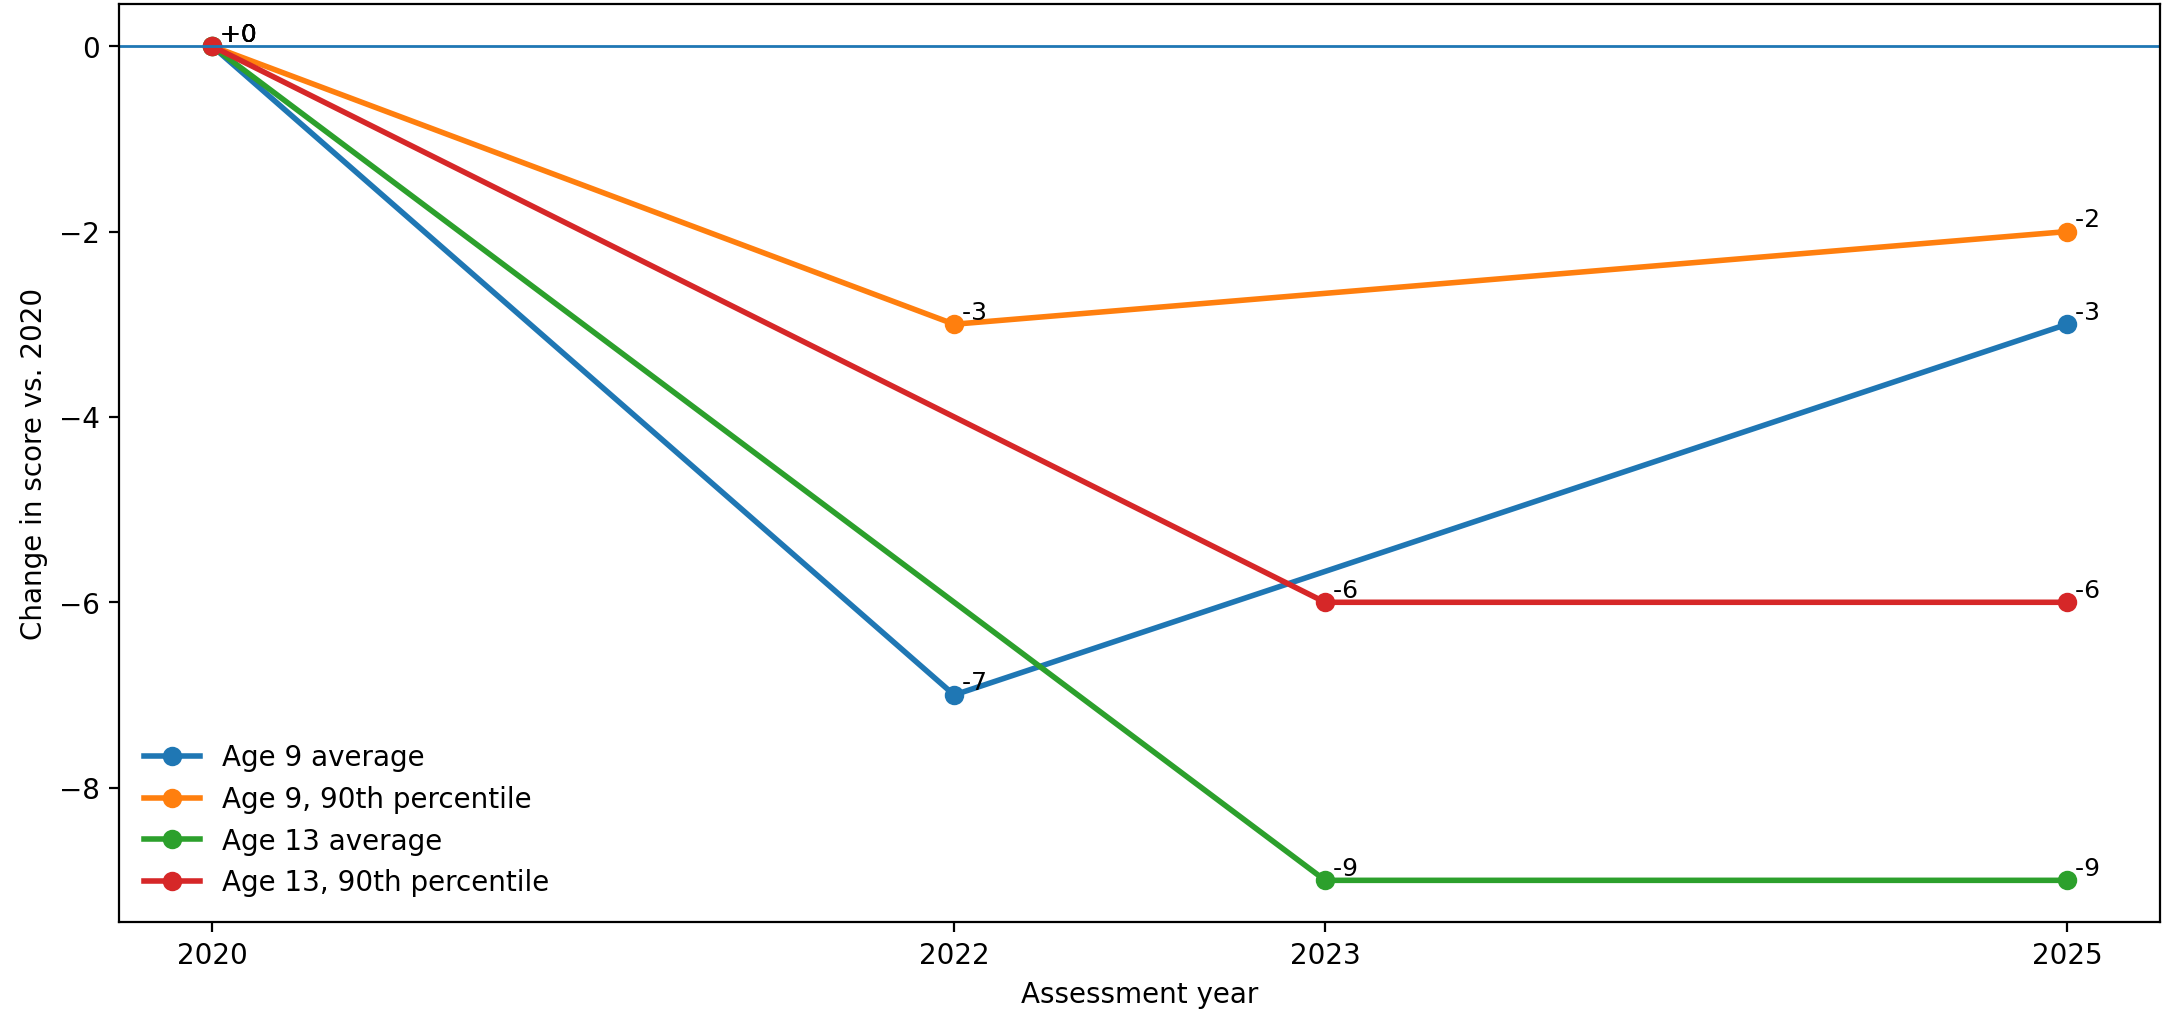
The newest results from the National Assessment of Educational Progress’s Long-Term Trend assessments offer sharply different pictures, depending on students’ age and where they fall in the achievement distribution (see Figure 1 below).

Among nine-year-olds, there is some welcome news. Scores rose four points in both reading and math since 2022, with the gains concentrated among lower-performing students. The gap between the top and bottom of the distribution also narrowed for the right reason: Students at the bottom improved, rather than those at the top declining further.

These gains are genuinely encouraging and deserve to be treated as such. There were already signs of deterioration among lower-performing students before the pandemic, and Covid compounded those problems enormously. Four-point increases do not repair all the damage, of course, but they are substantial, statistically significant, and a welcome indication that an academic recovery is underway for some who badly need it.

Less encouraging is what happened to scores for students near the top of the distribution, which showed no statistically significant changes between 2022 and 2025. This after scores for the top students declined only slightly between 2020 and 2022 (which itself was remarkable, given the closures and other disruptions of the pandemic).

The basic story is simpler than the statistics make it sound. Scores for high-performing nine-year-olds fell much less than those for their lower-performing peers during the pandemic, but they have barely rebounded. While students further down the distribution made sizable gains, those at the top remained in roughly the same place.

The picture among thirteen-year-olds is worse, both for students at the high end and for the age-group as a whole. Average reading and math scores for the entire age group were statistically unchanged from 2023 and remained below their pre-pandemic levels.

At the high end, scores fell three to four points in reading and six to eight points in math between 2020 and 2023. Those declines were substantial, even if they received less attention than the severe losses among lower performers. When thirteen-year-olds were assessed again in 2025, there was no statistically significant improvement at the 90th percentile in either subject.

In short, no recovery. Scores may have stopped falling, and that is not nothing. But a low plateau remains a low plateau. The top 10 percent of thirteen-year-olds are still performing significantly below their pre-pandemic predecessors—by about three points in reading and six points in math.

Figure 1 illustrates these trends, comparing changes in average math scores with changes at the 90th percentile for both age groups. Reading showed the same broad pattern: a stronger age-nine recovery below the top but no age-thirteen rebound.

Figure 1. Changes in average and 90th-percentile NAEP Long-Term Trend math scores for 9- and 13-year-olds, 2020–2025

1

Note: Age 9 was tested in 2020, 2022, and 2025; age 13 was tested in 2020, 2023, and 2025. Source: U.S. Department of Education, National Center for Education Statistics, National Assessment of Educational Progress, Long-Term Trend Reading and Mathematics Assessments, 2020–2025. Scores are rounded, and not all apparent differences are statistically significant.

Recall that students tested at a given age in different years experienced the pandemic at different stages of childhood. The nine-year-olds assessed in 2022 were already in the early elementary grades when Covid began, while those assessed in 2025 were mostly preschool-aged. Likewise, the thirteen-year-olds tested in 2023 were roughly two grades further along in school at the start of the pandemic than the thirteen-year-olds tested in 2025. These results therefore reflect separate groups whose schooling was disrupted at varying ages and under varying circumstances, not successive readings of a single cohort’s recovery. Those differences may help explain some of the variation across ages and assessment years, though NAEP data cannot tell us how much.

The fairest interpretation of all of this is more complicated than either “top students are still collapsing” or “high achievers have recovered.” The first assertion overstates the age-nine results, where relatively modest pandemic-era losses left top-end scores close to their earlier marks. The second ignores the lack of significant progress at the top since the first post-pandemic assessments and the much larger, still-unrecovered losses at age thirteen. Among nine-year-olds, the scores show smaller initial declines followed by little movement at the top. For thirteen-year-olds, they show larger declines followed by no significant rebound. Neither pattern offers much evidence that high-performing students are moving forward.

Few will view this as the most pressing problem in American education. Students who cannot read fluently, perform basic arithmetic, or do grade-level work face more immediate and severe consequences. Schools are right to concentrate substantial attention and resources on these students, and the strong gains among lower-performing nine-year-olds offer welcome evidence that an academic recovery may be underway.

Yet a child who begins the year already knowing much of the material and ends it having learned little more has not necessarily received a good education. Assigning more of what he already knows does little besides occupy his time. Strong grades and proficiency can conceal years of limited academic growth, particularly in schools where teachers are expected to address an enormous range of readiness within the same classroom. And if these deficits persist, highly selective colleges could eventually be drawing from a pool of students whose academic skills are weaker than those of comparable students before the pandemic.

Schools should keep helping the children who are furthest behind, urgently and for as long as necessary. They should also ensure that students who have already mastered the work in front of them encounter something harder. Otherwise, even a broadly successful recovery will remain incomplete.

Robert Pondiscio
7.2.2026
Child holding an American flag
Getty Images/Fotoamator
Listen to this article
Loading the Elevenlabs Text to Speech AudioNative Player...

In nearly every part of the country, the school year is over. The final bell has rung; report cards have been issued; summer vacation has begun. For teachers and schools, the clock has run out. Whatever lessons students were going to learn about their country in the days leading up to its 250th birthday—our history, our ideals, our achievements, and our failures—have already been taught (or not taught).

But there is still time for parents. As I’ve written elsewhere, anticipation for the approaching Semiquincentennial pales in comparison to the 1976 Bicentennial, but if schools have failed to cultivate students’ gratitude, civic affection, and love of country, parents can still do so. In fact, they must.

A few weeks ago, in an episode of the Commentary podcast, John Podhoretz invoked John Rawls’s famous “veil of ignorance,” a thought experiment where you design a just society without knowing your future wealth, race, gender, or social status. The forced blindness encourages participants to create rules that protect and benefit everyone, especially the most disadvantaged members of society. Podhoretz put a patriotic spin on it, asking where you would choose to be born if you could know nothing about the circumstances of your future life.

For all our political divisions, cultural anxieties, and a litany of daily complaints, I suspect most of us would choose America. Not because America is perfect. Not because it is free from injustice, conflict, or disappointment. Simply because if you had to place a bet on which nation offered you the greatest likelihood of living your life in safety, prosperity, dignity, and freedom, you would be hard-pressed to make a better wager. Needless to say, this is not how many Americans think about their country. Nor, alas, is it the way many children learn about it.

I confess I’ve found the lack of enthusiasm for America’s approaching 250th birthday more than a little dispiriting. A nation preparing to mark a quarter millennium of self-government should be eagerly anticipating the occasion. We seem reluctant to celebrate, or we peevishly deny there is anything worth celebrating. Which is why I’ve been unexpectedly cheered by the flood of social media videos posted by foreign visitors who have come to the U.S. for the World Cup. They wander through Buc-ee’s with the awe of pilgrims entering a cathedral. They marvel at well-stocked supermarket aisles and wander through Bass Pro Shops like they’ve stumbled upon a lost civilization. They are astonished by public restrooms, vast highways, air conditioning, abundant food—with free refills!—and countless features of everyday life we have long since stopped regarding as remarkable.

We watch these videos and we’re charmed and amused. Well, of course there are 50 kinds of breakfast cereal! But that is precisely the point. One of the blessings of living in a prosperous and successful society is that you stop noticing it. Abundance becomes ordinary. Stability becomes invisible. Freedom is background noise. On the eve of a frankly desultory 250th and with impeccable timing, visitors from other countries have arrived to remind us of all we take for granted.

To be sure, consumerism is merely a surface-level indicator of our good fortune, not the soul of it. But our guests’ refreshing lens invites a summer civic education challenge for parents. Our children are growing up in a culture that is exceptionally good at teaching criticism. Young people learn to identify injustice, inequity, hypocrisy, and failure. Children reliably learn what America got wrong, but do they learn what we got right? Do they learn why billions of people around the world would gladly trade places with them? Do they learn why generations of immigrants crossed oceans, deserts, and borders for the chance to become Americans? Do they learn why our imperfect nation remains even now the destination of choice for millions seeking freedom, opportunity, and a better life?

To be clear, the nation needs citizens capable of seeing its shortcomings. Criticism teaches us what needs improving. Gratitude teaches us what is worth preserving. A healthy civic education requires both.

Parents grasp this intuitively. We teach children to say “thank you” because gratitude is essential to character. A grateful person understands that much of what makes his life possible was built, protected, or handed down by others. Gratitude fosters humility, stewardship, and a sense of obligation to future generations.

Citizenship requires precisely these virtues. Every American is the beneficiary of gifts he or she did not create. A constitutional order that has endured for two and a half centuries. Freedom of speech and religion. The rule of law. A vibrant civil society. The most creative and productive economy in human history. Scientific and technological advances that previous generations would have regarded as wizardry. Most of all, we inherit a country that millions of people throughout history have chosen, often at great personal risk, to join.

None of this requires viewing America through rose-colored glasses. Among the features of American life for which we should be grateful is our capacity for self-correction. Frederick Douglass, Abraham Lincoln, Susan B. Anthony, Martin Luther King Jr., and countless reformers appealed not to anti-American ideals but to American ones. They criticized the nation because they believed it was capable of becoming better. They called on America to live up to its promises. Love of country and honest criticism are not conflicting values, but love must come first. No child is likely to preserve or seek to improve what he has never learned to value.

Imagine raising a child in a grand old house. Every day you point out the peeling paint, the drafty windows, the leaky faucet, and the repairs that remain undone. You never mention the shelter it provides, the craftsmanship that built it, or the generations who maintained it before you arrived. Eventually the child will know every flaw in the house. But he may never understand why it was worth preserving. America is no different.

The school year is over, but cultivating gratitude does not require a district initiative or curriculum mandate. Patriotism is not a government program. It is an inheritance. Parents can lead it themselves. This summer, read a biography with your children. Visit a battlefield. Take them to a presidential library. Read the Declaration of Independence aloud. Attend a Fourth of July parade. Visit a national park. Tell family stories about grandparents and great-grandparents. Attend a naturalization ceremony and watch new Americans pledge allegiance to a country many native-born citizens take for granted. Teach your children not only what America got wrong but what America got right.

Schools have never been solely responsible for forming citizens. Families, churches, scouting organizations, libraries, youth sports leagues, civic associations, and countless other institutions helped cultivate a sense of belonging and obligation. They still can, and, indeed, they may have to. As I’ve noted elsewhere, schools have become demonstrably less interested in their founding purpose of preparing children for responsible citizenship. The school year is over. The opportunity is not.

There is still time to raise a grateful American.

As the nation approaches its 250th birthday, perhaps the most important lesson we can teach children is that, while America is not perfect, they have inherited something rare, precious, and unfinished.

Editor’s note: This was first published on Pondiscio’s Substack, The Next 30 Years.

Bruno V. Manno
7.2.2026
Moving puzzle pieces
Getty Images/Lacheev
Listen to this article
Loading the Elevenlabs Text to Speech AudioNative Player...

The Trump administration is in the midst of a sweeping reorganization of the U.S. Department of Education. Its stated goal is to “return education to the states.” But the more immediate question is whether the new structure will make the federal education system clearer and more accountable—or leave states, schools, and families facing a maze of agencies and unclear lines of responsibility.

The administration is carrying out the overhaul through 14 interagency agreements that move at least 148 K–12 and higher education programs to six other federal agencies. Some transfers could place programs within agencies better equipped to manage them. Others—especially those involving special education and civil rights—could make it harder to determine who is responsible when services are delayed, rights are violated, or problems arise.

Interagency agreements are typically used to share services or funds without duplicating work. Here, they are being used to redistribute much of the ED’s Congressionally-assigned work across the federal government. The department is not being abolished in one stroke, as some had feared. Rather, it is being rewired and shrunk, agreement by agreement.

The administration frames the agreements as breaking up federal bureaucracy and improving program delivery. Critics see a federal agency being dismantled by administrative means, with Congress sidelined, and families and other K–12 stakeholders left to navigate a more complicated government arrangement.

Both reactions contain part of the truth. The old structure has real problems. But replacing one department with scattered agency partnerships isn’t constructive unless it makes the system clearer, more accountable, and more useful to the people it serves.

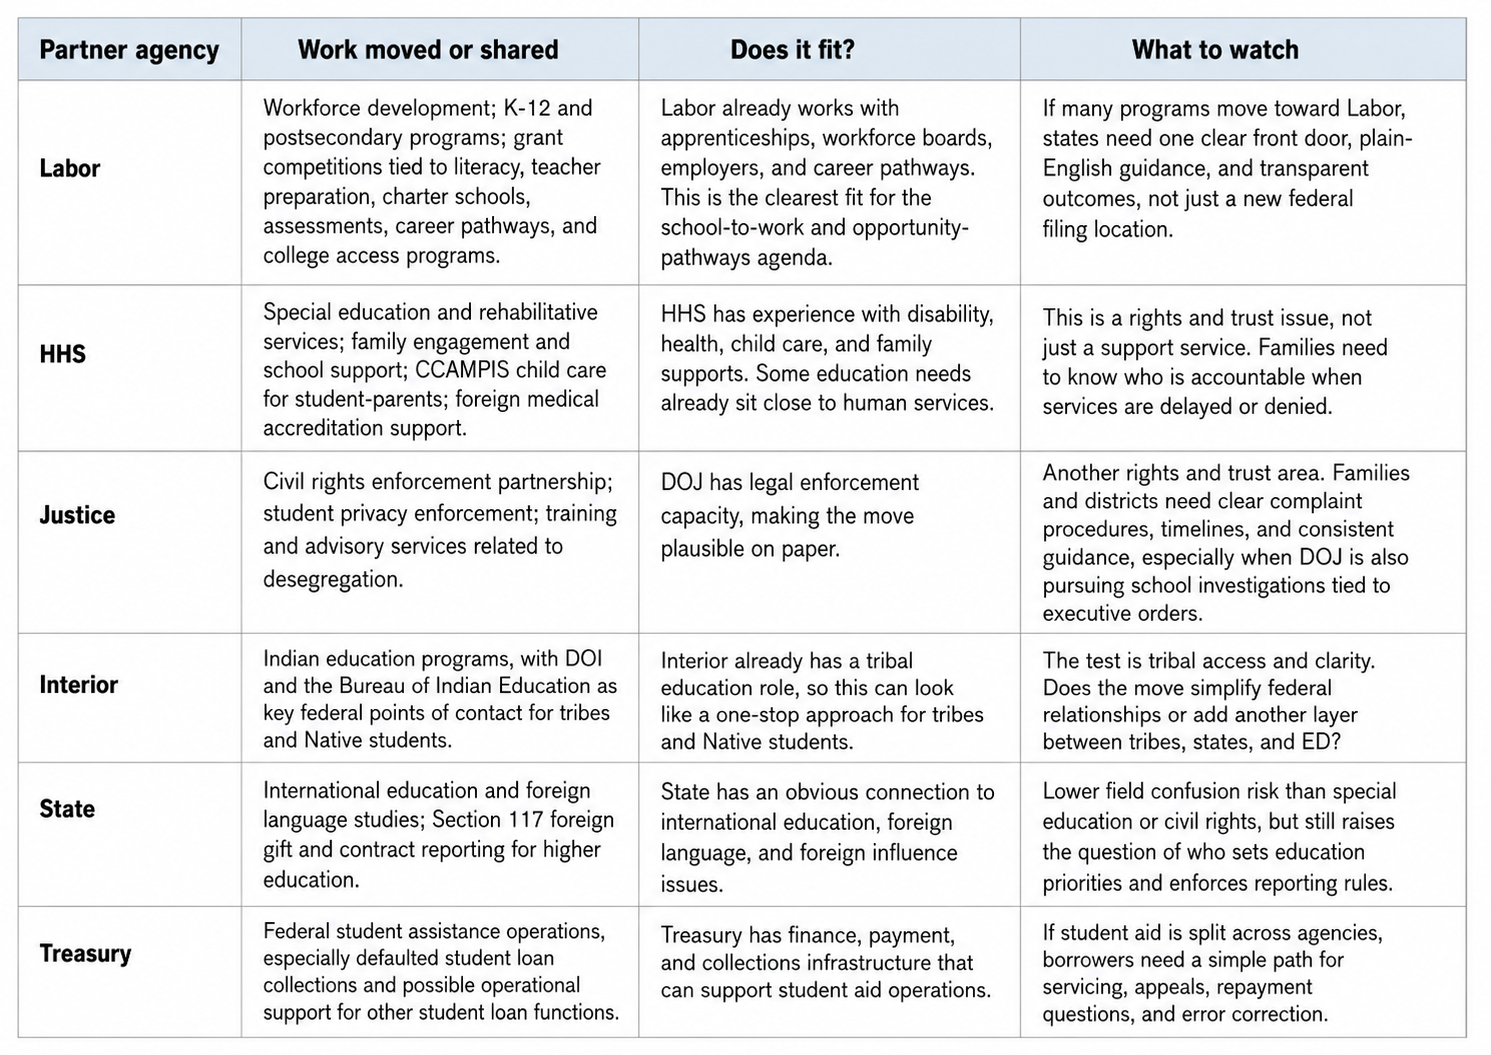
Chart 1, below, makes the pattern easier to see. I’ve compiled it with assistance from ChatGPT and Claude, based on publicly available information from Education Week and K–12 Dive. For each of the six partner agencies, it identifies what Education Department work has moved or is moving, why the administration believes the fit makes sense, and the issues that I believe are worth watching as implementation occurs.

Chart 1. Where ED’s programs are going, whether it fits, and what to watch

1

The case for these transfers varies by program. Some functions may fit naturally within agencies that already handle workforce development, finance, tribal affairs, or international relations. But relocation alone does not guarantee better coordination or service. The real test is whether the new arrangement is easier to navigate, preserves clear accountability, protects students’ rights, and produces better results.

The administration's underlying rationale isn’t baseless. Education has never fit inside one government box. Many students move through systems that extend beyond K–12 education. A young person might take career courses in high school, enter an apprenticeship, earn a short-term credential at a community college, and rely on workforce agencies or employers along the way.

Additionally, when the Education Department was created in 1979, a number of programs that would have fit into the new Department, such as Head Start and Indian Education, were not transferred to it. Interest groups fought vigorously to keep their particular program out of the new Department.

Special education and civil rights present a harder case. These functions involve more than coordinating services and are functions Congress assigned to the Education Department. They require enforcing legal obligations and giving students and families a clear place to turn when those obligations are not met. Moving special education administration to HHS and civil-rights enforcement to Justice could blur those lines of responsibility. The civil-rights transfer is especially sensitive given that DOJ is already pursuing school investigations tied to the administration’s civil rights priorities, including probes of sexual orientation, gender identity instruction, parental opt-out rights, and access to sex-separated facilities.

So yes, the system needs a coherent redesign. But “less bureaucracy” is not a high enough bar. Families need a system they can navigate and officials they can hold accountable. And the danger with the administration’s approach is that it could replace one front door with six side doors, creating a maze and not a map.

That danger is sharpest in special education and civil rights, where federal agencies administer substantial funding and enforce legal protections. These are trust functions, not just administrative assignments. Special education alone sends roughly $15 billion a year to states and schools, supporting services for students whose rights are protected under federal law. Moving special education administration to HHS and civil rights enforcement to Justice raises practical questions, such as whether families will know where to turn if funds are delayed, services are denied, or complaints go unresolved.

Those concerns are not confined to Democrats. Sen. Bill Cassidy of Louisiana, the Republican chair of the Senate Health, Education, Labor and Pensions Committee, has objected to moving special education to HHS and argued that Labor would be the better fit, if it must move at all. He’s agreed to hold a vote on Democrat sponsored legislation that would block the transfer.

The Labor agreements may offer a more promising model. Better alignment among K–12 schools, apprenticeship programs, and colleges could strengthen pathways from school to work.

But moving programs to a new agency will matter only if it produces better coordination for students. That is why these agreements should be judged by five practical questions:

1. Do they make the system easier to navigate? If a state, district, family, or community organization needs help, is there a clear place to start, with public points of contact, plain-English responsibilities, and clear timelines and appeals?

2. Do they preserve accountability? The Education Department may retain legal responsibility for many programs while other agencies handle day-to-day operations, which can work only if someone is clearly answerable when problems arise. Shared responsibility often sounds efficient until something goes wrong, when it can become no one’s responsibility.

3. Do they protect rights? Civil rights, disability protections, student privacy, and services for vulnerable students must not become casualties of administrative redesign. A smaller federal role still needs strong guardrails.

4. Do they improve outcomes? The measure should not be whether Washington moved boxes on an organizational chart. The measure should be whether students read better, graduate at higher rates, find stronger pathways to work, receive promised services, and have their rights protected.

5. Do they help states build capacity rather than simply shift burdens? Returning authority to states can be healthy. But state flexibility without state capacity is an invitation to unevenness. Some states will innovate. Others may struggle. The federal government’s job should be to create room for state leadership while ensuring transparency, comparability, and basic protections.

This is where the slogan “return education to the states” needs more content. States don’t need Washington to micromanage every decision, but they need coherent rules, reliable data, and a federal partner that helps connect education to work and opportunity. Families need a clear sense of what they’re entitled to, where to go, and who’s accountable.

The administration is right that education policy now spans schools, colleges, employers, workforce boards, and other agencies (though one can argue that it always has). Reorganizing the department could improve coordination and give states more room to lead. But dispersing programs across Washington will help only if states and families can still tell who is responsible, where to go for help, and how students’ rights will be enforced.

That is the standard by which this effort should be judged. A smaller federal role may be sensible, but it should produce clearer pathways and unmistakable lines of accountability. States and families should have a map they can follow, not a maze they must navigate.

Brian R. Fitzpatrick, Ph.D.
7.2.2026
Empty classroom
Getty Images/DONGSEON_KIM
Listen to this article
Loading the Elevenlabs Text to Speech AudioNative Player...

A new white paper from NWEA, and its accompanying op-ed in The Hill, claim that districts are more likely to permanently shutter schools with a high proportion of poor and/or Black students, even after controlling for enrollment patterns. Which made me think: Here we go again. As with previous analyses from other scholars, it plays the greatest hits: document that Black and poor students are overrepresented in some unfortunate circumstance (in this case, school closures), control for one or two non-discrimination explanations, watch the Black/poor coefficient not quite go to zero, and conclude that bias is the culprit. In 2024, Vladimir Kogan published a tour de force explaining why that interpretive move fails, along with a phenomenal review of research on school closure. I won’t retread where he walked, but it’s well worth a read.

The new paper asks four questions. The first two—Did closure rates change post-Covid? And are Black and poor schools overrepresented among closures?—are answered with clean, descriptive statistics. Unsurprisingly, disadvantaged students disproportionately attend schools at risk of closure: School closure stems from declining enrollment, and disadvantaged students are more likely to attend schools that parents of all backgrounds would rather their students not attend. Also, closure rates dipped right after Covid, likely due to the infusion of federal funds, but are trending back towards pre-Covid rates. The interesting questions are the last two: Do those racial disparities in exposure to school closure hold after accounting for enrollment declines? And what about poverty discrepancies?

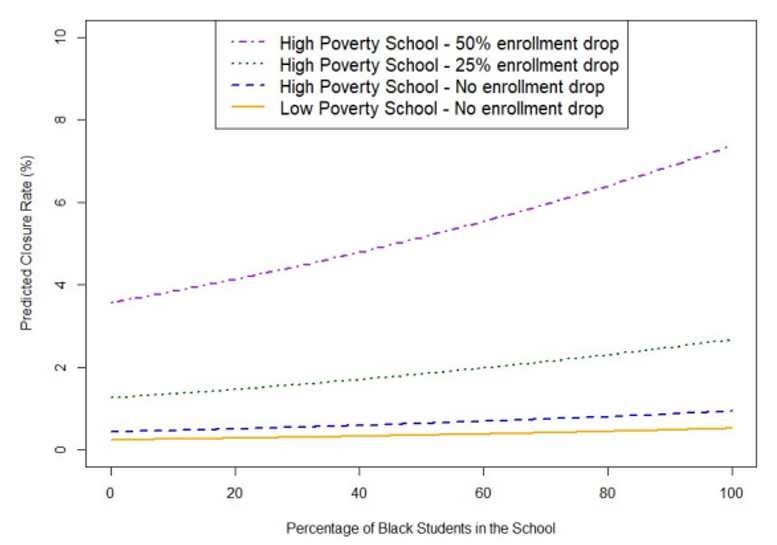
On the racial disparity question, the authors argue that schools serving larger shares of Black students are more likely to close even after differences in enrollment decline are taken into account. They offer Figure 3, below, as evidence for that claim. What it actually shows is that the predicted closure rate rises as the share of Black students increases. Moreover, three of the four lines are nearly flat, while the one that rises sharply likely represents a very small and unusual group of schools. How small? The authors do not say. The figure includes no ranges showing how uncertain these estimates are, and the authors do not provide the underlying statistical results (no coefficients, no standard errors, no p-values). Readers therefore cannot tell whether the differences are statistically significant or could simply be due to chance. Nor do the authors explain how they measured enrollment decline. Did they divide schools into groups based on the size of their decline, or did they treat enrollment decline as a continuous measure and simply choose 50 percent as an extreme example for the graph? Each approach would raise their own questions, but the reader is left guessing. Showing a figure with rising lines and calling it evidence of a disparity, while hiding the model behind it, is insufficient. The racial disparity question is not answered. It is gestured at.

Figure 3: Predicted likelihood of a school closure in 2024–25 by the percentage of Black students under various scenarios

1

Note: The presented results are the predicted probability of a school closing in 2024–25 conditional on (a)  percent of Black students in the school, (b) school-poverty level, and (c) degree of enrollment drop between 2020 and 2024.

The poverty question is worse. The abstract and conclusion both state that poverty disparities “hold after accounting for enrollment declines.” This claim does not appear in the methods section, is not tested in any model presented in the paper, and has no corresponding figure. Figure 3 holds school poverty level constant and looks at how closure risk changes with the share of Black students. It therefore cannot tell us whether high-poverty schools remain more likely to close after enrollment decline is taken into account. The finding simply does not exist in the paper that supposedly produced it.

It is difficult to avoid the conclusion that the authors are driven by an aversion to school closure, especially since they show their hand in their op-ed summarizing the paper. Here, their only reference to school closure as necessary part of fiscal responsibility is to wave this concern away: “What’s more, school closures do not always achieve their end goal of cost savings. A growing body of national evidence shows that the fiscal benefits of school closures can vary.” The results of daily exercise can “vary”; there is a chance, for example, you will get hit by a bus while out on a run. This is a textbook case of focusing on the downside risk of the policy one dislikes while ignoring the downside risk of one’s preferred policy. On that note: When school districts overspend on under-capacity schools, it costs disadvantaged families money. Everyone pays sales and property taxes!

They conclude by saying, “Finally, policymakers must address the root causes that make closures appear inevitable in the first place. These include gentrification that displaces families, declines in state public education funding and broader housing and economic patterns that reduce school enrollment.” This is a pretty transparent indication that the authors assume that schools only lose enrollment due to structural forces rather than the fact that a small subset of U.S. schools are miserable places where most parents of attending students are constantly looking for an alternative—hence the declining enrollment. These are often schools with daily fights, chaotic classrooms, despondent teachers, and scared students. When families avoid a school, they are telling us something, and we should listen.

When a district is operating below capacity to the detriment of its finances, it should prioritize closing schools that have experienced the largest and most sustained enrollment declines—something data can show directly. That may mean closures fall disproportionately on schools serving Black and poor students, but the disparity alone does not establish that those students were treated unfairly. Closing them is not a symptom of bias against those students, but a sign that the district has finally come around to caring about them. The politicians and district leaders willing to act on this and preserve the financial integrity of struggling districts are few and far between. Studies like this one make that case harder to win. And given the weakness of the evidence marshaled here, that is unfortunate.

SOURCE: Jazmin Isaacs, Megan Kuhfeld, Sofia Postell, and Ayesha K. Hashim, Post-Pandemic School Closure Trends: Schools Serving Black Students Disproportionately Closed (NWEA, 2025).

Policy Priority:
High Expectations
Topics:
Evidence-Based Learning
School Finance
Governance
Teachers & School Leaders
Jill Hoppe
7.2.2026
Sad student
Getty Images/Ridofranz
Listen to this article
Loading the Elevenlabs Text to Speech AudioNative Player...

A recent study in the Journal of Educational Psychology examines the extent to which disruptive classroom environments contribute to children’s experiences of victimization (i.e., bullying) in elementary school.

Using data from the Early Childhood Longitudinal Study, Kindergarten Class of 2010–11, researchers tracked a cohort of 11,373 students from kindergarten through fifth grade, focusing on student and teacher survey data from the end of the students’ third-, fourth-, and fifth-grade years. The student questions explored their perceived experiences with verbal, relational (e.g., social exclusion), reputational (e.g., spreading rumors), and physical victimization. Teachers reported on levels of classroom disruptiveness (for example, the concentration of students displaying dysregulated, oppositional, inattentive, or off-task behaviors). Teachers also provided information about their classroom composition, including class size, absenteeism rates, the percentage of students with disabilities, the percentage of English language learners, and other demographic and academic characteristics.

To estimate the relationship between classroom disruptiveness and victimization, the researchers compared changes in students’ classroom environments with changes in their reported experiences of victimization. The study yields three main findings.

First, exposure to classroom disruptiveness was not evenly distributed across student groups. Black students, boys, students with disabilities, and students from low- and middle-income families were more likely than White students, girls, students without disabilities, and students from high-income families to be assigned to disruptive classrooms. The gap was especially large for Black students.

Second, classroom disruptiveness was associated with higher levels of reported victimization. A one-standard-deviation increase in classroom disruptiveness corresponded to increases of approximately 0.03 standard deviations in total, verbal, and reputational victimization and a 0.04 standard deviation increase in physical victimization. While these effects are modest, they were statistically significant across each form of victimization.

Finally, the researchers examined whether classroom disruptiveness affected some student groups more than others. The answer was essentially no. While Black students, boys, and students with disabilities appeared to experience somewhat larger increases in victimization associated with classroom disruptiveness, these results were not statistically significantly different from those for White children, girls, and students without disabilities. The effects were also consistent across different socioeconomic subgroups.

Taken together, the three findings suggest that disruptive classroom environments increase the risk of victimization broadly, affecting students across demographic groups—and that marginalized students are more likely to be in disruptive classrooms, and therefore more likely to victimized.

It is worth noting several limitations of this study. First, measures of victimization relied on student self-reports, which may be influenced by differences in perception or willingness to disclose experiences. In addition, classroom disruptiveness was measured through teacher reports rather than direct observation. Teachers may differ in what they consider disruptive behavior, and ratings may be influenced by classroom context, teaching experience, or individual expectations.

Still, the link between classroom environment and victimization makes sense. Disruptive classrooms strain teachers’ ability to manage peer interactions effectively. Teachers must simultaneously maintain academic rigor, manage behavior, monitor student relationships, and support students’ social and emotional development. When disruptive behavior consumes a disproportionate share of teachers’ attention, harmful peer interactions may be more likely to go unnoticed.

This study relies on data collected more than a decade ago. Since then, the Covid pandemic and the rise of smartphones, social media, and cyberbullying has fundamentally altered how students interact with one another, potentially changing the relationship between classroom climate and victimization. It is worth replicating this research, perhaps expanding to cover middle and high schools where peer dynamics become more complex and interactions increasingly extend beyond the classroom and into online spaces.

While efforts to prevent bullying often focus on individual students or targeted interventions, this study suggests that reducing classroom disruptiveness should also be considered part of a broader, multilevel strategy to reduce victimization.

SOURCE: Qingqing Yang, Eric Hengyu Hu, Jiho Park, Yoonkyung Oh, and Paul L. Morgan, “Are Elementary School Children Bullied More When They Attend Disruptive Classrooms? A Child-Fixed-Effects Analysis,” Journal of Educational Psychology (March 2026).

Pagination

  • First page « First
  • Previous page ‹ Previous
  • Page 23
  • Page 24
  • Page 25
  • Page 26
  • Current page 27
  • Page 28
  • Page 29
  • Page 30
  • Page 31
  • Next page Next ›
  • Last page Last »
Fordham Logo

© 2026 The Thomas B. Fordham Institute
Privacy Policy
Usage Agreement

National

P.O. Box 110
Burke, VA 22009

202.223.5452

[email protected]

Ohio

P.O. Box 82291
Columbus, OH 43202

614.223.1580

[email protected]

Sponsorship

130 West Second Street, Suite 410
Dayton, Ohio 45402

937.227.3368

[email protected]