How much influence do teacher unions still wield in today’s K–12 education landscape?
To answer that question, researchers Melissa Arnold Lyon, Sandy Frost Waldron, and Rebecca Jacobsen analyzed the latest publicly available data and responses from a new survey of K–12 stakeholders in all 50 states and the District of Columbia to produce a comprehensive update to Fordham’s 2012 rankings of state teacher union strength.
Their results show that the K–12 landscape has grown more crowded and contested over the last fifteen years. In many places, teacher unions are no longer necessarily the most powerful voice in the room.
All individual state profiles are available here.
Foreword
By Amber M. Northern and Michael J. Petrilli
In 2012, we released a landmark study, How Strong Are U.S. Teacher Unions? A State-By-State Comparison, that was the first to measure teacher union strength comprehensively across multiple dimensions and all 50 states. Since then, numerous scholars have used our measure in their research on unions’ effects.
Yet, even as our understanding of unions improved, the landscape of education politics has evolved in directions that complicate old assumptions about union power. For example, in 2015 the Every Student Succeeds Act (ESSA) reduced the federal role in accountability, thus returning substantial authority over education to the state level, where teacher unions have often exercised greater influence. Yet, by the end of the decade, the U.S. Supreme Court’s ruling in Janus v. AFSCME—building on earlier state-level fights such as Wisconsin Act 10—had delivered a blow to unions’ revenues and membership by ending their ability to collect mandatory fees from teachers who were not union members.
Shortly thereafter, the Covid-era pivot to remote learning thrust teacher unions into the national spotlight again, mostly in ways that seemed to undermine their standing, as evidence of learning loss mounted and criticism of the lengthiest closures intensified. Meanwhile, the school choice movement continued to gain momentum and erode the market share of traditional public schools—unions’ traditional strongholds—while the backlash against “CRT” and other perceived excesses of culturally progressive educators fueled the rise of conservative parent groups, such as Moms for Liberty, that were rarely aligned with their local unions.
Throughout this entire period, the education reform advocacy ecosystem also grew larger and more robust. As one indicator, the number of national, state, and local organizations that joined the Policy Innovators in Education Network grew from approximately 30 groups in 2012 to more than 180 groups today. State-level reform groups are now active in almost every state. Thus, when state lawmakers debate education policy legislation, unions are no longer necessarily the most informed or powerful organizations to show up, testify, and lobby for their desired outcomes.
Impressionistically, these events have produced an education politics landscape that is more crowded, more contested, and less predictable than it was a decade ago. But as always, we were eager to get beyond impressions. So, we asked labor union researchers Melissa Arnold Lyon (University of Albany), Sandy Frost Waldron (independent researcher), and Rebecca Jacobsen (Michigan State University) if they would be willing to update our 2012 report.
Building on our original study, they set out to gauge teacher union strength in each of the 50 states and the District of Columbia (D.C.). Collectively, the 59 measures—which include 29 new measures that were not in the original report—seek to quantify union strength in five key areas: Resources and Membership; Involvement in Politics; Labor and Bargaining Policies; Policy Wins and Losses; and Perceived Influence, which draws from an original survey examining how stakeholders in each of the 50 states and D.C. perceive teacher union strength today.
Table F-1 shows the overall rankings alongside the rankings for each of the five areas (sortable by column). Per the table, the states with the strongest teacher unions are Vermont, California, Massachusetts, New Jersey, and Hawaii. The states with the weakest teacher unions are Arkansas, Oklahoma, Tennessee, North Carolina, and Mississippi.
Table F-1. Which states have the strongest teacher unions?

The full report explains how these rankings were calculated. Additional details about each area and indicator are also provided, along with more factoids and state-specific observations than we have time for here.
Below, however, are our three topline takeaways.
1. Teacher unions appear to be weakening.
Though it may sound fanciful to education reformers in Chicago, where the teacher union is as militant and powerful as ever, overall the data suggest that teacher unions are weaker than they were a decade ago. For example, the percentage of K–12 teachers who were union members fell in 45 states plus D.C., with especially large drops in North Carolina and Wisconsin, where they have been the target of much-debated legislation. Similarly, teacher unions’ share of contributions to state political parties declined in 34 states, in part because of reduced union investment and in part because of increased spending by other actors.
With less membership and revenue, of course, come weakened political influence and diminished perceptions of credibility. And in fact, our survey of education stakeholders suggests that most no longer view their state’s teacher union as an uncontested force in K–12 education.
2. Blue states still have the strongest unions.
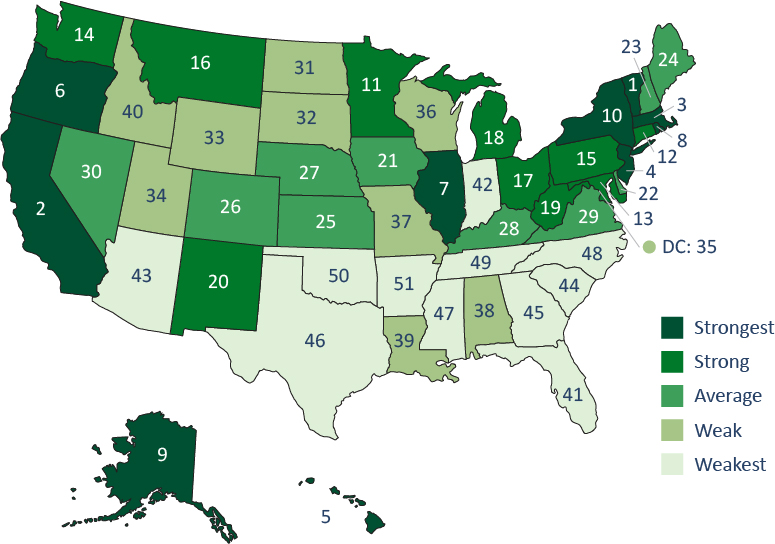
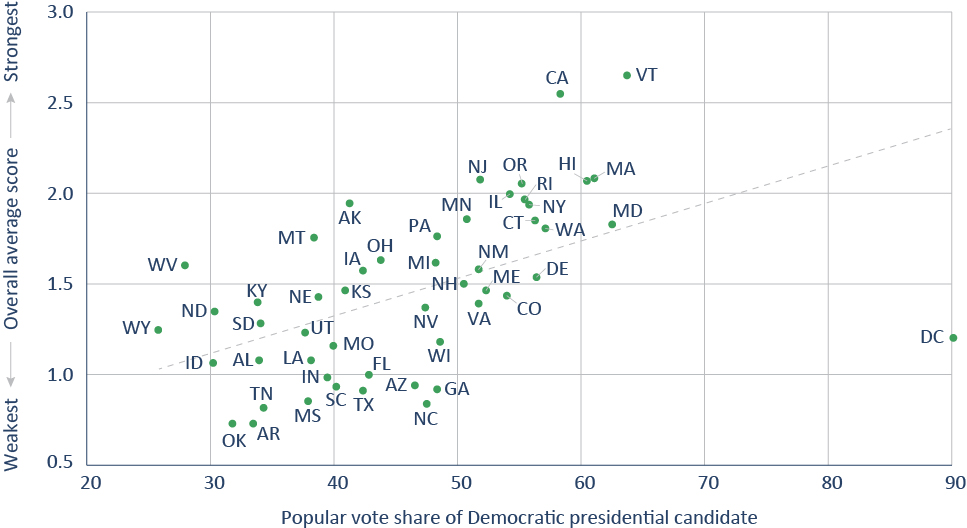
Of the ten states with the strongest teacher unions, eight had Democratic trifectas in 2024—Democratic leadership in the governor’s office and both legislative chambers. Moreover, 13 of the 15 states with the strongest unions went blue in the 2024 presidential election (Alaska and Pennsylvania were the exceptions). At the other end of the table, not a single blue state landed among the bottom 20 states for union strength (not counting Washington, D.C., which was number 35). So, while much has happened since we published our original study on this topic, the longstanding relationship between unions and the Democratic party has endured (Figure F-1).
Figure F-1. Teacher unions are strongest in “blue” states.
3. Some states have experienced notable changes in rank since 2012.
Between 2012 and 2025, ten states—Alabama, Indiana, Maryland, Massachusetts, Montana, New Mexico, Pennsylvania, Vermont, Virginia, and Wisconsin—experienced at least a ten-rank increase or decrease in overall rank. Another 17 states experienced at least a five-rank change. (Because of the number of methodological updates since our last report, these changes should be interpreted cautiously.) Still, seven states stayed in the top ten, and another seven stayed in the bottom ten. So, not everything has changed.
***
The ecosystem of state education politics grows ever more crowded, with some new actors aligned with traditional union priorities but a seemingly larger number often working against them. Of course, teacher unions are still a major force in state-level education politics. But as our report demonstrates, they have a more complex landscape to navigate. And for those of us in education reform, the same may be true: Though union interests must still be reckoned with, there are many others with a seat at the table. To ensure the spread of policies and practices that are grounded in evidence and best for kids, we’ll need to rethink our assumptions about who or what stands in the way.
Introduction
Over the past fifty years, teacher unions[1] have established themselves as powerful actors in education policymaking, particularly at the state level, where the constitutional authority for governing education lies. Directly and indirectly, unions have influenced educational policies, school spending, and student achievement.[2] But this influence varies across states. In 2012, the Thomas B. Fordham Institute released the first comprehensive state-by-state ranking of teacher union strength, a framework that has informed research and practice over the past decade and a half. This report updates and extends that analysis by addressing a central question: Across states, where are teacher unions strongest and weakest today?
Since 2012, three major national events have changed the context within which state teacher unions operate. First, the Supreme Court’s 2018 Janus v. AFSCME decision declared union agency fees unconstitutional for public-sector workers, including teachers. That is: Teacher unions can no longer negotiate to charge fees to nonmembers to fund collective bargaining efforts on their behalf. Second, the wave of “RedforEd” teacher strikes in 2018 and 2019—particularly in states such as West Virginia, North Carolina, Oklahoma, and Arizona—demonstrated that even in weak union states, teachers could mobilize for collective action. Third, the COVID-19 pandemic put teacher unions at the center of fraught debates over school reopening, remote instruction, and safety protocols. In some states, this moment strengthened the perceived influence of unions and may have helped them secure policy wins around working conditions. In others, slow reopening timelines may have generated political backlash with long-term consequences for public support.
Our updated rankings have taken into account a research base that has expanded since the original rankings’ publication. For example, more evidence now shows that state policies allowing collective bargaining strengthened teacher unions in the 1960s and ’70s, with little impact on school finance,[3] while policies that limit collective bargaining have both weakened teacher unions and led to decreases in school spending.[4] Other recent studies suggest that some teacher union activities ultimately help students, but others reduce school efficiency.[5] These studies have tended to frame teacher union activities as rooted in either “rent-seeking” or amplifying “teacher voice,” though the most recent research emphasizes unions’ more indirect, coalitional, and political efforts in state and local politics.[6]
We examine contemporary teacher union strength across states using 59 measures from publicly available datasets, public data compiled by our research team, and an original survey of education stakeholders in each state, which we fielded from June to October 2025. Using these data, we rank all 50 states and the District of Columbia (D.C.) both overall and within five core areas:
- Area A: Resources and Membership
- Area B: Involvement in Politics
- Area C: Labor and Bargaining Policies
- Area D: Policy Wins and Losses
- Area E: Perceived Influence
The rankings capture each state’s teacher union strength relative to other states, not strength in absolute terms. Collectively, they demonstrate that teacher union strength is multidimensional: States can have favorable laws but weak membership or can have strong perceived influence despite limited resources. Rather than treating teacher unions as a monolith, these rankings help us understand variation in the ways that teacher unions hold and exert influence across states, providing policymakers, advocates, and researchers with new knowledge on where and how teacher unions shape public education in the United States.
In this report, we first describe the areas, indicators, and sub-areas that our union strength rankings comprise, as well as our approach to creating the scores and rankings. We then present overall and area-specific rankings and highlight changes since the 2012 report for the sub-indicators that are most predictive of the overall rankings and consistent over time. Next, we examine relationships within and among the five areas and analyze state characteristics associated with union strength. Finally, we offer key takeaways and implications for policy and practice.
Data and Methods
We use a three-level structure to organize and analyze the data:
- Areas are the big-picture categories—the major ways union power shows up in the real world (e.g., “Resources and Membership”). We identify five areas of teacher union power (see Figure 1).
- Indicators are the specific concepts that we measure within each area. For example, “union membership” and “revenues” are among the indicators for the “Resources and Membership” area.
- Sub-indicators are the specific data we collected. They come from three sources: publicly available datasets, public data compiled by our research team, and an original survey of education stakeholders in each state. For example, “union density” is a sub-indicator for the indicator “Resources and Membership.”
Figure 1. Areas of state teacher union strength

Across all five areas, the report uses 59 sub-indicators. Of these, 30 are either direct updates of legacy sub-indicators or close adaptations that preserve continuity with the 2012 framework. Wherever possible, we updated the sub-indicators using the same sources. In cases where publicly available data are no longer tracked consistently or have disappeared entirely, we use the best available substitutes that capture similar dynamics. For more information, see Appendix Table A1.
We also added new data sources to complement the previous work. The 29 new sub-indicators reflect both changing contexts and our expanded, contemporary understanding of union strength. For all sub-indicators, we use the most recently available data.
Finally, six sub-indicators from the previous report are not included in the current analysis, in most cases because of limitations in availability of updated data.
For a full account of these changes, see Appendix B.

Area A: Resources and Membership
As Table 1 shows, the data in Area A: Resources and Membership measure the resources that teacher unions can mobilize to exert power in state politics, gauged via membership, organizational capacity, and financial resources. These include membership (A1), teacher strikes (A2), revenues (A3), and presence at the ballot box (A4).[7]
Table 1. Area A: Resources and Membership (20 percent of total score)
| A1. Union membership (5% of total score) |
Percentage of public-school teachers who are members of the union (2020–21) |
| Union density: percentage of all employees who are members of any union (2024) | |
| A2. Teacher strikes (5% of total score) |
Number of teacher strikes (2019–24) |
| Percentage of districts engaged in strikes (2019–24) | |
| A3. Revenues (5% of total score) |
Total yearly revenue per teacher of the state National Education Association (NEA) affiliate and/or the state American Federation of Teachers (AFT) affiliate, adjusted using the National Center for Education Statistics (NCES) Comparable Wage Index (2023) |
| A4. Union vote share (5% of total score) |
Percentage of state voters who are union members (2022) |
| Percentage of state voters who are both union members and employed in the educational services industry (2022) |
Area B: Involvement in Politics
As Table 2 shows, the indicators in Area B: Involvement in Politics measure the activities that unions engage in to exert power, including candidate endorsements (B1), financial contributions to campaigns and political parties (B2), and spending on political advertisements (B3). These indicators capture both overt forms of political influence and the agenda-setting role that teacher unions may play in politics.
Table 2. Area B: Involvement in Politics (20 percent of total score)
| B1. Candidate endorsements (6.67% of total score) |
Number of candidate endorsements by state teacher unions (2024 general election) |
| Percentage of endorsed candidates by state teacher unions who won their elections (2024 general election) | |
| B2. Financial contributions to campaigns and political parties (6.67% of total score) |
Percentage of all contributions to state-level candidates originating from teacher unions (2019–24) |
| Percentage of all contributions to state-level political parties originating from teacher unions (2019–24) | |
| Union contributions to state-level candidates, relative to other major interest groups (2021–23) | |
| B3. Political advertisements (6.67% of total score) |
Number of political ads sponsored by teacher unions (2020 and 2022) |
| Percentage of political ads sponsored by teacher unions (2020 and 2022) | |
| Amount of money spent on political ads by teacher unions (2020 and 2022) | |
| Percentage of political ad spending by teacher unions (2020 and 2022) |

Area C: Labor and Bargaining Policies
As Table 3 shows, the indicators and sub-indicators in Area C: Labor and Bargaining Policies consist of the laws, rules, and procedures under which teacher unions must operate for each state. These sub-indicators—automatic revenue policies (C1), scope of bargaining (C2), right to strike (C3), and collective bargaining exemptions (C4)—reflect the extent of constraints around union activity. For example, where collective bargaining is permitted, unions have a wider institutional opening to advance their interests.
Note that this area focuses on operational policies and therefore does not include other common union priorities, such as policies on teacher performance or school choice; the latter are captured in Area D: Policy Wins and Losses.
Table 3. Area C: Labor and Bargaining Policies (20 percent of total score)
| C1. Automatic revenue policies (5% of total score) |
Presence of state-level policies allowing or prohibiting automatic payroll deductions (2025) |
| C2. Legal scope of bargaining (5% of total score) |
Legality of collective bargaining (2025) |
| Breadth of bargaining: presence of state-level policies requiring, permitting, or prohibiting bargaining on 16 topics (2025) | |
| C3. Legal right to strike (5% of total score) |
Legality of teacher strikes (2025) |
| C4. Exemptions from collective bargaining (5% of total score) |
Presence of state-level policies allowing or prohibiting automatic collective bargaining exemptions for charter schools (school year [SY] 2018–19) |

Area D: Policy Wins and Losses
Area D: Policy Wins and Losses measures the extent to which state policy aligns with union priorities across ten policy areas (see Table 4). Of the ten indicators, three—relative state-level spending on education (D1), employment benefits (D5), and teacher compensation (D10)—gauge the amount of money going toward union priority causes. The other seven account for the presence or absence of specific policies. For example, because teacher unions typically advocate smaller class sizes, indicator D3 (class size) reflects the presence of a state-level policy restricting K–12 class sizes. Conversely, because teacher unions tend to oppose performance-based pay, indicator D2 (teacher performance pay) reflects the absence of a state-level policy requiring it.
Table 4. Area D: Policy Wins and Losses (20 percent of total score)
| D1. Relative spending on education at the state level (2% of total score) |
Percentage of the total annual K–12 budget spent on teacher salaries and benefits (SY 2021–22) |
| Total annual per-pupil expenditures, adjusted using the NCES Comparable Wage Index (SY 2021–22) | |
| Percentage of the state’s annual general budget spent on K–12 education (fiscal year [FY] 2023) | |
| D2. Teacher performance pay (2% of total score) |
Absence of state-level policies requiring the use of teacher performance in determining compensation (2022) |
| D3. Class size (2% of total score) |
Presence of state-level policies restricting K–12 class sizes (2024) |
| D4. Teacher evaluations (2% of total score) |
Absence of state-level policies allowing for dismissal based on ineffectiveness (2025) |
| Absence of state-level policies that require use of student growth measures in teacher evaluations (2025) | |
| D5. Employment benefits (2% of total score) |
Retirement: employer contribution rate to teacher retirement plans as a percentage of the payroll (FY 2022) |
| Tenure: presence of state-level policies providing tenure protections for K–12 teachers (2023) | |
| D6. Charter school structural limitations (2% of total score) |
Absence of state-level policies allowing the establishment of charter schools (2025) |
| Presence of state-level policies placing caps on or otherwise limiting the number of charters granted (2025) | |
| Presence of state-level policies limiting the types of charter schools allowed (2020) | |
| Absence of state-level policies allowing multiple authorizers for charter schools (2025) | |
| D7. Charter school policy exemptions (2% of total score) |
Absence of automatic exemptions from many state or local laws and regulations (2020) |
| Presence of state-level policies requiring teacher certification for charter schools (2020) | |
| D8. Unionized charter schools (2% of total score) |
Percentage of charter schools with collective bargaining (SY 2018–19) |
| D9. School choice and voucher policies (2% of total score) |
Absence of state-level policies allowing education savings accounts (ESAs) (2024) |
| Absence of state-level policies allowing tax-credit scholarships (2024) | |
| Absence of state-level policies allowing vouchers (2024) | |
| Percentage of the K–12 student population not using private education choice programs (SY 2021–22) | |
| Percentage of the K–12 student population using traditional public schools (SY 2021–22) | |
| D10. Teacher compensation (2% of total score) |
Average salary of public-school teachers (SY 2023–24) |

Area E: Perceived Influence
To collect data for Area E: Perceptions of Strength, we conducted an original survey of actors with knowledge of education policymaking in each state.[8] With the 2012 survey as a guiding framework, the new survey asked respondents how they perceived the power of teacher unions in their states, with questions mirroring the themes of Areas A, B, and D. We also included questions about perceptions of teacher union strength more generally. However, we did not include questions related to labor and collective bargaining policies (Area C), which are a matter of public record.
For example, to learn about perceptions of union resources and membership, we asked about the likelihood that teachers in their state would follow through with a strike if they said they would. Similarly, to assess perceptions of union political involvement, we solicited a characterization of how unions handle compromise in policymaking.
Because the survey captures respondents’ perceptions of union influence, it may not accurately reflect their influence on policy. For example, a respondent may assume teacher unions are powerful (or not) based on inaccurate information, popular narratives about unions, or historical experiences that may no longer hold. Still, perceptions are critical to shaping how policy elites respond to teacher unions throughout the policymaking process, and they help capture informal levers of power that may not be visible in other data.
To create the survey sample, we conducted extensive online searches to identify leaders across the following categories:
- Legislative leaders on education issues
- Governors’ education advisors
- State education administrators (state superintendents and state school board members)
- Teacher unions
- Education advocacy organizations
- Non-education advocacy organizations focused on children
- Journalists covering state education policy and politics
- Members of the business community engaged in education issues
As in 2012, we set a standard threshold for inclusion of at least three respondents from each state—and reached or exceeded it in all 50 states and D.C.[9] The survey was fielded between June and October 2025, with a total response rate of 25 percent. Among those who responded, 62 percent completed the full survey. In total, we received 171 completed surveys.
All survey questions referred to teacher unions as “teacher unions/associations” to ensure relevance in states where collective bargaining is prohibited or where unions refer to themselves as associations. See Table 5 for an overview of question topics. A complete list of survey questions can be found in Appendix Table A2.
Table 5. Area E: Perceived Influence (20 percent of total score)
| E1. Perceptions of available resources and membership (Area A) (5% of total score) |
Level of agreement with “Teacher unions/associations in [STATE] can mobilize members to engage in actions aligned with union/association priorities” |
| Breadth of mobilization activities: perceived ability of teacher unions to engage members in eight mobilization activities | |
| Perceived likelihood of following through on a threat to strike | |
| Perceived ability to leverage a strike to influence policy | |
| Perceived availability of local teacher union power | |
| E2. Perceptions of involvement in politics (Area B) (5% of total score) |
Perceived necessity of teacher union support to be elected or appointed to state-level office, average across four positions |
| Perceived need for teacher unions to compromise as a condition of influence | |
| Perceived influence over policy implementation | |
| Perceived influence via working relationships with legislators | |
| E3. Perceptions of policy wins and losses (Area D) (5% of total score) |
Level of agreement with “Teacher unions are effective in defeating education reform proposals with which they disagree” |
| Level of agreement with “State-level education policies reflect teacher union/association priorities” | |
| Level of agreement with “Teacher unions have been effective in keeping education spending steady by preventing or minimizing cuts in the education budget” | |
| Perceived influence on state-level education policies, average of measures of relative influence across six policy areas | |
| E4. Overall perceptions of state teacher union power (5% of total score) |
Identification of the teacher union as either the most or one of the most influential entities in K–12 education policymaking in the state |
| Perceived influence of teacher unions, relative to other policy influencers, on a scale of 0–100 | |
| Level of agreement with “Teacher unions/associations in [STATE] are stronger today than they were five years ago” |
Calculating Scores and Rankings
We constructed overall state rankings—as well as overall scores, area scores, and area rankings—through a multistep aggregation process that applied equal weighting across multiple levels. Consistent with the 2012 report, the equal-weighting approach reflects a methodological judgment that each dimension of union strength merits equivalent consideration in the overall ranking. The aggregation proceeded as follows:
- Standardization. We rescaled all sub-indicators to a consistent 0–4 scale, with higher values corresponding to greater union strength, so that we could combine sub-indicators with different original metrics (e.g., percentages, dollar amounts, survey responses).
- Indicator-level aggregation. For each indicator, we calculated the simple mean of all constituent sub-indicators within each state. This produced a single 0–4 score for each indicator in each state.[10]
- Area-level aggregation. For each state, we calculated the simple mean of all indicators within each area. This produced overall area scores for each state, which in turn allowed us to generate area-specific rankings.
- Overall scores. We calculated overall union strength by taking the simple mean of all five area scores for each state. Although the theoretical range of the overall strength score is 0–4, the observed range is 0.7–2.6, with a mean of 1.5 and a standard deviation of 0.5.
- Overall rankings. We rank state unions from strongest (highest overall strength score) to weakest (lowest overall strength score) based on their overall scores.
Rankings
Table 6 shows the overall rankings alongside the rankings for each of the five areas. The states with the strongest teacher unions are Vermont, California, Massachusetts, New Jersey, and Hawaii. The states with the weakest teacher unions are Arkansas, Oklahoma, Tennessee, North Carolina, and Mississippi.
Table 6. Which states have the strongest teacher unions?
Figure 2 shows how different dimensions of power contribute to each state’s total score and ranking. Vermont and California have notably stronger unions than other states.
Figure 2. Vermont and California have the strongest teacher unions.
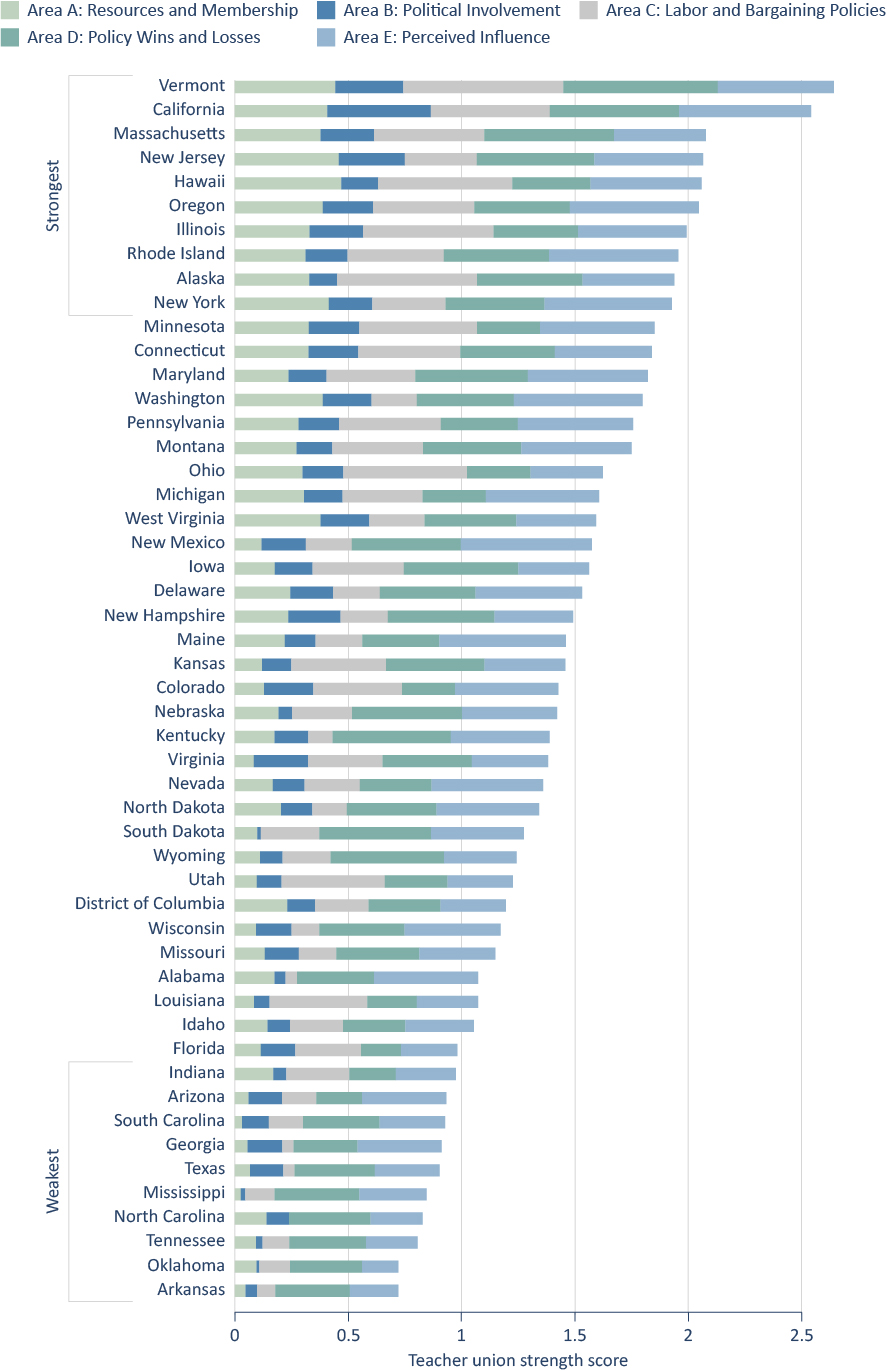
Per the table and the figure, the states with the strongest teacher unions tend to show “comprehensive” union strength. For example, Vermont, Massachusetts, and New York score highly across nearly all five areas, with particularly strong showings in Area A: Resources and Membership, Area E: Perceived Influence, and Area C: Labor and Bargaining Policies.
Conversely, the states with the weakest teacher unions are typically weak in all five areas. And the very weakest union states score especially low in Areas A, B, and C: Resources and Membership, Political Involvement, and Labor and Bargaining Policies. This suggests that teacher unions can maintain perceived influence (Area E) and secure some policy victories (Area D) even in states where they lack the organizational resources and friendly institutional environments of their counterparts in stronger union states—or perhaps that teacher-friendly policies are supported by voters and other education groups that advocate for them, even where teacher unions are weak.
Some states in the middle of the pack earned substantially different rankings in different areas. For example, Pennsylvania and Michigan have substantially lower scores in Area D: Policy Wins and Losses than they do in other area scores. Their reputations as historical union strongholds may mean state leaders perceive them as influential, even as they lack the political influence to shape education policies. The lack of policy wins may also be caused by other interest groups effectively aligning against union positions. Still other states rank mid-tier overall, between 21st and 35th, but rank highly in one area, showing “selective” union strength (Table 7).
Table 7. “Selective” strength states are often ranked highly in Area D: Policy Wins and Losses.
| Area of “Selective” Strength | Mid-Tier States with “Selective” Strength in This Area |
| A: Resources and Membership | None |
| B: Involvement in Politics | New Hampshire, Virginia |
| C: Labor and Bargaining Policies | Utah |
| D: Policy Wins and Losses | Iowa, Kentucky, South Dakota, Wyoming |
| E: Perceived Influence | Maine |
Rankings for Area A: Resources and Membership
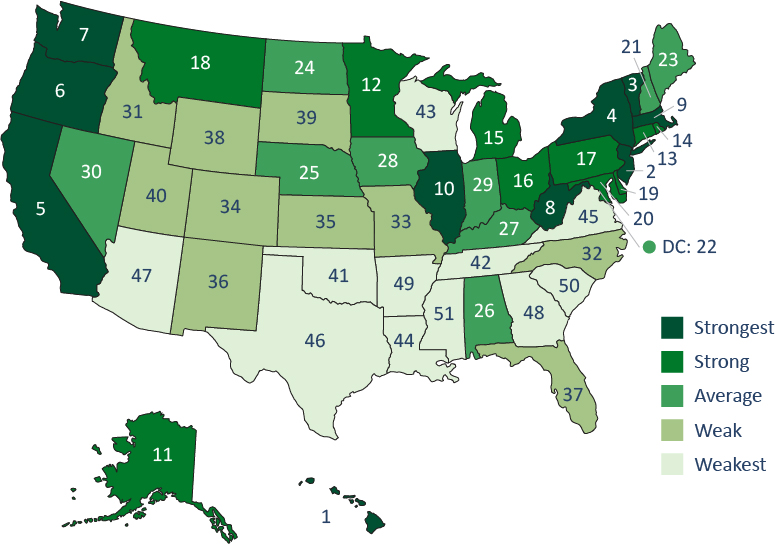
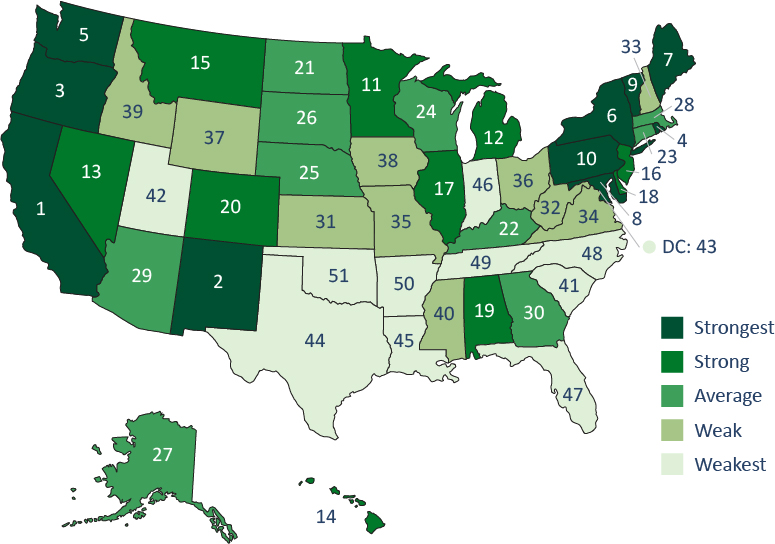
Figure 3 shows the geographic distribution of teacher union strength in Area A: Resources and Membership. Per the figure, the five states with the most strength in this area—Hawaii, New Jersey, Vermont, New York, and California—are all located in the Northeast or Pacific West, whereas the five states with the least strength—Arizona, Georgia, Arkansas, South Carolina, and Mississippi—are all located in the South or Southwest.
Figure 3. Union strength in “resources and membership” is concentrated in the Northeast and Pacific West.
Rankings for Area B: Involvement in Politics
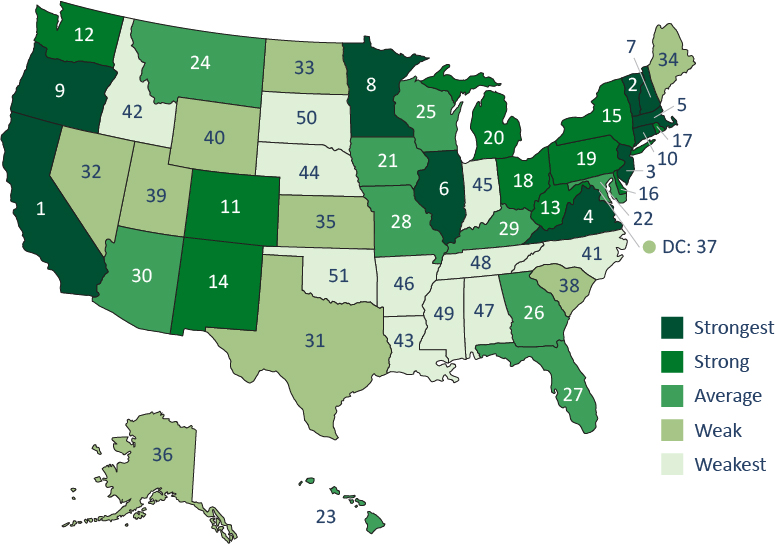
Figure 4 shows rankings for Area B: Involvement in Politics, specifically elections and campaigns. It is important to note that teacher unions contribute to both the Democratic and the Republican parties, including within the same state. Still, the five states with the highest levels of teacher union engagement in politics—California, Vermont, New Jersey, Virginia, and Massachusetts—are all “blue” states, whereas the five states with the weakest engagement in politics—Alabama, Tennessee, Mississippi, South Dakota, and Oklahoma—are “red” states.
Figure 4. Teacher unions tend to be more politically involved in “blue” states.
Rankings for Area C: Labor and Bargaining Policies
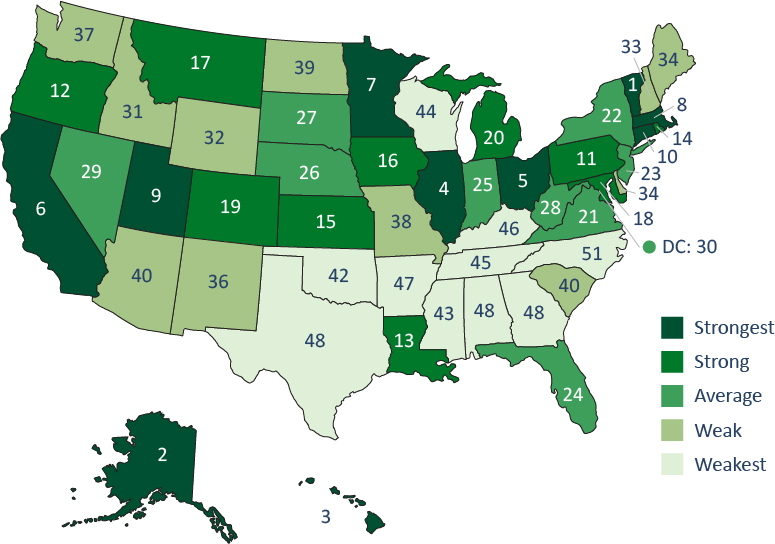
Figure 5 shows state rankings for Area C: Labor and Bargaining Policies. Per the figure, the five states with the most restrictive bargaining policies—Arkansas, Georgia, Texas, Alabama, and North Carolina—are in the South, whereas the five states with bargaining policies most favorable to teacher unions—Vermont, Alaska, Hawaii, Illinois, and Ohio—are in other regions.
Figure 5. Southern states tend to have the least union-friendly labor and bargaining policies.
Rankings for Area D: Policy Wins and Losses
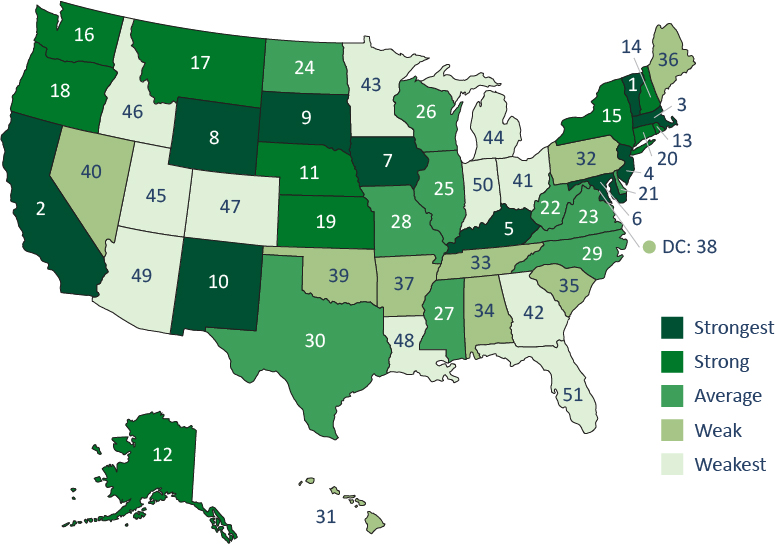
Figure 6 shows the rankings for Area D: Policy Wins and Losses. Although policy context generally aligns with union strength, the states with the strongest teacher unions don’t consistently rank highly in Area D. For example, the five states with the most union-aligned education policies are Vermont, California, Massachusetts, New Jersey, and Kentucky; although the first four of these are the top four in overall strength, Kentucky is much lower on the list, coming in 28th. At the other end of the spectrum, the five states with policy environments least aligned with teacher union policy positions are Colorado, Louisiana, Arizona, Indiana, and Florida. The last three are among the bottom ten in overall strength, but Louisiana is a little higher, at 39th, and Colorado is mid-tier overall, at 26th.
Figure 6. States with the most union-aligned education policies don't necessarily have the strongest teacher unions.
Rankings for Area E: Perceived Strength
Figure 7 shows the perceived influence of teacher unions in each state. The five states where perceived influence is strongest are California, New Mexico, Oregon, Rhode Island, and Washington. The five states where perceived influence is weakest are Florida, North Carolina, Tennessee, Arkansas, and Oklahoma.
Figure 7. Observers in the South perceive teacher unions as less influential than those in other regions.
PATTERNS OF TEACHER UNION STRENGTH
The previous section highlights some of the patterns that emerge from the overall and area rankings. Below, we investigate these patterns more formally and comprehensively.
In general, the relationships discussed in this section are simple correlations. In other words, they show whether two things tend to vary together, not whether one causes the other or how they interact with other factors.
Which Sub-Indicators Matter Most?
To understand the factors that matter most for teacher union strength, we examine the correlations between each sub-indicator and the state’s overall union strength score. Think of each of these correlations as a test: How well could you predict a state’s overall union strength score if you knew just one piece of information about it? A correlation of zero would mean a sub-indicator has no predictive power. A correlation of 1 would indicate the ability to perfectly predict the overall score with the sub-indicator in question.
Table 8 shows the ten sub-indicators that are most correlated with overall strength. See Appendix Table A7 for a full list.
Table 8. Union membership, voter share, and revenues are strongly correlated with overall union strength.
| Area | Factor | Correlation |
| A | Percentage of teachers who are members of the union | 0.82*** |
| A | Percentage of state voters who are union members | 0.81*** |
| A | State union density (2024) | 0.81*** |
| A | Total 2023 revenue per teacher of state NEA/AFT, adjusted using NCES CWI | 0.81*** |
| E | Perceptions of Area D: Policy Wins and Losses | 0.73*** |
| A | Percentage of state voters who are union members and in educational services | 0.70*** |
| D | Teacher salary in SY 2023–24 | 0.70*** |
| E | General perceptions | 0.66*** |
| E | Perceptions of Area A: Members and Resources | 0.63*** |
| D | Total annual per-pupil expenditures per state, adjusted using NCES CWI | 0.62*** |
Notes: *** p<0.001; estimates reflect correlations with the overall state score. Table 8 shows the ten most correlated factors. See Appendix Table A7 for all correlation coefficients.
Union membership, voter share, and revenues seem to matter most. For example, 92 percent of public-school teachers are union members in the ten states with the strongest teacher unions, compared with just 60 percent of teachers in the other 41 states and D.C. Similarly, 11 percent of voters in the top ten states are labor union members, whereas the share of voters who are labor union members is less than half that (5 percent) in all other states. And teacher unions in the top ten states collect an average of $877 per teacher annually, compared with just $356 per teacher everywhere else.
Stakeholder perceptions also generally track with overall teacher union strength. In other words, when state leaders say unions are powerful in their states, they’re describing patterns that are also evident in the other observed measures of union strength.
Similarly, teacher policies and union strength are correlated. For example, states where unions are more powerful tend to be states that pay teachers more and spend more per pupil, even with adjustments for regional cost differences. Again, we don’t know whether strong unions cause higher spending or whether the same state characteristics that lead to generous education funding also create favorable conditions for union organizing.
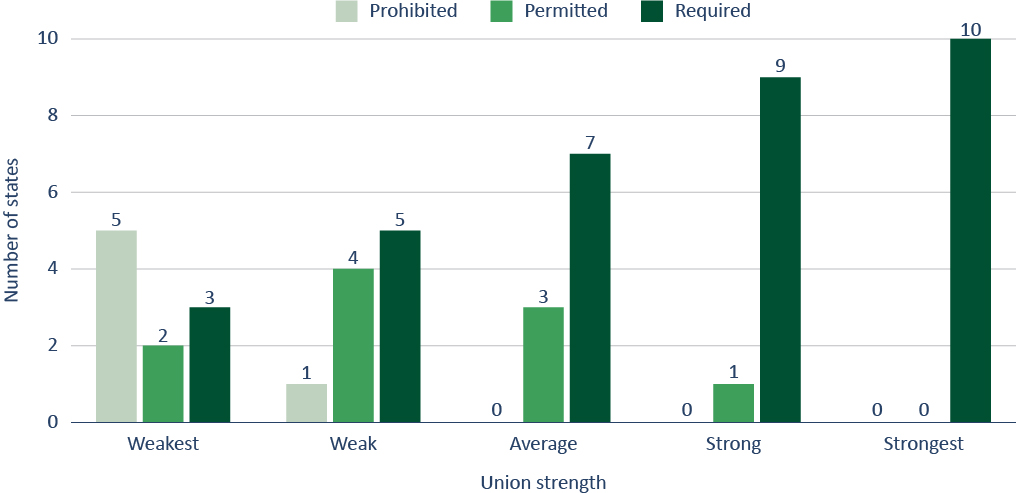
Finally, collective bargaining laws are correlated with union strength, but perhaps less than expected. Per Figure 8, the top ten strongest states all require district management to engage in collective bargaining if the majority of teachers in the district vote for it. However, 60 percent of states that are not in the top ten also require collective bargaining if teachers vote for it, and another 25 percent allow collective bargaining. And even three of the weakest union states require collective bargaining if teachers vote for it. In other words, although collective bargaining laws certainly matter, they do not guarantee teacher union strength at the state level.
Figure 8. All of the states with the strongest teacher unions require collective bargaining.
Which Sub-Indicators Matter Least?
Teacher policy wins and losses are generally correlated with overall strength, but a few teacher policy wins and losses stand out as being particularly unrelated to overall strength. For example, half of the top ten states have a state policy that limits class sizes for at least some K–12 grades, but so do 44 percent of states that aren’t in the top ten. In fact, policies setting a cap on class sizes are actually more common in the ten states with the weakest unions, seven of which have statewide caps.
Other notable policies that are seemingly unrelated to the overall ranking include the share of each state’s general budget that is spent on K–12 education, whether student test-score growth is used in teacher evaluations, and the degree to which state law allows for the creation of different types of charter schools. See Appendix Table A7 for details on policies that are most and least correlated with union strength.
Which Areas Are Correlated with Each Other?
As Appendix Table A8 indicates, Area A: Resources and Membership and Area B: Involvement in Politics are the most highly correlated with each other. In other words, state unions with more members and money tend to be more politically active. Similarly, Area A is strongly related to Area C: Labor and Bargaining Policies and Area E: Perceived Influence, suggesting that organizational strength may also translate into both favorable labor laws and stakeholder perceptions of union clout, or vice versa.
In contrast, Area C: Labor and Bargaining Policies and Area D: Policy Wins and Losses are the least correlated, suggesting that states can have union-friendly labor laws on the books without their unions necessarily winning their current policy battles—and vice versa. As noted, this disconnect hints at an important reality: Statutory protections for collective bargaining don’t automatically translate into union wins. After all, most states with collective bargaining protections enacted those laws in the 1960s and 1970s, when the configuration of interest groups at the state and local levels was very different from what it is today.
To be clear, there is a relationship between labor and education policies—states with union-friendly labor policies are somewhat more likely to have more union-friendly education policies—but that’s the weakest link among all the areas we examine. If union strength were really driven by these laws, and if teacher unions were really the strongest players in education politics, then the states with stronger laws would be the states where education policies best match typical union preferences.
How Does Union Strength Relate to Demographic, Economic, and Political Characteristics?
To understand the types of states where teacher unions are strongest and weakest, we examine how union strength relates to 24 state demographic, economic, and political characteristics.[14] See Appendix Table A9 for a complete account of these relationships.
In general, political factors have the strongest relationships to teacher union strength relative to the other external factors we considered. As Figure 9 shows, states where the Democratic presidential candidate received a larger share of the vote in 2024 generally also had stronger teacher unions. For example, in the ten states with the strongest teacher unions, the Democratic presidential candidate won 56 percent of the vote in 2024, compared with just 44 percent elsewhere. Moreover, eight of these ten states had Democratic trifectas in 2024, as did nine of the other 40 states, meaning that Democrats held the governorship and majorities in both legislative chambers. Even economic policies unrelated to education tell the same story. For example, the ten strongest union states have minimum wages averaging $15 per hour, compared with $10 in other states. In short, teacher union strength tracks closely with Democratic political power across multiple dimensions.
Figure 9. Teacher union strength is strongly correlated with Democratic vote share.
Notably, teacher unions are weaker in less advantaged places. For example, the ten states with the weakest teacher unions have markedly higher poverty rates: 17.5 percent compared with 13 percent elsewhere. Their residents are also less educated, with only 35 percent holding bachelor’s degrees, versus 40 percent in other states. Finally, these states have roughly twice the share of Black residents that other states have, 16.7 percent versus 8.7 percent.
Although these relationships suggest that teacher unions are weakest in states where students are least socioeconomically advantaged, they do not mean that students are faring worse academically. For example, some states with less wealthy populations, particularly in the South, have made substantial gains on the National Assessment of Educational Progress in recent years.[15]
How Have the Rankings Changed Since 2012?
Figure 10 compares the 2012 and 2026 rankings. The dashed line reflects an exact match between the 2012 and 2026 rankings. In other words, if a state falls on the line, it indicates no difference between its 2012 and 2026 rankings. For example, Kentucky came in 28th overall in both rankings, and Georgia was 45th both times. If a state is above the line, its relative ranking has increased since 2012, and if it is below the line, its relative position has decreased.
Figure 10. Virginia's teacher unions have grown stronger in recent years, while Wisconsin's have grown weaker.
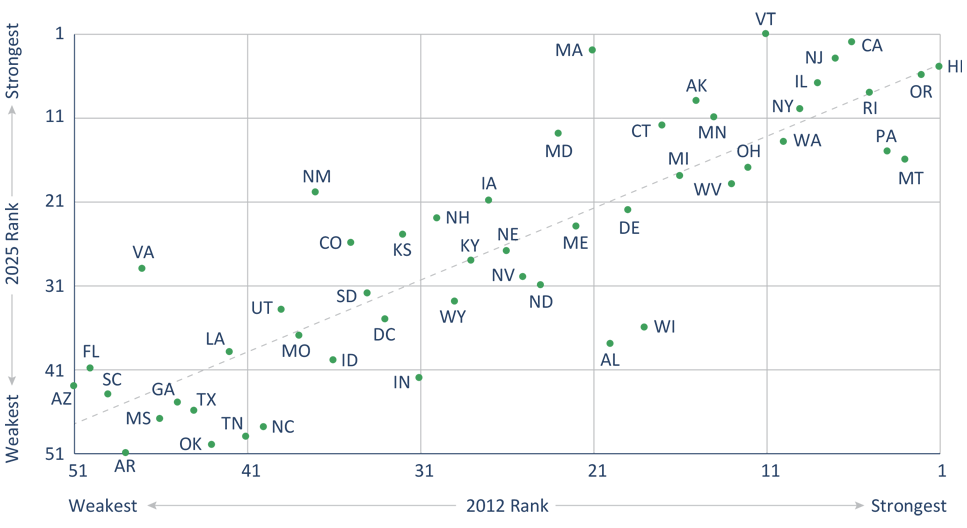
Nine states moved 10 or more positions in either direction. In the largest decline, Wisconsin fell from 18th to 36th, perhaps a consequence of the 2011 law that limited collective bargaining. Conversely, Virginia jumped from 47th to 29th, the most dramatic rise among the historically weak-union Southern states. This change may be related to a law implemented in 2021, which removed Virginia’s prior prohibition against teacher collective bargaining.
Yet there was notable stability for many other states’ rankings. Eighteen states changed by three or fewer rank positions. Seven states were ranked in the top ten both times: California, Hawaii, Illinois, New Jersey, New York, Oregon, and Rhode Island. At the other end, seven states consistently ranked in the bottom ten: Arizona, Arkansas, Georgia, Mississippi, Oklahoma, South Carolina, and Texas.
We advise caution in interpreting comparisons over time because these changes partly reflect methodological updates and structural shifts in the policy environment. Still, the broad areas of strength have remained consistent over time, and the relative rankings can provide informative snapshots for empirical examinations of relative change in strength across states over time.
While these comparisons focus on relative strength across the states and D.C., we also call attention to some changes over time on the legacy sub-indicators, which provide evidence of shifts in teacher union strength in both relative and absolute terms. One of the clearest trends since 2012 is the erosion of union membership. In 46 of 50 states, as well as D.C., the percentage of teachers belonging to unions has declined since 2012. And of course, declining membership doesn’t just reduce revenue; it weakens political influence, diminishes perceived credibility, and makes it harder to mobilize members for collective action. That may play a role in the finding that, proportionally speaking, teacher unions’ contributions to state-level political parties have decreased in 34 states and increased in 16. Tellingly, stakeholders have also noted a decline: Less than one-third of respondents to our survey listed the state teacher union as the most influential actor. In other words, other groups—governors, business coalitions, parent organizations, education reform advocates, or legislative leaders—are now perceived to be equally or more influential than teacher unions.
Takeaways
1. Teacher unions are stronger in blue states.
The strongest unions are concentrated in Democrat-led states, while the weakest are found in Republican-led states. This clear partisan difference is true no matter how we measure partisanship, whether by who governs, public opinion, votes cast, or non-education policies. For example, the average union strength ranking of states with Democratic trifectas is 12th, compared with an average rank of 35th for states with Republican trifectas. Although teacher union strength and influence are ever evolving, the association with Democratic leadership in the current political moment is indisputable—and it may be getting stronger. In the 2012 report, four of the ten strongest union states had Democratic trifectas; as of 2025, that figure had doubled, rising to eight of the strongest ten.
2. Teacher unions are weaker in less advantaged states.
States with the weakest teacher unions tend to have more challenging contexts for students. For example, weak union states have higher poverty rates and lower educational attainment. In the five weakest union states—Mississippi, North Carolina, Tennessee, Oklahoma, and Arkansas—19 percent of residents have incomes below the federal poverty line, compared with 10 percent of residents in the five strongest union states. Moreover, only 33 percent of residents have bachelor’s degrees in the five weakest union states, compared with 46 percent in the five strongest.
3. Union membership, voter share, and revenues matter most.
The strongest predictors of union strength are the share of teachers who are union members, the share of voters who belong to teacher unions and workers in any union, and union revenues per teacher. In the ten strongest union states, at least 90 percent of teachers belong to unions, compared with around 60 percent for all other states. The ten strongest union states also collect nearly $900 per teacher annually in revenue, on average, compared with just $350 in other states. This suggests that for future research looking for a longitudinal measure of teacher union strength over time, measures of membership rates and resources make the best proxies. These measures are also less prone to sudden, dramatic changes over time, particularly compared with measures that are more sensitive to political change, such as policy outcomes.
4. The landscape of state education policymaking is more crowded.
Whereas teacher unions once dominated state education politics, in many states there is now a wide range of groups competing to influence policy. The range of actors offered by these state experts is illuminating and paints a far more complex and varied policymaking landscape. New parent groups, voucher advocacy organizations, individual policy entrepreneurs, and national groups were named as the most influential actors in state education policymaking. Depending upon the constellation of groups in each state, teachers and their organizations may find their influence bolstered by like-minded allies and even advanced on their behalf when they are relatively weak. In other states, even well-resourced teacher unions may find that despite their strength, they face a growing number of adversaries that can effectively counter their policy agendas. Teacher unions do not function in a vacuum. How they interact in coalition with or in opposition to the growing number of groups seeking to shape the education agenda will significantly affect the ability of teacher unions to achieve policy wins.
Conclusion
Teacher unions have long been considered the “800-pound gorilla” of education politics. As such, they continue to influence state education policy, even in states where they lack formal bargaining rights. Still, it is important to resist the temptation to view state education politics solely through the lens of teacher union power. Other actors matter, and in many states, they matter more.
Our analysis suggests that the importance of these “other” actors is growing. Yet we know relatively little about them. If teacher unions are no longer the dominant force in most states, who is? How do governors, state boards of education, business coalitions, parent groups, and reform organizations exercise influence? How do these actors interact with one another and with teacher unions? And above all, how do these interactions affect students and schools?
In this complex, contested, and constantly evolving landscape, teacher unions remain central players. However, they operate within broader political ecosystems that shape their ability to translate resources and influence into tangible policy wins. Our rankings provide detailed maps of where unions are strongest and weakest today. The next challenge is understanding how that strength fits into the broader ecology of organizations and interests that shape American education today.
INDIVIDUAL STATE PROFILES
Table 9. State rankings of teacher union strength (Click the column headers to sort by state or overall rank.)
| State ▲▼ | Overall Rank ▲▼ |
| Alabama | 38 |
| Alaska | 9 |
| Arizona | 43 |
| Arkansas | 51 |
| California | 2 |
| Colorado | 26 |
| Connecticut | 12 |
| Delaware | 22 |
| District of Columbia | 35 |
| Florida | 41 |
| Georgia | 45 |
| Hawaii | 5 |
| Idaho | 40 |
| Illinois | 7 |
| Indiana | 42 |
| Iowa | 21 |
| Kansas | 25 |
| Kentucky | 28 |
| Louisiana | 39 |
| Maine | 24 |
| Maryland | 13 |
| Massachusetts | 3 |
| Michigan | 18 |
| Minnesota | 11 |
| Mississippi | 47 |
| Missouri | 37 |
| Montana | 16 |
| Nebraska | 27 |
| Nevada | 30 |
| New Hampshire | 23 |
| New Jersey | 4 |
| New Mexico | 20 |
| New York | 10 |
| North Carolina | 48 |
| North Dakota | 31 |
| Ohio | 17 |
| Oklahoma | 50 |
| Oregon | 6 |
| Pennsylvania | 15 |
| Rhode Island | 8 |
| South Carolina | 44 |
| South Dakota | 32 |
| Tennessee | 49 |
| Texas | 46 |
| Utah | 34 |
| Vermont | 1 |
| Virginia | 29 |
| Washington | 14 |
| West Virginia | 19 |
| Wisconsin | 36 |
| Wyoming | 33 |
Appendices
Table A1. Indicators, sub-indicators, and sources
| Indicator | Sub-indicator | Sources |
| A1. Union membership | A1-1. Percentage of all public-school teachers who are members of the union | U.S. Department of Education, National Center for Education Statistics, “National Teacher and Principal Survey, 2020–21 Public School Teachers (NTPS)” |
| A1-2. Union density: percentage of all employees who are members of any union | Hirsch, Barry T., David A. Macpherson, and William E. Even, “Union Membership, Coverage, and Earnings from the CPS,” 2025, https://unionstats.com | |
| A2. Teacher strikes | A2-1. Total number of teacher strikes | Lyon, Melissa Arnold, Matthew A. Kraft, and Matthew P. Steinberg, 2024. The Causes and Consequences of U.S. Teacher Strikes. August. National Bureau of Economic Research. https://doi.org/10.3386/w32862 |
| A2-2. Percentage of districts engaged in strikes | Lyon, Melissa Arnold, Matthew A. Kraft, and Matthew P. Steinberg, 2024. The Causes and Consequences of U.S. Teacher Strikes. August. National Bureau of Economic Research. https://doi.org/10.3386/w32862 | |
| A3. Revenues | A3-1. Total yearly revenue per teacher of the state National Education Association (NEA) affiliate and/or the state American Federation of Teachers (AFT) affiliate, adjusted using the National Center for Education Statistics (NCES) Comparable Wage Index (CWI) | Suozzo, Andrea, Alec Glassford, Ash Ngu, and Brandon Roberts, “ProPublica NonProfit Explorer,” accessed October 22, 2025, https://projects.propublica.org/nonprofits/ U.S. Department of Education, National Center for Education Statistics, Common Core of Data (CCD), “Public Elementary/Secondary School Universe Survey,” 2021–22, Provisional Version 1a, “Local Education Agency Universe Survey,” 2021–22, Provisional Version 1a, and “State Nonfiscal Survey of Public Elementary/Secondary Education,” 2021–22, Provisional Version 1a, https://nces.ed.gov/ccd/tables/202122_summary_2.asp |
| A4. Union vote share | A4-1. Percentage of state voters who are union members | Schaffner, Brian, Stephen Ansolabehere, and Marissa Shih, “Cooperative Election Study Common Content, 2022,” Harvard Dataverse, V2, 2023, https://doi.org/10.7910/DVN/PR4L8P |
| A4-2. Percentage of state voters who are both union members and employed in the educational services industry | Schaffner, Brian, Stephen Ansolabehere, and Marissa Shih, “Cooperative Election Study Common Content, 2022,” Harvard Dataverse, V2, 2023, https://doi.org/10.7910/DVN/PR4L8P | |
| B1. Candidate endorsements | B1-1. Total number of candidate endorsements by state-level teacher unions | Endorsements as listed on state-level union websites, local news, and state-level union social media, as collected by the research team |
| B1-2. Percentage of endorsed candidates by teacher unions who won their elections | Election results as reported on state election websites and Ballotpedia, 2025, https://ballotpedia.org/Main_Page | |
| B2. Financial contributions to campaigns and political parties | B2-1. Percentage of all contributions to state-level candidates originating from teacher unions | National Institute on Money in Politics, “Follow the Money database,” accessed Jan. 29, 2025, https://www.followthemoney.org 2019–24 |
| B2-2. Percentage of all contributions to state-level political parties originating from teacher unions | National Institute on Money in Politics, “Follow the Money database,” accessed Jan. 29, 2025, https://www.followthemoney.org 2019–24 |
|
| B2-3. Union contributions to state-level candidates, relative to other major interest groups (Industry Influence in 2012 report) Six-year lagged measure: total teacher union contributions to state-level candidates divided by the total contributions to state-level candidates by the ten highest other “specific businesses” |
National Institute on Money in Politics, “Follow the Money database,” accessed Jan. 29, 2025, https://www.followthemoney.org 2021–23 |
|
| B3. Political advertisements | B3-1. Total number of political advertisements paid for by teacher unions | Wesleyan Media Project, “Political Advertising in 2022,” release version 1.0, Aug. 2025. Wesleyan Media Project, “Political Advertising in 2020,” release version 1.0, Jan. 2023. |
| B3-2. Percentage of all political ads that were paid for by teacher unions | Wesleyan Media Project, “Political Advertising in 2022,” release version 1.0, Aug. 2025. Wesleyan Media Project, “Political Advertising in 2020,” release version 1.0, Jan. 2023. |
|
| B3-3. Total amount of money spent on political ads by teacher unions | Wesleyan Media Project, “Political Advertising in 2022,” release version 1.0, Aug. 2025. Wesleyan Media Project, “Political Advertising in 2020,” release version 1.0, Jan. 2023. |
|
| B3-4. Percentage of all political ad spending paid for by teacher unions | Wesleyan Media Project, “Political Advertising in 2022,” release version 1.0, Aug. 2025. Wesleyan Media Project, “Political Advertising in 2020,” release version 1.0, Jan. 2023. |
|
| C1. Automatic revenue policies | C1-1. Presence of state-level policies allowing or prohibiting automatic payroll deductions | National Conference of State Legislatures, “Unions and Collective Bargaining Legislation Database,” accessed Jan. 2025, https://www.ncsl.org/labor-and-employment/unions-and-collective-bargaining-legislation-database |
| C2. Legal scope of bargaining | C2-1. Legality of collective bargaining for teachers | National Council on Teacher Quality, “Teacher Contract Database,” custom report, data retrieved 2025, https://www.nctq.org/contract-database/stateReport?reportId=50155669 |
| C2-2. Breadth of collective bargaining: presence of state-level policies requiring, permitting, or prohibiting bargaining across 16 topics | National Council on Teacher Quality, “Teacher Contract Database,” custom report, data retrieved 2025, https://www.nctq.org/contract-database/stateReport?reportId=50155669 | |
| C3. Legal right to strike | C3. Legality of teacher strikes | National Council on Teacher Quality, “Teacher Contract Database,” custom report, data retrieved 2025, https://www.nctq.org/contract-database/stateReport?reportId=50155669 |
| C4. Exemptions from collective bargaining | C4. Presence of state-level policies allowing or prohibiting automatic collective bargaining exemptions for charter schools | National Alliance for Public Charter Schools, “Unionized Charter Schools: Data from 2018–2019,” report, Dec. 2020, https://publiccharters.org/wp-content/uploads/2023/01/napcs_unionization_rd3.pdf |
| D1. Relative spending on education at the state level | D1-1. Percentage of the total annual K–12 budget spent on teacher salaries and benefits | U.S. Department of Education, National Center for Education Statistics, “SY 2021–22 National Public Education Financial Survey,” Common Core of Data, May 2024, https://nces.ed.gov/ccd/files.asp |
| D1-2. Total annual per-pupil expenditures | U.S. Department of Education, National Center for Education Statistics, “SY 2021–22 National Public Education Financial Survey,” Common Core of Data, May 2024, https://nces.ed.gov/ccd/files.asp | |
| D1-3. Percentage of total annual general budget spent on K–12 education | National Association of State Budget Officers, “2024 State Expenditure Report,” Table 7, https://higherlogicdownload.s3.amazonaws.com/NASBO/9d2d2db1-c943-4f1b-b750-0fca152d64c2/UploadedImages/SER%20Archive/2024_SER/2024_State_Expenditure_Report_S.pdf | |
| D2. Teacher performance pay | D2-1. Presence of state-level policies requiring that performance measures be considered when determining teacher pay | National Council on Teacher Quality, “Teacher Compensation Strategies,” Figure 4, Sept. 2022, https://www.nctq.org/research-insights/state-of-the-states-2022-teacher-compensation-strategies/ |
| D3. Class size | D3-1. Presence of state-level policies restricting K–12 class sizes | National Council on Teacher Quality, “Reimagining the Teaching Role: How Strategic Staffing can Attract and Retain Effective Teachers,” full data download, Sept. 16, 2024, https://reimagineteaching.nctq.org/ |
| D4. Teacher evaluations | D4-1. Presence of state-level policies allowing for dismissal based on ineffectiveness | National Council on Teacher Quality, “Teacher Contract Database,” custom report, accessed 2025, https://teacherquality.nctq.org/contract-database/stateReport?reportId=50155669 |
| D4-2. Presence of state-level policies that require use of student growth measures in teacher evaluations | National Council on Teacher Quality, “Teacher Contract Database,” custom report, accessed 2025, https://teacherquality.nctq.org/contract-database/stateReport?reportId=50155669 | |
| D5. Employment benefits | D5-1. Employer contribution rate to teacher retirement plans as a percentage of payroll | Equable, “Pension Contributions by State 2022,” table State Pension Contributions by Plan Fiscal Year Ending 2022, Nov. 10, 2022, https://equable.org/pension-contributions-by-state-2022/ |
| D5-2. Presence of state-level policies providing tenure protections for K–12 teachers | National Education Association, “Teacher Tenure & Due Process Protections for Educators,” Tenure and Due Process Protections map, March 2023, https://www.nea.org/resource-library/teacher-tenure-due-process-protections-educators | |
| D6. Charter school structural limitations | D6-1. Presence of state-level policies allowing the establishment of charter schools | Meyer, Ciara. “The 3 States that don’t allow charter schools—and why,” Education Week, Charter authorization laws by state map, Aug. 4, 2025, https://www.edweek.org/policy-politics/the-3-states-that-dont-allow-charter-schools-and-why/2025/08 National Conference of State Legislatures, “Education Choice State Policy Scan: Charter Schools,” updated Jul. 21, 2025, https://www.ncsl.org/education/education-choice-state-policy-scan-charter-schools |
| D6-2. Presence of state-level policies limiting the number of charters granted (caps on charter schools) | National Conference of State Legislatures, “Education Choice State Policy Scan: Charter Schools,” updated Jul. 21, 2025, https://www.ncsl.org/education/education-choice-state-policy-scan-charter-schools | |
| D6-3. Presence of state-level policies limiting the types of charter schools allowed | Education Commission of the States, “50-state Comparison: Charter School Policies,” updated Jan. 2020, https://www.ecs.org/charter-school-policies/ | |
| D6-4. Presence of state-level policies allowing multiple authorizers for charter schools | National Conference of State Legislatures, “Education Choice State Policy Scan: Charter Schools,” updated Jul. 21, 2025, https://www.ncsl.org/education/education-choice-state-policy-scan-charter-schools Education Commission of the States, “50-state Comparison: Charter School Policies,” updated Jan. 2020, https://www.ecs.org/charter-school-policies/ |
|
| D7. Charter school policy exemptions | D7-1. Presence of automatic exemptions from many state or local laws and regulations | Education Commission of the States, “50-state Comparison: Charter School Policies,” updated Jan. 2020, https://www.ecs.org/charter-school-policies/ |
| D7-2. Presence of state-level policies requiring teacher certification for charter schools | Education Commission of the States, “50-state Comparison: Charter School Policies,” updated Jan. 2020, https://www.ecs.org/charter-school-policies/ | |
| D8. Unionized charter schools | D8-1. Percentage of charter schools with collective bargaining | National Alliance for Public Charter Schools, “Unionized Charter Schools: Data from 2018–2019,” report, Dec. 2020, https://publiccharters.org/wp-content/uploads/2023/01/napcs_unionization_rd3.pdf |
| D9. School choice and voucher policies | D9-1. Presence of state-level policies allowing education savings accounts | Erwin, Ben, “50-State Comparison: Private School Choice,” Education Commission of the States, Jan. 24, 2024, https://www.ecs.org/50-state-comparison-private-school-choice-2024/ |
| D9-2. Presence of state-level policies allowing tax-credit scholarships | Erwin, Ben, “50-State Comparison: Private School Choice,” Education Commission of the States, Jan. 24, 2024, https://www.ecs.org/50-state-comparison-private-school-choice-2024/ | |
| D9-3. Presence of state-level policies allowing vouchers | Erwin, Ben, “50-State Comparison: Private School Choice,” Education Commission of the States, Jan. 24, 2024, https://www.ecs.org/50-state-comparison-private-school-choice-2024/ | |
| D9-4. Percentage of the total K–12 student population not using private education choice programs | Ritter, Colyn, “2024 EdChoice Share: Exploring where America’s Students are Educated,” Table EdChoice Share, updated Dec. 2024, https://www.edchoice.org/2024-edchoice-share-exploring-where-americas-students-are-educated/ | |
| D9-5. Percentage of the total K–12 student population using traditional public schools (excludes alternatives: private schools, homeschooling, charter schools, and magnet schools) | Ritter, Colyn, “2024 EdChoice Share: Exploring where America’s Students are Educated,” Table EdChoice Share, updated Dec. 2024, https://www.edchoice.org/2024-edchoice-share-exploring-where-americas-students-are-educated/ | |
| D10. Teacher compensation | D10-1. Average salary for public-school teachers | National Education Association, “Educator Pay Data 2025,” April 29, 2025, https://www.nea.org/resource-library/educator-pay-and-student-spending-how-does-your-state-rank |
| E1. Perceptions of available resources and membership | E1-1–5. Average response across five items related to constructs from Area A: Resources and Membership | 2025 Survey Data |
| E2. Perceptions of involvement in politics | E2-1–4. Average response across four items related to constructs from Area B: Involvement in Politics | 2025 Survey Data |
| E3. Perceptions of policy wins and losses | E3-1–4. Average response across four items related to constructs from Area D: Policy Wins and Losses | 2025 Survey Data |
| E4. Overall perceptions of state teacher union power | E4-1–3. Average response across three items related to overall perceptions of union strength | 2025 Survey Data |
| Indicator | Sub-indicator | Survey Questions |
| E1: Perceptions of Resources and Membership | E1-1 | Teacher unions/associations in STATE can mobilize members to engage in actions aligned with union/association priorities. |
| E1-2 | E1-2a. Mobilize members to vote in school board elections | |
| E1-2b. Mobilize members to vote in general elections | ||
| E1-2c. Mobilize members to vote on education ballot issues or budgets | ||
| E1-2d. Mobilize members to lobby local and state political leaders | ||
| E1-2e. Mobilize members to run for elected office | ||
| E1-2f. Mobilize members to participate in public meetings/hearings | ||
| E1-2g. Mobilize members to protest or demonstrate | ||
| E1-2h. Mobilize members to strike | ||
| E1-3 | Likelihood teachers in STATE will actually strike if they say they will | |
| E1-4 | Extent to which the possibility of strikes affects union influence | |
| E1-5 | Local union strength in STATE | |
| E2: Perceptions of Involvement in Politics | E2-1 | E2-1a. Need for union support: Democrats running for state-level office |
| E2-1b. Need for union support: Republicans running for state-level office | ||
| E2-1c. Need for union support: state board of education members | ||
| E2-1d. Need for union support: chief state school officer/superintendent | ||
| E2-2 | Description of how unions/associations handle compromise in policymaking | |
| E2-3 | E2-3a. Influence on implementation of passed education policy | |
| E2-3b. Influence shaping teacher professional development (PD)/training for new policies | ||
| E2-4 | E2-4a. Working relationships with key Democrats in the legislature | |
| E2-4b. Working relationships with key Republicans in the legislature | ||
| E3: Perceptions of Policy Wins and Losses | E3-1 | E3-1a. Influence on vouchers/education savings accounts |
| E3-1b. Influence on teacher evaluation reform | ||
| E3-1c. Influence on school safety | ||
| E3-1d. Influence on collective bargaining reform | ||
| E3-1e. Influence on school spending | ||
| E3-1f. Influence on teacher salaries and benefits | ||
| E3-1g. Influence on diversity, equity, and inclusion (DEI) | ||
| E3-1h. Influence on curriculum reform | ||
| E3-2 | Since 2022: Effectiveness in defeating reform proposals the union opposes | |
| E3-3 | Since 2022: State education policies reflecting union priorities | |
| E3-4 | Since 2022: Effectiveness keeping education spending steady | |
| E4: Perceived Influence, General | E4-1 | Most influential entity in state K–12 policymaking |
| E4-2 | Influence allocation: Teacher unions’ share of 100 points | |
| E4-3 | Strength of teacher unions today versus five years ago |
Table A3. The percentage of K-12 teachers who are union members has decreased in most states.
| State | Percent of all public-school teachers in the state who are members of the union | Change in percentage points over time | |
| 2012 Report | 2026 Report | ||
| Wisconsin | 98.34 | 44.57 | -53.77 |
| North Carolina | 49.46 | 21.06 | -28.40 |
| District of Columbia | 84.52 | 63.25 | -21.27 |
| Arizona | 44.53 | 28.53 | -16.00 |
| Michigan | 91.99 | 76.61 | -15.38 |
| Tennessee | 58.74 | 44.11 | -14.63 |
| Nevada | 74.60 | 61.00 | -13.60 |
| Colorado | 62.38 | 49.02 | -13.36 |
| Idaho | 62.24 | 48.90 | -13.34 |
| Texas | 62.71 | 50.29 | -12.42 |
| Utah | 63.58 | 52.65 | -10.93 |
| Indiana | 73.70 | 62.83 | -10.87 |
| Louisiana | 57.80 | 46.96 | -10.84 |
| Alabama | 85.59 | 74.81 | -10.78 |
| Virginia | 51.13 | 40.71 | -10.42 |
| Mississippi | 36.75 | 26.53 | -10.22 |
| Delaware | 90.05 | 80.51 | -9.54 |
| Nebraska | 85.29 | 76.21 | -9.08 |
| Alaska | 89.26 | 80.30 | -8.96 |
| Wyoming | 53.17 | 44.35 | -8.82 |
| Georgia | 54.82 | 47.15 | -7.67 |
| Minnesota | 95.74 | 88.36 | -7.38 |
| Oregon | 95.18 | 88.19 | -6.99 |
| South Dakota | 54.13 | 47.51 | -6.62 |
| Iowa | 73.29 | 67.28 | -6.01 |
| Missouri | 76.56 | 70.77 | -5.79 |
| Oklahoma | 57.52 | 52.02 | -5.50 |
| Kansas | 54.73 | 49.48 | -5.25 |
| California | 93.60 | 88.37 | -5.23 |
| Rhode Island | 97.36 | 92.33 | -5.03 |
| Maine | 77.14 | 72.36 | -4.78 |
| Ohio | 91.48 | 88.38 | -3.10 |
| South Carolina | 26.88 | 24.24 | -2.64 |
| Pennsylvania | 93.36 | 91.17 | -2.19 |
| North Dakota | 74.69 | 72.79 | -1.90 |
| New York | 98.38 | 96.62 | -1.76 |
| Illinois | 96.24 | 94.91 | -1.33 |
| Kentucky | 58.38 | 57.14 | -1.24 |
| Washington | 97.98 | 96.79 | -1.19 |
| Connecticut | 98.84 | 97.70 | -1.14 |
| Arkansas | 34.67 | 33.76 | -0.91 |
| Massachusetts | 92.79 | 92.14 | -0.65 |
| New Mexico | 41.03 | 40.64 | -0.39 |
| Hawaii | 96.72 | 96.34 | -0.38 |
| Montana | 82.55 | 82.45 | -0.10 |
| New Jersey | 97.10 | 97.04 | -0.06 |
| New Hampshire | 84.36 | 85.36 | 1.00 |
| Florida | 55.84 | 58.10 | 2.26 |
| Maryland | 84.85 | 88.99 | 4.14 |
| West Virginia | 68.17 | 72.95 | 4.78 |
| Vermont | 82.36 | 91.84 | 9.48 |
Table A4. The percentage of political contributions to state-level political parties that come from teacher unions has decreased in over two-thirds of states.
| State | Percent of all contributions to state-level political parties originating from state teacher unions | Change in percentage points over time | |
| 2012 Report | 2026 Report | ||
| Alabama | 9.73 | 0.009 | -9.717 |
| Michigan | 4.18 | 0.62 | -3.564 |
| Idaho | 3.11 | 0.016 | -3.094 |
| New York | 3.37 | 0.302 | -3.066 |
| Nevada | 2.77 | 0.149 | -2.625 |
| North Carolina | 2.70 | 0.612 | -2.086 |
| Rhode Island | 3.67 | 1.919 | -1.751 |
| Wisconsin | 1.93 | 0.25 | -1.684 |
| Montana | 2.72 | 1.221 | -1.502 |
| Nebraska | 2.87 | 1.386 | -1.481 |
| Florida | 1.69 | 0.352 | -1.341 |
| South Dakota | 1.54 | 0.397 | -1.141 |
| Ohio | 3.02 | 2.068 | -0.947 |
| Maine | 1.14 | 0.42 | -0.724 |
| South Carolina | 1.20 | 0.485 | -0.71 |
| Oregon | 1.23 | 0.566 | -0.669 |
| North Dakota | 0.59 | 0.08 | -0.507 |
| Maryland | 1.29 | 0.788 | -0.505 |
| California | 4.25 | 3.748 | -0.502 |
| Hawaii | 0.95 | 0.473 | -0.475 |
| Wyoming | 0.45 | 0.00 | -0.447 |
| Utah | 0.66 | 0.264 | -0.399 |
| New Hampshire | 0.45 | 0.087 | -0.364 |
| Kansas | 0.49 | 0.221 | -0.266 |
| Georgia | 0.34 | 0.076 | -0.265 |
| Missouri | 0.39 | 0.137 | -0.249 |
| Washington | 1.97 | 1.729 | -0.244 |
| Texas | 0.47 | 0.266 | -0.201 |
| Arkansas | 0.21 | 0.019 | -0.186 |
| Oklahoma | 0.18 | 0.039 | -0.139 |
| Kentucky | 0.57 | 0.475 | -0.092 |
| Mississippi | 0.07 | 0.00 | -0.073 |
| Massachusetts | 0.25 | 0.21 | -0.045 |
| West Virginia | 1.53 | 1.532 | -0.002 |
| Tennessee | 0.89 | 0.988 | 0.102 |
| New Mexico | 0.78 | 0.912 | 0.129 |
| New Jersey | 0.68 | 0.809 | 0.129 |
| Alaska | 0.00 | 0.172 | 0.172 |
| Virginia | 0.17 | 0.398 | 0.233 |
| Indiana | 0.20 | 0.464 | 0.264 |
| Connecticut | 1.98 | 2.527 | 0.552 |
| Pennsylvania | 0.04 | 0.605 | 0.564 |
| Arizona | 0.95 | 1.529 | 0.576 |
| Illinois | 0.60 | 1.254 | 0.653 |
| Iowa | 2.23 | 3.349 | 1.118 |
| Colorado | 0.84 | 2.096 | 1.253 |
| Delaware | 0.55 | 2.113 | 1.561 |
| Minnesota | 2.17 | 4.036 | 1.867 |
| Louisiana | 1.09 | 2.984 | 1.891 |
| Vermont | 0.72 | 3.64 | 2.918 |
| District of Columbia | N/A | N/A | N/A |
Table A5. There were few changes to state-level collective bargaining laws between 2012 and 2025.
| State | Legality of collective bargaining | Increase (+) in union power / Decrease (-) in union power | |
| 2012 Report | 2026 Report | ||
| Alabama | Permitted | Prohibited | - |
| Arizona | Permitted | Prohibited | - |
| North Dakota | Mandatory | Permitted | - |
| Tennessee | Mandatory | Collective conferencing (non-binding) | - |
| Idaho | Permitted | Mandatory | + |
| Missouri | Permitted | Mandatory | + |
| Ohio | Permitted | Mandatory | + |
| Oklahoma | Permitted | Mandatory | + |
| Virginia | Prohibited | Permitted | + |
| Alaska | Mandatory | Mandatory | no change |
| Arkansas | Permitted | Permitted | no change |
| California | Mandatory | Mandatory | no change |
| Colorado | Permitted | Permitted | no change |
| Connecticut | Mandatory | Mandatory | no change |
| Delaware | Mandatory | Mandatory | no change |
| District of Columbia | Mandatory | Mandatory | no change |
| Florida | Mandatory | Mandatory | no change |
| Georgia | Prohibited | Prohibited | no change |
| Hawaii | Mandatory | Mandatory | no change |
| Illinois | Mandatory | Mandatory | no change |
| Indiana | Mandatory | Mandatory | no change |
| Iowa | Mandatory | Mandatory | no change |
| Kansas | Mandatory | Mandatory | no change |
| Kentucky | Permitted | Permitted | no change |
| Louisiana | Permitted | Permitted | no change |
| Maine | Mandatory | Mandatory | no change |
| Maryland | Mandatory | Mandatory | no change |
| Massachusetts | Mandatory | Mandatory | no change |
| Michigan | Mandatory | Mandatory | no change |
| Minnesota | Mandatory | Mandatory | no change |
| Mississippi | Permitted | Permitted | no change |
| Montana | Mandatory | Mandatory | no change |
| Nebraska | Mandatory | Mandatory | no change |
| Nevada | Mandatory | Mandatory | no change |
| New Hampshire | Mandatory | Mandatory | no change |
| New Jersey | Mandatory | Mandatory | no change |
| New Mexico | Mandatory | Mandatory | no change |
| New York | Mandatory | Mandatory | no change |
| North Carolina | Prohibited | Prohibited | no change |
| Oregon | Mandatory | Mandatory | no change |
| Pennsylvania | Mandatory | Mandatory | no change |
| Rhode Island | Mandatory | Mandatory | no change |
| South Carolina | Prohibited | Prohibited | no change |
| South Dakota | Mandatory | Mandatory | no change |
| Texas | Prohibited | Prohibited | no change |
| Utah | Permitted | Permitted | no change |
| Vermont | Mandatory | Mandatory | no change |
| Washington | Mandatory | Mandatory | no change |
| West Virginia | Permitted | Permitted | no change |
| Wisconsin | Mandatory | Mandatory | no change |
| Wyoming | Permitted | Permitted | no change |
Table A6. Most states moderately increased per-pupil spending between 2012 and 2025.
| State | Total annual per-pupil expenditures per state, adjusted using the NCES Comparable Wage Index | Change in per-pupil expenditures | |
| 2012 Report (adjusted for inflation) |
2026 Report | ||
| Wyoming | $25,837.61 | $23,620.00 | ($2,217.61) |
| Alaska | $23,129.48 | $21,615.08 | ($1,514.40) |
| Montana | $19,695.75 | $18,520.66 | ($1,175.08) |
| Idaho | $12,641.00 | $12,319.41 | ($321.58) |
| South Dakota | $16,061.34 | $16,165.88 | $104.55 |
| Arkansas | $15,382.02 | $15,698.54 | $316.51 |
| Kansas | $17,240.04 | $17,570.44 | $330.40 |
| Hawaii | $18,718.41 | $19,151.19 | $432.77 |
| Louisiana | $17,522.32 | $18,241.61 | $719.29 |
| Oklahoma | $13,397.63 | $14,123.84 | $726.21 |
| Nebraska | $18,336.55 | $19,125.29 | $788.74 |
| Maryland | $18,165.74 | $18,961.11 | $795.37 |
| Indiana | $14,898.63 | $15,751.70 | $853.07 |
| Alabama | $14,757.24 | $15,645.57 | $888.33 |
| Arizona | $12,376.68 | $13,356.16 | $979.49 |
| Florida | $13,693.60 | $14,758.05 | $1,064.44 |
| Mississippi | $13,882.78 | $14,996.38 | $1,113.60 |
| Iowa | $17,170.45 | $18,288.31 | $1,117.86 |
| West Virginia | $18,275.85 | $19,488.83 | $1,212.98 |
| North Carolina | $12,904.51 | $14,179.87 | $1,275.36 |
| Virginia | $14,436.05 | $15,813.64 | $1,377.59 |
| Georgia | $14,052.68 | $15,473.74 | $1,421.06 |
| Missouri | $15,636.55 | $17,173.38 | $1,536.83 |
| New Mexico | $15,730.87 | $17,335.56 | $1,604.68 |
| Maine | $20,865.73 | $22,494.41 | $1,628.68 |
| Rhode Island | $20,831.05 | $22,459.92 | $1,628.87 |
| Wisconsin | $16,849.93 | $18,487.46 | $1,637.53 |
| Nevada | $11,959.40 | $13,638.34 | $1,678.94 |
| Tennessee | $12,433.57 | $14,230.26 | $1,796.69 |
| Utah | $10,320.64 | $12,149.95 | $1,829.31 |
| Minnesota | $16,404.79 | $18,979.23 | $2,574.44 |
| Massachusetts | $19,106.39 | $21,738.70 | $2,632.30 |
| South Carolina | $14,639.41 | $17,357.79 | $2,718.38 |
| Texas | $12,374.85 | $15,304.12 | $2,929.27 |
| Ohio | $16,276.82 | $19,253.58 | $2,976.76 |
| New Hampshire | $19,332.82 | $22,474.23 | $3,141.41 |
| Kentucky | $14,630.07 | $17,783.72 | $3,153.66 |
| North Dakota | $17,482.10 | $20,784.91 | $3,302.81 |
| Colorado | $13,091.84 | $16,640.28 | $3,548.44 |
| New Jersey | $21,615.95 | $25,223.24 | $3,607.29 |
| Vermont | $25,521.52 | $29,263.39 | $3,741.87 |
| Michigan | $15,191.86 | $18,942.52 | $3,750.66 |
| Delaware | $17,024.60 | $20,963.92 | $3,939.31 |
| California | $12,393.39 | $16,524.89 | $4,131.51 |
| Oregon | $15,039.12 | $19,473.68 | $4,434.56 |
| Washington | $13,340.11 | $17,810.41 | $4,470.29 |
| Connecticut | $19,961.72 | $24,519.93 | $4,558.21 |
| Pennsylvania | $18,454.88 | $23,040.92 | $4,586.05 |
| District of Columbia | $22,927.96 | $27,914.04 | $4,986.08 |
| New York | $22,683.46 | $28,223.59 | $5,540.14 |
| Illinois | $16,057.97 | $21,641.30 | $5,583.34 |
Table A7. Union membership, voter share, and revenues are strongly correlated with overall union strength.
| Area | Internal Measure | Correlation |
| A | Percentage of state voters who are union members | 0.81*** |
| Percent of state voters who are union members and in educational services | 0.70*** | |
| Number of teacher strikes (2019–24) | 0.17 | |
| Percentage of districts engaged in strikes (2019–24) | 0.03 | |
| Percentage of teachers who are members of the union | 0.82*** | |
| State union density (2024) | 0.81*** | |
| Total 2023 revenue per teacher of state NEA/AFT affiliate, adjusted using the NCES CWI | 0.81*** | |
| B | Number of teacher union–sponsored political ads | 0.36** |
| Percentage of political ads sponsored by the teacher union | 0.27 | |
| Amount of political ad spending | 0.37** | |
| Percentage of political ad spending | 0.30* | |
| Percentage of teacher union–endorsed candidates who won their elections (2024) | 0.31* | |
| Number of teacher union candidate endorsements (2024) | 0.38** | |
| Teacher union contributions ratio | 0.34* | |
| Percentage of all contributions to state-level candidates from teacher unions | 0.29* | |
| Percentage of all contributions to state-level parties from teacher unions | 0.49*** | |
| C | Presence of policies prohibiting automatic payroll deductions | 0.35* |
| Legality of collective bargaining | 0.57*** | |
| Legality of teacher strikes | 0.46*** | |
| Charter school collective bargaining policy | 0.48*** | |
| Collective bargaining legality scale (16 topics) | 0.49*** | |
| D | Performance pay policy | 0.24 |
| Class size restriction policy | -0.12 | |
| Policy on dismissals for ineffectiveness | 0.10 | |
| Student growth in evaluation | -0.01 | |
| Tenure policy | 0.40** | |
| Charter policy | 0.15 | |
| Charter caps | 0.24 | |
| Variety of charters | -0.01 | |
| Charter authorizers | 0.30* | |
| Charter school exemption policy | 0.22 | |
| Charter certificate policy | 0.41** | |
| Education savings account policy | 0.43** | |
| Tax credit policy | 0.36** | |
| Voucher policy | 0.27 | |
| Annual percentage of the total K–12 budget spent on teacher salaries and benefits | 0.30* | |
| Total annual per-pupil expenditures per state, adjusted using the NCES CWI | 0.62*** | |
| Annual percentage of each state’s general budget spent on K–12 education | -0.07 | |
| Employer contribution rate as a percentage of payroll | 0.47** | |
| Percentage of charters with collective bargaining (2018–19) | 0.37* | |
| Percentage of K–12 population not using private education choice programs | 0.26 | |
| Percentage of K–12 population using traditional public schools | 0.10 | |
| Teacher salary in SY 2023–24 | 0.70*** | |
| E | Perceptions of Area A | 0.63*** |
| Perceptions of Area B | 0.47*** | |
| Perceptions of Area D | 0.73*** | |
| General perceptions | 0.66*** |
Table A8. Area A: Resources and Membership is most correlated to overall union strength, whereas Area D: Policy Wins and Losses is least correlated.
| Overall Teacher Union Strength | Area A: Resources and Membership | Area B: Involvement in Politics | Area C: Labor and Bargaining Policies | Area D: Policy Wins and Losses | Area E: Perceived Influence | |
| Overall Teacher Union Strength | - | |||||
| Area A: Resources and Membership | 0.886* | - | ||||
| Area B: Involvement in Politics | 0.783* | 0.653* | - | |||
| Area C: Labor and Bargaining Policies | 0.787* | 0.643* | 0.505* | - | ||
| Area D: Policy Wins and Losses | 0.641* | 0.468* | 0.445* | 0.269 | - | |
| Area E: Perceived Influence | 0.766* | 0.643* | 0.589* | 0.392* | 0.442* | - |
Table A9. Teacher union strength is strongly correlated with Democratic control and the presence of a minimum wage.
| External Measure | Correlation |
| Demographics | |
| Population | 0.09 |
| Population change | -0.43** |
| Percentage race White | -0.03 |
| Percentage race Black | -0.37** |
| Percentage race American Indian | 0.01 |
| Percentage race Asian or Pacific Islander | 0.38** |
| Percentage ethnicity Hispanic | 0.07 |
| Percentage multiracial or other race | 0.21 |
| Percentage foreign-born | 0.37** |
| Percentage population younger than 5 | -0.48*** |
| Percentage population ages 5–17 | -0.36* |
| Percentage population ages 18–29 | -0.16 |
| Percentage population ages 30–49 | 0.04 |
| Percentage population age 50+ | 0.27 |
| Economics | |
| Percentage below poverty line | -0.39** |
| Median household income (2022$) | 0.24 |
| Percentage population with bachelor’s degree | 0.43** |
| Unemployment rate | 0.15 |
| State gross domestic product | 0.19 |
| Politics | |
| Mass public economic conservatism | -0.35* |
| Popular vote share of Democratic presidential candidate | 0.52*** |
| Republican trifecta | -0.61*** |
| Democratic trifecta | 0.62*** |
| Minimum wage | 0.62*** |
| Observations | 51 |
Notes: * p<0.05, ** p<0.01, *** p<0.001; estimates reflect correlations with the overall state teacher union strength score. External data sources: the American Community Survey, the Bureau of Labor Statistics, the Bureau of Economic Analysis, the U.S. Department of Labor, Caughey and Warshaw (2018), and Ballotpedia. Where 2025 data are unavailable, we use linear interpolation from prior years.
Appendix B. Comparison of Sub-Indicators from the 2012 Report to the Current Report: Methodological Consistencies and Changes
We use a total of 59 sub-indicators to determine our ranking of union strength. Thirty are comparable with those used in the 2012 survey, with 20 unchanged and ten adjusted. Twenty-nine supplementary sub-indicators are new to this report, and six sub-indicators from the prior report are not included this time.
For the 20 unchanged legacy measures, the data were either from the same source or from a source that reports data in the same way as the sources from 2012. For example, for revenue, we used a different source to locate the 990 forms but used the same underlying data source to calculate the same measure.
Below are the 20 measures that did not change between reports:
- Membership: percentage of teachers who are members of the union
- Revenue: total per-teacher yearly revenue of the state National Education Association affiliate and/or the state American Federation of Teachers affiliate, adjusted using the NCES Comparable Wage Index
- Financial contributions to campaigns and political parties: percentage of all contributions to state-level candidates originating from teacher unions
- Financial contributions to campaigns and political parties: percentage of all contributions to state-level political parties originating from teacher unions
- Financial contributions to campaigns and political parties: total teacher union contributions to state-level candidates divided by the total contributions to state-level candidates by the other top ten specific businesses
- Legal scope of bargaining: legality of collective bargaining
- Legal scope of bargaining: breadth of the scope of bargaining
- Right to strike: legality of teacher strikes
- Exemptions from collective bargaining: presence of state-level policies allowing or prohibiting automatic collective bargaining exemptions for charter schools
- Performance pay: presence of state-level policies requiring the use of teacher performance in determining compensation
- Evaluations: presence of state-level policies allowing for dismissal based on ineffectiveness
- Evaluations: presence of state-level policies that require use of student growth measures in teacher evaluations
- Class size: presence of state-level policies restricting K–12 class sizes
- Charter school structural limitations: presence of state-level policies limiting the number of charters granted (caps)
- Charter school structural limitations: presence of state-level policies limiting the types of charter schools allowed
- Charter school structural limitations: presence of state-level policies allowing multiple authorizers for charter schools
- Charter school policy exemptions: presence of automatic exemptions from many state or local laws and regulations
- Relative spending on education at the state level: annual percentage of the total K–12 budget spent on teacher salaries and benefits
- Relative spending on education at the state level: total annual per-pupil expenditures, adjusted using the NCES Comparable Wage Index
- Relative spending on education at the state level: annual percentage of state’s general budget spent on K–12 education
Ten adjusted measures are similar to 2012 sub-indicators, but because of the time between data collections, there were more substantive changes in how the data were reported. For these, the concept is captured in a similar way, but the data may be more or less comparable, depending on the measure. Where updated data were unavailable, we used the most similar updated source. All survey items that reflected the 2012 survey are considered adjusted measures, as samples, question order, and wording changed between administrations.
Table B1. Eleven sub-indicators from 2012 were adjusted because of changes in data availability and political context, with two of those measures combined, resulting in ten adjusted sub-indicators.
| 2012 Sub-indicators | 2025 Adjusted Sub-indicators | |
| 1 | Automatic revenue streams: an analysis of unions’ legal right to automatically collect agency fees from non-members and/or collect member dues via automatic payroll deductions | C1-1. Automatic revenue policies, as measured by the presence of state-level policies allowing or prohibiting automatic payroll deductions |
| 2 | Retirement, as a ratio of employer-to-employee contributions, using National Council on Teacher Quality (NCTQ) data | D5-1. Retirement, measured as the employer contribution rate to teacher retirement plans as a percentage of the payroll, using Equable data |
| 3 | Tenure, which included analysis of policies such as the length of time until a teacher is eligible for tenure and the criteria for earning tenure, using NCTQ data | D4-2. Tenure, measured as the presence of state-level policies providing tenure protections for K–12 teachers, using National Education Association data |
| 4 | Perceived influence of teacher unions: How do you rank the influence of teacher unions on education policy compared with other influential entities? | E4-2. Perceived influence of teacher unions, relative to other policy influencers, on a scale of 0–100 |
| 5 | Perceived necessity of teacher union support to be elected to state-level office: • How often do Democratic candidates need teacher union support to get elected? • How often do Republican candidates need teacher union support to get elected? |
E2-1. Perceived necessity of teacher union support to be elected or appointed to state-level office, average across four positions: • Democrats running for state-level office • Republicans running for state-level office • State board of education members • Chief state school officer/state superintendent of schools |
| 6 | Perceived need for teacher unions to compromise: Would you say that teacher unions typically compromise with policymakers to ensure that their preferred policies are enacted, or do they typically need not make concessions? | E2-2. Perceived need for teacher unions to compromise as a condition of influence |
| 7 | To what extent do you agree that teacher unions ward off proposals in your state with which they disagree? | E3-1. Level of agreement with “Teacher unions are effective in defeating education reform proposals with which they disagree.” |
| 8 | How often do existing state education policies reflect teacher union priorities? | E3-2. Level of agreement with “State-level education policies reflect teacher unions/association priorities.” |
| 9 | To what extent do you agree that, even in times of cutbacks, teacher unions are effective in protecting dollars for education? | E3-3. Level of agreement with “Teacher unions have been effective in keeping education spending steady by preventing or minimizing cuts in the education budget.” |
| 10 | Perceived influence on state-level education policies: • To what extent were legislative outcomes of your state’s latest legislative session in line with teacher union priorities? |
E3-4. Perceived influence on state-level education policies, average of measures of relative influence across six policy areas |
Twenty-nine supplemental measures are new to the report.
- Percentage of all employees who are members of any union. This sub-indicator was added as an indicator of the state context. States with more union members across fields are more likely to have multiple labor organizations that can coordinate and more likely to have a culture that values unions as political and social entities.
- Number of teacher strikes. This sub-indicator shows how frequently teachers mobilize via one of the most visible forms of union political power.
- Percentage of districts engaged in strikes. This sub-indicator differentiates between a state where teachers across many districts are engaging in strikes and states where only a small number of districts engage in multiple strikes. It therefore helps reflect the breadth of influence throughout the state.
- Percentage of state voters who are union members. This sub-indicator was added because one way that labor unions mobilize their members is by encouraging them to vote and to vote for particular candidates or ballot measures. This reflects the notion that members of any labor union may support broadly union-friendly candidates and policies in solidarity with teacher unions.
- Percentage of state voters who are both union members and employed in the educational service industry. This sub-indicator approximates the voting power of teacher union members, as there are not consistent data on the number of teacher union members who vote.
- Number of candidates endorsed by state teacher unions. This sub-indicator provides evidence of one political activity that state-level teacher unions can engage in to influence election outcomes.
- Percentage of state teacher union-endorsed candidates who won elections. Higher percentages of successful endorsements may reflect unions that better mobilize their members or whose endorsements carry more influence.
- Number of political ads for state and local races sponsored by teacher unions. This sub-indicator measures a visible way teacher unions can attempt to influence election outcomes.
- Percentage of political ads for state and local races sponsored by teacher unions. This sub-indicator considers, relative to other political ad purchasers, the number of political advertisements teacher unions sponsored.
- Amount of money spent on political ads. This sub-indicator measures the financial resources dedicated to political advertising as a means of influencing elections.
- Percentage of political ad spending. This sub-indicator considers ad spending relative to other organizations sponsoring political advertisements.
- Presence of state-level policies allowing the establishment of charter schools. This sub-indicator accounts for the states that do not allow charter schools at all compared with states that have a high level of charter school structural limitations. Unions tend to oppose the establishment of charter schools.
- Presence of state-level policies requiring teacher certification for charter schools. This sub-indicator was added because of the changing political context of charter schools, with unions tending to oppose exemptions to teacher certification policies.
- Percentage of charter schools with collective bargaining. This sub-indicator accounts for differential levels of charter school unionization by state. Charter schools with varying legal exemptions from policies such as collective bargaining can be thought of as operating outside of teacher union influence, but this measure accounts for the states in which teacher unions may have influence within charter schools.
- Presence of state-level policies allowing education savings accounts. This sub-indicator was added because school choice and voucher policies have become more widespread. Education savings accounts were first introduced in Arizona in 2011, only shortly before the publication of the previous teacher union rankings report. Teacher unions have opposed school choice policies that could result in moving funding away from traditional public schools.
- Presence of state-level policies allowing tax-credit scholarships. This sub-indicator was added because school choice and voucher policies have become more widespread. The first tax-credit scholarship program was created in 1998 by Arizona, with programs becoming more common in the past 20 years.
- Presence of state-level policies allowing vouchers. This sub-indicator was added because voucher policies have become more widespread. Vouchers are now an issue highlighted by both the National Education Association and the American Federation of Teachers in their national agendas.
- Percentage of K–12 student population not using private education choice programs. This sub-indicator captures the level of participation in private school choice policies: education savings accounts, tax-credit scholarships, and vouchers.
- Percentage of K–12 student population using traditional public schools and not alternatives such as private schools, homeschooling, charter schools, and magnet schools. This sub-indicator captures the use of traditional public schools by the state population, with these schools being the model most supported by teacher unions.
- Average salary of public-school teachers. This sub-indicator was included because one policy area that teacher unions often have direct negotiating power over, via collective bargaining, is teacher salaries.
- Overall perceptions: identified the teacher union as either the most influential entity or individual or one of the most influential entities or individuals in K–12 education policymaking for the state. This sub-indicator was an open-ended survey item that allowed respondents to identify any policy actors they felt were influential in state education policymaking. Although similar to the perceived influence of teacher unions from the adjusted measures, this item was asked early in the survey without providing a list of possible actors, to minimize priming effects and to allow respondents to include actors that might be state-specific or not included in a survey list.
- Overall perceptions: level of agreement with “Teacher unions/associations in [STATE] are stronger today than they were five years ago.” This sub-indicator was added to gauge overall perceptions of state teacher union power relative to a previous time. If unions are perceived as declining, that may contribute to a broader perception that they are not useful allies and that political actors do not need to pay attention to them, and vice versa if they are seen as strengthening.
- Perceptions of available resources and membership: level of agreement with “Teacher unions/associations in [STATE] can mobilize members to engage in actions aligned with union/association priorities.” This sub-indicator was added to gauge how effectively teacher unions can mobilize members. If a union has a high level of membership but is unable to mobilize members, it most likely has less political power than a union that can mobilize its members.
- Perceptions of available resources and membership: perceived ability of teacher unions to engage members in eight mobilization activities. This sub-indicator was added to capture multiple ways unions can mobilize members to influence policy.
- Perceptions of available resources and membership: perceived likelihood of following through on a threat to strike. This sub-indicator was added because a strike threat holds more political power when it is perceived to be a legitimate threat.
- Perceptions of available resources and membership: perceived ability to leverage a strike to influence policy. This sub-indicator was included because a strike is more effective as a political tool if policymakers are likely to make some policy change to bring about an end to the strike.
- Perceptions of available resources and membership: perceived availability of local teacher unions’ power. This sub-indicator captures how state-level teacher union organizations can mobilize or coordinate local unions for collective, statewide action. Because unions are federated organizations, it is important to understand how local unions—the organizations that teachers pay dues to—use their power to affect state policy.
- Perceptions of involvement in politics: perceived influence over policy implementation. This sub-indicator was included because the union can also be involved in conversations and negotiations that set rules and procedures for implementing policies. These actions can affect how a policy is enacted in practice.
- Perceptions of involvement in politics: perceived influence via working relationships with legislators. This sub-indicator captures how teacher unions can build relationships with policymakers that may result in more favorable policies.
Six measures no longer included are not incorporated into the updated rankings, most commonly because of issues with data availability.
- Percentage of state’s delegates to the Democratic and Republican national conventions who were members of teacher unions. The data source for the 2012 survey was the 2000 Convention Delegate Survey. This survey is no longer in the field, and there are no updated data or comparable alternative data available.
- Terms of employment: how seniority and teacher performance are considered in teacher layoff decisions. We could not find comparable updated data from the original source (NCTQ) or from any alternative sources.
- Terms of employment: percentage of the teaching workforce dismissed because of poor performance. The 2012 report used the 2007–08 Schools and Staffing Survey (SASS) data, which included a measure of the average percentage of teachers dismissed in public school districts. We could not find an update more recent than the 2011–12 SASS. Newer versions of this survey, now the National Teacher and Principal Survey (NTPS), do not ask comparable questions or collect comparable data that are freely and publicly available. No comparable alternative sources were identified.
- Would you say that teacher unions generally make concessions to prevent reductions in pay and benefits or that they fight hard to prevent those reductions? This question was asked within the context of budget challenges in the period immediately after the Great Recession.
- To what extent were state education policies proposed by the governor during your state’s latest legislative session in line with teacher union priorities? This question was not included in the 2025 survey in the interest of space and time constraints. The measure of alignment with union priorities remains.
- How often have the priorities of state education leaders aligned with teacher union positions in the past three years? This question was not included in the 2025 survey in the interest of space and time constraints. The measure of alignment with union priorities remains.
Endnotes
[1] We use the term “teacher unions” to refer to both teacher unions and teacher associations, inclusive of teacher organizations that do not collectively bargain where bargaining is not established or prohibited.
[2] Bleiberg, Joshua, and Erica Harbatkin. 2020. “Teacher Evaluation Reform: A Convergence of Federal and Local Forces.” Educational Policy 34 (6): 918–52. https://doi.org/10.1177/0895904818802105. Brunner, Eric, Joshua Hyman, and Andrew Ju. 2019. “School Finance Reforms, Teachers’ Unions, and the Allocation of School Resources.” The Review of Economics and Statistics, 1–47. https://doi.org/10.1162/rest_a_00828. Cowen, Joshua M., and Katharine O. Strunk. 2015. “The Impact of Teachers’ Unions on Educational Outcomes: What We Know and What We Need to Learn.” Economics of Education Review 48 (October): 208–23. https://doi.org/10.1016/j.econedurev.2015.02.006. Finger, Leslie K. 2018. “Vested Interests and the Diffusion of Education Reform across the States.” Policy Studies Journal 46 (2): 378–401. https://doi.org/10.1111/psj.12238. Lyon, Melissa Arnold. 2023. “The Effect of Right to Work Laws on Union Membership and School Resources: Evidence from 1942–2017.” Educational Researcher 52 (6): 339–47. https://doi.org/10.3102/0013189X231167144. Nguyen, Tuan D., J. Cameron Anglum, and Michael Crouch. 2023. “The Effects of School Finance Reforms on Teacher Salary and Turnover: Evidence from National Data.” AERA Open 9 (January): 23328584231174447. https://doi.org/10.1177/23328584231174447. Swain, Walker A., and Christopher Redding. 2022. “Teachers’ Union Power in a Budget Crunch: Lasting Ramifications of Differential Spending Responses to the Great Recession.” Educational Policy 36 (2): 343–76. https://doi.org/10.1177/0895904819881161.
[3] Flavin, Patrick, and Michael T. Hartney. 2015. “When Government Subsidizes Its Own: Collective Bargaining Laws as Agents of Political Mobilization.” American Journal of Political Science 59 (4): 896–911. JSTOR. Frandsen, Brigham R. 2016. “The Effects of Collective Bargaining Rights on Public Employee Compensation: Evidence from Teachers, Firefighters, and Police.” ILR Review 69 (1): 84–112. Hartney, Michael T. 2022. How Policies Make Interest Groups: Governments, Unions, and American Education. University of Chicago Press. Paglayan, Agustina S. 2019. “Public-Sector Unions and the Size of Government.” American Journal of Political Science 63 (1): 21–36. https://doi.org/10.1111/ajps.12388.
[4] Eren, Ozkan, Serkan Ozbeklik, and Ron Haskins. Winter 2016. “What Do Right-to-Work Laws Do? Evidence from a Synthetic Control Method Analysis.” Journal of Policy Analysis & Management 35 (1): 173–94. https://doi.org/10.1002/pam.21861. Finger, Leslie K., and Michael T. Hartney. 2019. “Financial Solidarity: The Future of Unions in the Post-Janus Era.” Perspectives on Politics, 1–17. https://doi.org/10.1017/S1537592719003438. Frymer, Paul, Jacob M. Grumbach, and Charlotte Hill. 2025. “Right to Work or Right to Vote? Labor Policy and American Democracy.” Perspectives on Politics, January 14, 1–20. https://doi.org/10.1017/S1537592724001427. Lyon, Melissa Arnold. 2021. “Heroes, Villains, or Something in between? How ‘Right to Work’ Policies Affect Teachers, Students, and Education Policymaking.” Economics of Education Review 82 (June): 102105. https://doi.org/10.1016/j.econedurev.2021.102105. Lyon, Melissa Arnold. 2023. “The Effect of Right to Work Laws on Union Membership and School Resources: Evidence from 1942–2017.” Educational Researcher 52 (6): 339–47. https://doi.org/10.3102/0013189X231167144.
[5] Baron, E. Jason. 2018. “The Effect of Teachers’ Unions on Student Achievement in the Short Run: Evidence from Wisconsin’s Act 10.” Economics of Education Review 67 (December): 40–57. https://doi.org/10.1016/j.econedurev.2018.09.003. Brunner, Eric, Joshua Hyman, and Andrew Ju. 2019. “School Finance Reforms, Teachers’ Unions, and the Allocation of School Resources.” The Review of Economics and Statistics, 1–47. https://doi.org/10.1162/rest_a_00828. Cowen, Joshua M., and Katharine O. Strunk. 2015. “The Impact of Teachers’ Unions on Educational Outcomes: What We Know and What We Need to Learn.” Economics of Education Review 48 (October): 208–23. https://doi.org/10.1016/j.econedurev.2015.02.006. Han, Eunice S., and Thomas N. Maloney. 2019. “Teacher Unionization and Student Academic Performance: Looking beyond Collective Bargaining.” Labor Studies Journal, ahead of print. https://doi.org/10.1177/0160449X19883373. Hart, Cassandra M. D., and Aaron J. Sojourner. 2015. “Unionization and Productivity: Evidence from Charter Schools.” Industrial Relations: A Journal of Economy and Society 54 (3): 422–48. https://doi.org/10.1111/irel.12097. Lyon, Melissa Arnold. 2021. “Heroes, Villains, or Something in between? How ‘Right to Work’ Policies Affect Teachers, Students, and Education Policymaking.” Economics of Education Review 82 (June): 102105. https://doi.org/10.1016/j.econedurev.2021.102105. Marianno, Bradley D., and Katharine O. Strunk. 2018. “The Bad End of the Bargain?: Revisiting the Relationship between Collective Bargaining Agreements and Student Achievement.” Economics of Education Review 65 (August): 93–106. https://doi.org/10.1016/j.econedurev.2018.04.006. Matsudaira, Jordan D., and Richard W. Patterson. 2017. “Teachers’ Unions and School Performance: Evidence from California Charter Schools.” Economics of Education Review 61 (December): 35–50. https://doi.org/10.1016/j.econedurev.2017.09.005. Swain, Walker A., and Christopher Redding. 2022. “Teachers’ Union Power in a Budget Crunch: Lasting Ramifications of Differential Spending Responses to the Great Recession.” Educational Policy 36 (2): 343–76. https://doi.org/10.1177/0895904819881161.
[6] Hertel-Fernandez, Alexander, Suresh Naidu, and Adam Reich. 2021. “Schooled by Strikes? The Effects of Large-Scale Labor Unrest on Mass Attitudes toward the Labor Movement.” Perspectives on Politics 19 (1): 73–91. https://doi.org/10.1017/S1537592720001279. Lyon, Melissa Arnold. 2023. “Current Perspectives on Teacher Unionization, and What They’re Missing.” Educational Policy 37 (5): 1420–43. https://doi.org/10.1177/08959048221103798. Lyon, Melissa Arnold, Annie A. Hemphill, and Rebecca Jacobsen. 2024. “How Do Unions Create Candidates?” Political Behavior 46 (1): 209–31. https://doi.org/10.1007/s11109-022-09818-x. Lyon, Melissa Arnold, and Matthew A. Kraft. 2024. “Teacher Strikes as Public Signals.” Journal of Human Resources, April 8, 0722-12437R2. https://doi.org/10.3368/jhr.0722-12437R2.
[7] Finger and Hartney find that the NEA national union organization transfers funds to state-level unions that are reflected in state-level union revenues. Thus, it is possible that higher revenues could reflect higher levels of financial support from the national organization rather than the state-level organization’s ability to independently generate revenues via dues or other contributions.
Finger, Leslie K., and Michael T. Hartney. “Financial Solidarity: The Future of Unions in the Post-Janus Era.” Perspectives on Politics 19, no. 1 (2021): 19–35. https://doi.org/10.1017/S1537592719003438.
[8] The survey included many questions from the 2012 report, as well as some new questions.
[9] We initially reached out to potential respondents via email. For states where additional email outreach failed to reach the minimum threshold of three responses, we conducted follow-up phone calls followed immediately by a final email invitation.
[10] Because Area E: Perceptions of Influence relies on survey responses rather than administrative data, it required an additional intermediate step. We first averaged the relevant survey items for each of the four indicators (E1–4) at the individual respondent level. We then aggregated these individual-level indicator scores to produce state-level indicator averages.
[11] McCoy Family Center for Ethics in Society. “Landmark U.S. Cases Related to Equality of Opportunity in K–12 Education.” Part of the Equality of Opportunity and Education project, Stanford University. https://edeq.stanford.edu/sections/section-4-lawsuits/landmark-us-cases-related-equality-opportunity-k-12-education.
[12] Taylor, Diana J. “Committed to Excellence: The Story of the Prichard Committee.” KET, The Kentucky Network, June 29, 2003. https://ket.org/program/committed-to-excellence-the-story-of-the-prichard-committee/.
[13] Lovan, Dylan. “Kentucky Supreme Court Rules That Charter Schools Law Is Unconstitutional.” The Associated Press, February 19, 2026. https://apnews.com/article/charter-schools-kentucky-supreme-court-dca91480d26e4546bfc055acd063ea5a.
[14] All demographic characteristics come from the American Community Survey (ACS) estimates. Economic data come from the ACS, the Bureau of Labor Statistics, the Bureau of Economic Analysis, and the U.S. Department of Labor. Political characteristics come from Caughey and Warshaw (2018) and Ballotpedia. When 2025 data are not available, we use state-year linear interpolations for all external factors to estimate 2025 values.
[15] Narechania, Kunjan. “What’s behind the Southern Surge?” Flypaper, Thomas B. Fordham Institute, May 30, 2025. https://fordhaminstitute.org/national/commentary/whats-behind-southern-surge.
About this Study
This report was made possible through funding from the Sarah Scaife Foundation, The Achelis and Bodman Foundation, and The Anschutz Foundation. The views expressed in this report are those of the authors alone and do not necessarily reflect those of the foundations that supported this work.
We are deeply grateful to authors Melissa Arnold Lyon (University at Albany), Sandy Frost Waldron (independent researcher), and Rebecca Jacobsen (Michigan State University) for their diligence and collaboration, and to external advisers Michael Hartney (Boston College) and Jeffrey Henig (Columbia University), who provided thoughtful and substantive feedback on the draft report. Here at Fordham, we thank our former colleague Adam Tyner, who launched the project; Meredith Coffey and David Griffith for managing the project and editing the report; Chester E. Finn, Jr., Michael J. Petrilli, and Amber M. Northern for providing feedback on the draft; Brian Fitzpatrick for providing feedback and creating the interactive table; Jill Hoppe, Ali Schalop, and Robert Chung for assisting with research; Stephanie Distler for managing report production and design; and Victoria McDougald for overseeing media dissemination. We also extend our gratitude to David Yontz for copyediting and to Dave Williams for creating the report’s figures.
Finally, thanks to AI for the cover illustration. If something looks slightly off, you're not imagining it.