Mobile Navigation

  • National
    • Policy
      • High Expectations
      • Quality Choices
      • Personalized Pathways
    • Research
    • Commentary
      • Gadfly Newsletter
      • Flypaper Blog
    • Events
    • Scholars Program
  • Ohio
    • Policy
      • Priorities
      • Media & Testimony
    • Research
    • Commentary
      • Ohio Education Gadfly Biweekly
      • Ohio Gadfly Daily
  • Charter Authorizing
    • Application
    • Sponsored Schools
    • Resources
  • About
    • Mission
    • Board
    • Staff
    • Career
Home
Home
Advancing Educational Excellence

Main Navigation

  • National
  • Ohio
  • Charter Authorizing
  • About

National Menu

  • Topics
    • Accountability & Testing
    • Advanced Education
    • Career & Technical Education
    • Charter Schools
    • Curriculum & Instruction
    • ESSA
    • Evidence-Based Learning
    • Facilities
    • Governance
    • Personalized Learning
    • Private School Choice
    • School Finance
    • Standards
    • Teachers & School Leaders
    • Think Again
  • Research
  • Commentary
    • Gadfly Newsletter
    • Flypaper Blog
    • Gadfly Podcast
  • Events
  • Scholars Program

The Education Gadfly Weekly

Sign Up to Receive Fordham Updates

We'll send you quality research, commentary, analysis, and news on the education issues you care about.
Thank you for signing up!
Please check your email to confirm the subscription.

The Education Gadfly Weekly: End-of-course exams benefit students—and states

Volume 19, Number 34
8.28.2019
8.28.2019

The Education Gadfly Weekly: End-of-course exams benefit students—and states

Volume 19, Number 34
view
High Expectations

End-of-course exams benefit students—and states

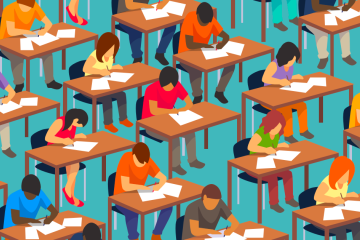
Very little previous research has looked at end-of-course exams. Our new study on their relationship to student outcomes helps remedy that. We learned much that’s worth knowing and sharing. Probably most important: EOCs, properly deployed, have positive academic benefits and do so without causing kids to drop out or graduation rates to falter.

Chester E. Finn, Jr., Amber M. Northern, Ph.D. 8.28.2019
NationalFlypaper

End-of-course exams benefit students—and states

Chester E. Finn, Jr. | Amber M. Northern, Ph.D.
8.28.2019
Flypaper

The “left behind” kids made incredible progress from the late 1990s until the Great Recession. Here are key lessons for ed reform.

Michael J. Petrilli
8.28.2019
Flypaper

The proficiency bar is inching upward, yes, but…

Chester E. Finn, Jr.
8.28.2019
Flypaper

Influences affecting the educational trajectory of students

Jeff Murray
8.28.2019
Flypaper

Can educational data mining predict student performance and enhance personalized learning?

Olivia Piontek
8.28.2019
Flypaper

The Education Gadfly Show: Boosting student outcomes with end-of-course exams

8.28.2019
Podcast
view

The “left behind” kids made incredible progress from the late 1990s until the Great Recession. Here are key lessons for ed reform.

Michael J. Petrilli 8.28.2019
Flypaper
view

The proficiency bar is inching upward, yes, but…

Chester E. Finn, Jr. 8.28.2019
Flypaper
view

Influences affecting the educational trajectory of students

Jeff Murray 8.28.2019
Flypaper
view

Can educational data mining predict student performance and enhance personalized learning?

Olivia Piontek 8.28.2019
Flypaper
view

The Education Gadfly Show: Boosting student outcomes with end-of-course exams

Michael J. Petrilli, David Griffith, Ph.D., Adam Tyner, Ph.D., Amber M. Northern, Ph.D. 8.28.2019
Podcast
view

End-of-course exams benefit students—and states

Chester E. Finn, Jr. | Amber M. Northern, Ph.D.
8.28.2019
Flypaper

Education reformers in the United States have stumbled when it comes to high schools and the achievement evidence shows it. National Assessment results in grade twelve have been flat for a very long time. ACT and SAT scores are flat. U.S. results on PISA and TIMSS are essentially flat. College remediation rates—and dropout rates—remain high. Advanced Placement (AP) participation is up, but success on AP exams is not—and for minority students it’s down. And while high school graduation rates are up—and it’s indisputably a good thing for young people to acquire that credential—it’s not so good when there’s reason to believe it does not signify levels of learning that augur success in post-high-school pursuits.

We at the Fordham Institute have a longstanding interest in strengthening student achievement and school performance, and it’s no secret that we’re accountability hawks: We believe strongly that results—and growth in results—are what matter in education, and we’ve been concerned for some time about ways in which the appearance or assertion of improvement may conceal something far more disappointing. In that connection, previous Fordham studies have unmasked what we termed the “proficiency illusion,” the “accountability illusion,” the rise of often-questionable “credit recovery,” and the discrepancy between teacher-conferred grades and student performance on statewide assessments.

On the upside, we’ve also documented respectable—and authentic—achievement gains in the early grades, particularly among disadvantaged and low-achieving youngsters and children of color. But high schools, as we’ve noted on multiple occasions, remain a huge challenge.

Nor have federal efforts to strengthen academic performance via school accountability ever gotten much traction at the high school level, where—under No Child Left Behind and now the Every Student Succeeds Act—there’s been more emphasis on graduation rates than on student achievement. To their credit, most states, at one point or another, have supplemented those efforts by instituting their own exam-based requirements for students before awarding diplomas. These have taken the form of multisubject graduation tests—the best known probably being the Massachusetts MCAS exam—as well as subject-specific end-of-course exams (EOCs).

Both were extensively used until just a few years ago. At their high-water mark, graduation tests were required by thirty states and EOCs were employed by thirty jurisdictions (there’s double counting there, as the two types of tests overlap somewhat). Both, however, are now in decline. For the class of 2020, students in just twelve states will have taken a graduation test, and in twenty-six states, students will have taken one or more EOCs.

Three factors seem to have driven that decline: the overriding push for higher graduation rates, which militates against anything that might get in the way; the nationwide backlash against testing in general; and a handful of studies indicating that requiring students to pass a graduation test may discourage them and lead to more dropouts, which is obviously bad for them and would also depress the graduation rate without much evidence of a positive impact on student achievement.

Yet very little prior research has looked at EOCs in particular. Our new report, End-of-Course Exams and Student Outcomes, helps remedy that. We wondered: How, exactly, do states employ EOCs? And what difference, if any, do they make for student achievement and graduation rates? If they cause more harm than good, states may be right to downplay or discard them. If, on the other hand—and unlike graduation exams—they do good things for kids or schools, it’s possible that states, in turning away from EOCs, are throwing a healthy baby out with the testing bathwater.

We entrusted this inquiry to Fordham’s own Adam Tyner and Lafayette College economist Matthew Larsen, and they’ve done a first-rate job, the more so considering how challenging it is to corral EOCs separately from other forms of testing, how tricky it is to determine exactly what a test is being “used for,” and how many different tests and states are involved and over such a long period of time. It’s also a big problem that the nation lacks a reliable gauge of state-by-state achievement at the twelfth-grade level—a challenge that the National Assessment Governing Board recently promised to address, but not until 2027!

Tyner and Larsen learned much that’s worth knowing and sharing because the implications for state (and district and school) policy and practice are potentially quite valuable. Probably most important, EOCs, properly deployed, have positive (albeit modest) academic benefits and do so without causing kids to drop out or graduation rates to falter. “In other words,” write the authors, “the key argument against exit exams—that they depress graduation rates—does not hold for EOCs.” Instead, these exams “are generally positively correlated with high school graduation rates.” Better still, “The more EOCs a state administers, the better is student performance on college-entrance exams, suggesting that the positive effects of EOCs may be cumulative.”

Nor are those the only potential benefits associated with strategic deployment of EOCs. External exams are a good way for states to maintain uniform content and rigor in core high school courses and keep a check on the local impulse (often driven as much by parents as by teachers or administrators) to inflate student grades. At the same time, EOCs can motivate students to take those courses more seriously and tend to place teachers and their pupils on the “same team”—for when the exam is external, the teacher becomes more coach than judge.

Such exams also lend themselves to an individualized, “mastery”-based education system in which students proceed through their coursework at their own speed, often with the help of technology as well as teachers. (To optimize this benefit, “end-of-unit” exams would be even more beneficial than the kind given only at the end of a semester or a year.)

We’re surely not suggesting that states go crazy with EOCs—there’s little danger of that happening in today’s climate anyway—but we do suggest that policymakers take seriously both the good that these exams can do and the potential harm from scrapping or softening them. And softening seems to be underway in more and more places, as states create detours around EOCs for kids who have trouble passing them, delay the year when they must actually be passed, or turn them into part of a student’s course grade rather than actually requiring that kids pass them.

As we said, we’re accountability hawks and thus generally opposed to softening. Yet as Tyner and Larsen note, EOCs have the virtue of flexibility. States can deploy them in various ways: some firmer, some softer, and some simply as a source of valuable information for teachers, parents, school leaders, and policymakers. At a time when states are back in the driver’s seat on school and student accountability, that’s mostly a good thing. But at a time when high school performance is flat, flat, flat, it seems to us that wise educators and policymakers alike should use every tool in their toolbox to build the scaffolding for major improvement. EOCs are such a tool.

view

The “left behind” kids made incredible progress from the late 1990s until the Great Recession. Here are key lessons for ed reform.

Michael J. Petrilli
8.28.2019
Flypaper

Editor’s note: This is the final post in a series looking at whether and how the nation’s schools have improved over the past quarter-century or so (see the others here, here, here, here, here, here, and here).

This summer, I’ve been trying to make sense of the sizable gains made by America’s lowest-performing students and kids of color that coincided with the peak of the modern education reform movement. Today, I wrap up the series by offering some personal reflections on what we’ve learned. But first, let’s recap the facts and acknowledge the vast amount of ground yet to cover.

—

From the mid to late 1990s, and generally until 2010 or so, National Assessment of Educational Progress (NAEP) scores at the fourth and eighth grades for the lowest-achieving children, and for students of color, shot up in reading, math, and most other academic subjects. The gains were greatest at the low end of the spectrum—as seen in trends at the 10th percentile of achievement and a big drop in the percentage of students scoring at the “below basic” level.

By 2010 or so, our African American, Hispanic, and low-achieving students were reading and doing math two and sometimes three grade levels above their counterparts in the early 1990s. That’s historic, life-changing progress. And it surely contributed to more recent gains in the high school graduation rate for these groups, as many more kids came into ninth grade closer to being on track.

That’s the good news. The bad news is that there was less progress at the middle and top of the performance spectrum; essentially no achievement gains at the twelfth grade level; and most of the progress hit a wall around the time of the Great Recession. Results for middle-class kids over this period got a bit better in math, but not much in reading.

Those are the facts. The interpretive challenge is to understand why. Why did we see so much progress for the kids who had previously been “left behind”? I spent several posts digging into that question, and concluded that our schools could take only partial credit. Yes, it was a time of frenetic reform activity, and yes, it was also a period of significantly increased investment in our public schools. And those factors mattered. But what likely mattered more were the vastly improving social and economic conditions for our poorest children. Our cities in particular were transformed over the course of the 1990s, with child poverty rates plummeting and the incidence of violence falling dramatically. These trends—as much as anything schools or policymakers or “reformers” did—likely explain much of why our students started to learn so much more.

But back to the schools. Rigorous evidence indicates that accountability policies and increased spending both helped to boost achievement. That much is clear. What’s less clear is how. How did schools respond to accountability pressure to increase student learning? Was it in ways that policymakers had hoped, such as by moving the best teachers to the neediest schools and classrooms, or embracing evidence-based practices and high quality curricula, or shifting resources to the kids who need them most? Or were these improvements in math and reading made at the expense of other important pursuits? Were other academic subjects squeezed out of the curriculum? Did schools stop doing so much on the whole-child front, such as sacrificing recess and P.E.? And if so, were these choices good ones? And how did the increased spending lead to better results? What did they spend the money on?

These aren’t meant to be rhetorical questions—they are empirical. Unfortunately, we don’t have much data by which to answer them effectively. The sad fact is that we analysts have very little insight into what’s actually happening in our schools today, much less over the past quarter-century. But working toward answers to these questions would still be worthwhile (I’m talking to you, young academics looking for research projects!), as they would help us understand what worked and what we might learn for our efforts going forward.

—

So to restate, one last time: The achievement of low-performing kids and children of color rose dramatically from the late 1990s until the Great Recession. That was mostly because of improving social and economic conditions for these children, but accountability reforms and increased spending played a role, as well. Over the last decade, that progress has mostly petered out. And the gains we made were, of course, not nearly enough, as they mostly meant getting more kids to a basic level of literacy and numeracy and walking across the high school graduation stage—nowhere near the goal of readiness for college, career, and citizenship that is the proper objective of our K–12 system.

Here are a few personal reflections about these conclusions.

First, we reformers and policy wonks need to be much more humble about putting ourselves at the center of the story. It’s a great human temptation. We all want to be the hero in our personal narrative. But we need to bring some maturity and wisdom to the decades-long work of educational improvement, and be willing to acknowledge that the ups and downs of NAEP scores, college completion rates, and all the rest are more likely to be driven by what’s happening outside of schools than within.

I’m chagrined to admit that I really believed, back in the heady No Child Left Behind days, that it was policy that was leading to those test score gains among the neediest kids. And to be sure, solid research indicates that NCLB and similar state policies do deserve some credit. But only some. Somehow I—we?—missed what was happening in society at large—the declining poverty rates, the increasing supports for needy families, the plummeting crime rate. Of course those things would affect student learning.

And we did it again when the progress stalled around 2010. Some of us claimed that happened because we took the foot off the gas of accountability reform. Others said it was Common Core’s fault, or the flaws in new teacher evaluation systems. Those are all reasonable hypotheses, deserving of analysis. But what if it was mostly about the Great Recession, the spike in the unemployment rate, the increase in child poverty, and the decline in school spending? In other words, fellow reformers, it’s not all about us!

That doesn’t mean education policy or reforms like charter schools or Teach For America and the like don’t matter. Some states have consistently beaten the socioeconomic curve. And I don’t think it’s a coincidence that the states that made more gains than one would predict over this past quarter-century—like Massachusetts, Florida, and Indiana—are the ones that embraced education reform. They weren’t immune to the larger social and economic trends. But thanks to strong leaders and smart policies, they did better than expected.

So we should be humble about what policy can achieve, but we shouldn’t be despairing. It still matters.

Finally, this look at a quarter-century of student outcomes has reminded me of the importance of patience. Yes, that one’s tough for reformers, since the moral authority of our work comes from its urgency. Kids are in bad schools right now. Children don’t have a second chance to get a great education. And despite the gains we’ve made in basic literacy and numeracy, many kids are going to get crushed by the real world if we don’t help them achieve at much higher levels than that.

So a sense of urgency is critical in this work.

Yet we’ve seen time and again that we can make big mistakes by declaring something a failure too early. That was famously the case with the early Gates Foundation initiative on smaller high schools—which was thought to have flopped until rigorous studies finally emerged that showed significant gains, at least in some cities. Such was the case with No Child Left Behind, too. Jay Greene and Mike McShane are right that we need to learn from failure—but we also need to learn not to declare something a failure too soon.

I worry we might be doing that again today. Though the backlash to testing and accountability has subsided somewhat, there are still plenty of policymakers—and even some reformers—who would be happy to leave all of that behind. To which I would say: Hold your horses! We have spent the past decade overhauling standards, tests, and accountability systems, and finally committing real resources to capacity-building, especially in the form of curriculum implementation. These pieces have only come together in the last year or two, with the release of the first school ratings under the Every Student Succeeds Act. Now that Accountability 2.0 is finally in place—and we have a booming economy once more—let’s see if we can drive real improvements in achievement once again, and not just at the low end of the distribution this time.

What we need, then, is balance. We need to combine patience and urgency, humility and optimism, the passion of youth and the wisdom of experience. Let’s try to remember that in the school year ahead.

view

The proficiency bar is inching upward, yes, but…

Chester E. Finn, Jr.
8.28.2019
Flypaper

A dozen long years ago, when people were just beginning to take serious stock of what good and not-so-good was emerging from 2002’s enactment of No Child Left Behind (NCLB), we at Fordham, in league with the Northwest Evaluation Association (NWEA), issued a 200-plus page analysis of the “proficiency” standards that states had by then been required to set and test for. Titled The Proficiency Illusion, it reached a series of “sobering, indeed alarming” conclusions about where states were setting their proficiency bars in reading and math for purposes of “passing” their state assessments in the mid 2000’s. As Mike Petrilli and I wrote in the foreword:

We see…that “proficiency” varies wildly from state to state, with “passing scores” ranging from the 6th percentile to the 77th. We show that, over the past few years, twice as many states have seen their tests become easier in at least two grades as have seen their tests become more difficult….And we learn that only a handful of states peg proficiency expectations consistently across the grades, with the vast majority setting thousands of little Susies up to fail by middle school by aiming precipitously low in elementary school.

Others undertook kindred studies around the same time and reached similar conclusions. Writing in Education Next, also in 2007, this time using National Assessment (rather than NWEA) to benchmark and compare state standards, Paul Peterson and Frederick Hess found wide disparities in state proficiency expectations. They found three jurisdictions with “world class” cut scores, but went on to report that:

The remaining forty-seven states…had distinctly lower standards. Three states—Georgia, Oklahoma, and Tennessee—expected so little of students that they received the grade of F. The state of Georgia, for instance, declared 88 percent of 8th graders proficient in reading, even though just 26 percent scored at or above the proficiency level on the NAEP. According to our calculations, Georgia eighth-grade reading standards are 4.0 standard deviations below those in South Carolina, an extraordinarily large difference. Thus, while students in Georgia and South Carolina perform at similar levels on the NAEP, the casual observer would be misled by Georgia’s reporting that its students achieve proficiency at three times the rate that South Carolina’s students do.

Twelve states—Alabama, Alaska, Idaho, Illinois, Michigan, Mississippi, Nebraska, North Carolina, Texas, Utah, Virginia, and West Virginia—received Ds because they had pitched their expectations far below other states. Illinois set its proficiency bar for eighth-grade reading at a level that is 1.01 standard deviations below the national average. If you believe those who set the Illinois standards, 82 percent of its eighth graders are proficient in reading, even though the NAEP says only 30 percent are.

Also in 2007, the federal government’s National Center for Education Statistics (NCES), which is responsible for NAEP, came out with its own analysis of how state proficiency expectations compared with “proficiency” as defined by the National Assessment Governing Board. (This was based on state norms as of 2005.) Here, once again, we learned both of huge discrepancies from state to state and of a situation wherein the vast majority of states expected far less of their students by way of skills and knowledge in math and ELA than was deemed proficient on the National Assessment. This report’s prose was less colorful than the think tankers’, but it said essentially the same thing, with an important additional wrinkle that you will find in the last eleven words of this quote:

There is a strong negative correlation between the proportions of students meeting the states’ proficiency standards and the NAEP score equivalents to those standards, suggesting that the observed heterogeneity in states’ reported percents proficient can be largely attributed to differences in the stringency of their standards. There is, at best, a weak relationship between the NAEP score equivalents for the state proficiency standard and the states’ average scores on NAEP. Finally, most of the NAEP score equivalents fall below the cut-point corresponding to the NAEP Proficient standard, and many fall below the cut-point corresponding to the NAEP Basic standard.

All that is by way of context for the new report from NCES, which comes twelve years into the present and again maps state proficiency standards onto the NAEP scales, but this time does so using states’ assessment results—and NAEP results—from 2017. Better still, it also looks backward to previous such mapping exercise to see what’s changed.

The good news, as stated by veteran NCES associate commissioner Peggy Carr during a press briefing, is that “States that were identified as having lower standards increased their expectations for students over the previous decade.” She also noted, I think rightly, that the sunlight cast upon past state proficiency norms was causing weak performers to “second-guess” themselves. “Most of what we are seeing is the states at the bottom of our distribution of standards are saying, ‘Well, they should be a little more rigorous.’ That’s a function of seeing themselves in the context of other states.”

Success has many parents, and we at Fordham include ourselves among those who will take—and deserve—some credit for nudging (and perhaps shaming) a lot of states to expect more of their students. Perhaps they’ve also been encouraged by ESSA devolving more responsibility upon them, so that it’s no longer a contest to prove to Uncle Sam that all one’s students were headed to proficiency by an arbitrary date or else the roof will fall, as was true under NCLB, and more like “You still need to report how your students are doing but now it’s your problem to own and solve.”  

But before we strain our shoulders patting ourselves—or the states or NCES or anybody else—on the back, let us recognize how limited is the actual “success” reported in this analysis.

Start by observing that Ms. Carr focused much of her commentary on how many states no longer had proficiency norms set at (or even below) what NAEP defines as basic rather than proficient. Bear in mind that the three NAEP achievement levels are “basic,” “proficient,” and “advanced,” with proficient defined by the Governing Board as:

Solid academic performance for each grade assessed. Students reaching this level have demonstrated competency over challenging subject matter, including subject-matter knowledge, application of such knowledge to real-world situations, and analytical skills appropriate to the subject matter. Thus, NAEP Proficient represents the goal for what all students should know.

Yet when we scrutinize the new NCES report we find, for example, that “In grade four reading, forty-seven of the fifty states included in the study had standards at or above the NAEP Basic level. Two states—Utah and Massachusetts—had standards at the NAEP Proficient level, while three states—Texas, Iowa, and Virginia—had standards below the NAEP Basic level.”

The picture in math is brighter. In eighth grade, for example, “all of the thirty-two states included in the study had standards at or above the NAEP Basic level. Seven states…had standards at the NAEP Proficient level.”

It’s worth noting that loftier state expectations in math might have something to do with the fact that American youngsters over the past couple of decades have made greater gains in math than in reading in the early grades. (Don’t even get me started on how little is known by anyone about high school expectations and how those compare from state to state.) Still, let’s keep the findings of this new report in perspective. Yes, it’s a fact that many states expect more of their students today than they did a dozen years earlier. That is indeed progress—and a fine thing, as far as it goes. Yet few states have matched (much less surpassed) NAEP’s proficient level in either math or reading at either grade four or eight. Those that have done so definitely deserve plaudits. But most states are being compared here with NAEP Basic—and basic just isn’t good enough!

One more thing. Setting the bar higher doesn’t mean that more kids are clearing it—or that the students in your state are actually learning more. It simply means you’re expecting more. Kansas, for example, now has the highest cut score in the land for eighth grade reading, when compared with NAEP achievement levels. But its eighth graders were reading no better in 2017 than in 2007—or 1968. This means that Kansas is at least being honest about how its students are doing—but how they’re doing (37 percent proficient or above in eighth grade reading in 2017) shouldn’t satisfy the parents and other taxpayers of the Sunflower State, especially since it seems not to be improving.

Progress on standards is a fine thing. But today they’re still low in the great majority of states—and so is student achievement. We’re now thirty-six years from 1983, but the nation is still at risk.


view

Influences affecting the educational trajectory of students

Jeff Murray
8.28.2019
Flypaper

A new study from Georgetown University reaffirmed an uncomfortable but familiar finding: Socioeconomic status has a significant effect on students’ long-term outcomes, regardless of their academic performance in kindergarten or the quality of the schools they attend in K–12.

Lead researcher Anthony Carnevale and his team did not look at specific students, but at long-term education trends in specific income quartiles. They started with data from the Early Childhood Longitudinal Study: Kindergarten (ECLS-K) from spring 1999 to inform their demographic and socioeconomic analysis, and to determine children’s reading and math skills from the earliest point. Ultimately, they chose math scores as their main basis of academic achievement across all data sets. They also used the annual American Community Survey of the U.S. Census Bureau to gather data on race and ethnicity, socioeconomic status (SES), jobs and occupations, educational attainment, and other status markers. Other data sources included the national Consumer Expenditure Survey from the Bureau of Labor Statistics (buying habits, household income, etc.), the Education Longitudinal Study of 2002 (high school math performance, postsecondary access, and early labor market outcomes), and the National Longitudinal Study of Adolescent to Adult Health (comparing differences in environment based on race, ethnicity, and SES).

In short, millions of data points were combined to build a picture of “typical” students at different points on their K–12 path. Researchers then compared the trajectories of different types of typical students starting at similar points of academic achievement in kindergarten—both high and low—to determine how their circumstances did or did not affect their trajectories into adulthood.

The key findings, extrapolated for today’s students: 1) Family resources matter. Among the affluent, even a kindergartener with test scores in the bottom half has a seven in ten chance of reaching high SES status as a young adult. But a disadvantaged kindergartener with test scores in the top half—across all racial and ethnic groups—has only a three in ten chance of reaching the same high SES level. 2) Where students start is often a function of outside factors. Only about a quarter of the lowest-SES kindergarteners have top-half math scores, compared to three-quarters of the highest-SES kindergarteners. Children’s early scores also vary by race, but mainly because black and Latino children are twice as likely as white children to come from the lowest-SES families. 3) All children can improve their academic standing through primary school, but their chances of improvement correlate to SES status. By the eighth grade, fewer than one in five of the lowest-SES kindergarteners with bottom-half starting math scores will move up to the top half, compared to more than two in five of the highest-SES kindergarteners. 4) Higher-SES students are more likely to maintain high scores than their lower-SES peers, and white and Asian children are more likely to do so than black or Latino children. 5) Achievement patterns are largely set by the time children enter high school, especially for the lowest performers. Most tenth graders who scored in the bottom math quartile will still score in the bottom quartile in twelfth grade. 6) High school achievement sets the stage for college attainment—but family class plays an even greater role. The highest-SES students with bottom-half math scores are more likely to complete a college degree than are the lowest-SES students with top-half math scores. 7) Education can be a lever for upward mobility. The lowest-SES tenth graders with top-half math scores are twice as likely to become high-SES young adults as their peers with bottom-half math scores. Disadvantaged students who show promise can achieve, but their chances are better with interventions—the earlier the better.

Carnevale and his team generally paint a depressing picture of the outcomes awaiting today’s kindergarteners, especially poor students and students of color. But they found hope amid the meager amount of mobility in their data. Their recommendations—expanding pre-K, strengthening academic interventions, early career counseling—are good but mostly “extracurricular.” That is, their model assumes that all educational settings are equal, or at least equally benign, and that help for typical students to break out of the identified patterns must be adjunct to regular schooling. Such interventions will also cost a lot of additional money.

But research has shown that the very best schools and teachers are already capable of boosting achievement for most students and that specific inputs within a school’s day, year, and budget are especially helpful for initial low-performers. Boosting pre-K support for disadvantaged children is one thing, but we already spend billions annually to move the achievement needle for all students within existing K–12 structures. We should be looking first and foremost for solutions that make use of what already works in our schools. And what doesn’t work should be ended or changed first.

SOURCE: Anthony P. Carnevale, et. al., “Born to Win, Schooled to Lose: Why Equally Talented Students Don’t Get Equal Chances to Be All They Can Be,” Georgetown University Center on Education and the Workforce (July 2019).

view

Can educational data mining predict student performance and enhance personalized learning?

Olivia Piontek
8.28.2019
Flypaper

Artificial intelligence and machine learning are ubiquitous, playing a role in everything from Netflix and Instagram algorithms to transportation and healthcare delivery. But it’s also increasingly being used to improve educational pedagogy and delivery through a process called educational data mining (EDM).

This growing field of AI R & D uses data gathered in educational environments to recognize patterns and predict outcomes, informing the development of educational theories and practice. The hope is that the predictive capabilities of EDM will enable teachers to do things like identify at-risk students before it’s too late and provide personalized instruction to all students. This is part of the recent rise of personalized learning—a hot-button issue in education technology that is being embraced by researchers, practitioners, and tech-savvy philanthropists like Bill and Melinda Gates and Priscilla Chan and Mark Zuckerberg.

A small but growing body of research suggests that personalized learning strategies can improve students’ academic performance, but doing this well and at scale will require technology that has the ability to identify which students are in danger of falling behind before it’s too late to reverse their trajectory.

To test whether today’s tech is up to the task, researchers at Greece’s University of Petras gathered data on 3,700 secondary school students between the ages of twelve and seventeen, comprising performance on two fifteen-minute tests and a one-hour assessment, overall grades for the two consecutive semesters, and students’ year in school. They then examined how good five of the field’s most popular EDM algorithms were at using these data to predict performance on an a same-year end-of-year math examination.

Researchers used a sophisticated formula known as a “semi-supervised machine learning algorithm.” Here’s how it works: The algorithm uses two kinds of data, “labeled” and “unlabeled.” Labels are added by human operators and signal to the algorithm what is important for the problem it’s trying to solve—in this case, for example, engineers might tell the algorithm that earlier scores on math tests are especially important and likely to be predictive. This makes finding the solution easier, but it also takes significantly more time and effort on the part of humans—one of the things artificial intelligence and machine learning are meant to decrease. Moreover, data collected from schools usually lack these labels, so the goal is to develop technology that predicts performance with minimal human intervention.

To see how much data, and how much labeling, is necessary to make an accurate prediction, researchers tested each algorithm in six ways. Using all of the data, they assessed predictive power when 10 percent, 20 percent, and 30 percent of the student information were labeled. They subsequently conducted the same process only using data from the first of two semesters.

The research found that in all instances, the algorithms were able to predict scores on students’ end-of-year math exam with between 70 and 80 percent accuracy. In other words, this held even when 90 percent of data was unlabeled, and even when only data from students’ first semester was used.

Researchers noted that each algorithms’ predictive consistency was unusual, particularly when only 10 percent of the data were labeled. Although offering no explanation for this surprising result, they argue that what type of labeled data are incorporated into an algorithm matters a lot; in other words, it’s more about identifying which student attributes serve as reliable indicators of future academic performance, such as previous performance, socioeconomic status, certain demographic characteristics, or interactions with learning interventions. They also pointed out that achieving a 70 to 80 percent accuracy rate is fairly uncommon. For example, a recent study examining the predictive accuracy of COMPAS, a similar data-mining algorithm that predicts recidivism of criminal offenders, found that the program only accurately predicted 65 percent of repeat offenses, even when as many as 137 attributes—including offenders’ race, age, number of offenses, and more—were incorporated. The takeaway on both these points is that there needs to be more research that explores how and why certain attributes affect student performance more than others.

Clearly, identifying struggling students and intervening before it’s too late is an educational strategy that researchers and practitioners alike agree is important. But doing so is not always realistic, and because teachers are human, they are bound by limitations both in terms of time and ability to identify at-risk students. Several new studies, including one about using artificial intelligence to develop military combat strategy, indicate that properly-deployed AI is able to more accurately and quickly predict outcomes than even the experts most familiar with the subject at hand.

That’s why research like this is promising. Teachers’ responsibilities and limitations hinder their ability to provide personalized interventions that can reverse a trajectory of poor performance. As this study illustrates, AI can help. And because it and similar technologies will continue to draw significant R & D investment, it only stands to improve over time.

SOURCE: Ioannis E. Livieris et al., “Predicting Secondary School Students' Performance Utilizing a Semi-supervised Learning Approach,” Journal of Educational Computing Research (January 2018).

view

The Education Gadfly Show: Boosting student outcomes with end-of-course exams

8.28.2019
Podcast
 

On this week’s podcast Mike Petrilli and David Griffith talk to Adam Tyner about the new Fordham report he co-authored with Matthew Larsen on end-of-course exams and student outcomes. On the Research Minute, Amber Northern examines efforts to improve the college application process.

Amber’s Research Minute

Brian G. Knight and Nathan M. Schiff, “Reducing Frictions in College Admissions: Evidence from the Common Application,” National Bureau of Economic Research (August 2019).

Fordham Logo

© 2026 The Thomas B. Fordham Institute
Privacy Policy
Usage Agreement

National

P.O. Box 110
Burke, VA 22009

202.223.5452

[email protected]

Ohio

P.O. Box 82291
Columbus, OH 43202

614.223.1580

[email protected]

Sponsorship

130 West Second Street, Suite 410
Dayton, Ohio 45402

937.227.3368

[email protected]