
Editor’s note: This is the seventh in a series of posts (see here, here, here, here, here, and here) looking at whether the nation’s schools have improved over the past quarter-century or so. Special thanks to research intern Kara Long for her help with data analysis.
So far in this summer series, I’ve made this case:
1. Student outcomes rose significantly for the lowest-performing students and students of color from the late-1990s until the Great Recession—especially in reading and math, but in other academic subjects, too. There’s also been big recent improvement in the high school graduation rate for these groups.
2. Education reforms during this period, plus increased spending, deserve credit for some of these gains, though the rising socioeconomic tide of the booming 1990s was surely a major factor as well.
3. On the flip side, the fierce headwinds generated by the Great Recession—both in terms of child poverty and in decreased school spending—help to explain The Lost Decade of Educational Progress.
4. National economic trends—especially the child poverty rate, properly construed—might be the biggest driver of national education trends, but some states have beaten the socio-economic curve. They tend to be the ones, like Massachusetts, Florida, and Indiana that have embraced education reform.
These are significant claims. Yet so far I’ve focused on the dramatic, if stalled, progress of America’s lowest-performing students, many of whom (but not all, Vice President Biden!) are also low-income and children of color. But what about everyone else? While many of my friends in education reform are squarely focused on children who have been “left behind,” that leaves behind tens of millions of other kids. Plenty of policymakers and analysts—certainly including us at Fordham—place a special priority on the disadvantaged and those at risk of illiteracy or worse, but we also care about everybody else. So how’s the vast middle class doing?
I see three key trends worthy of comment.
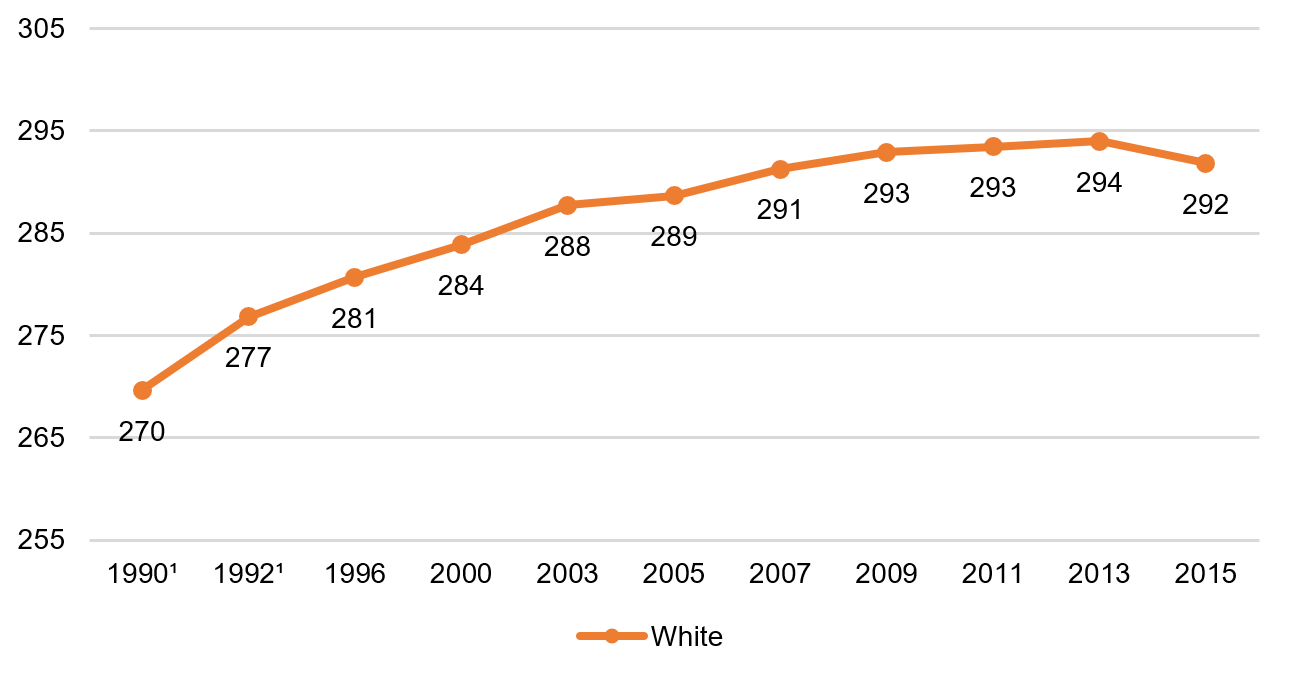
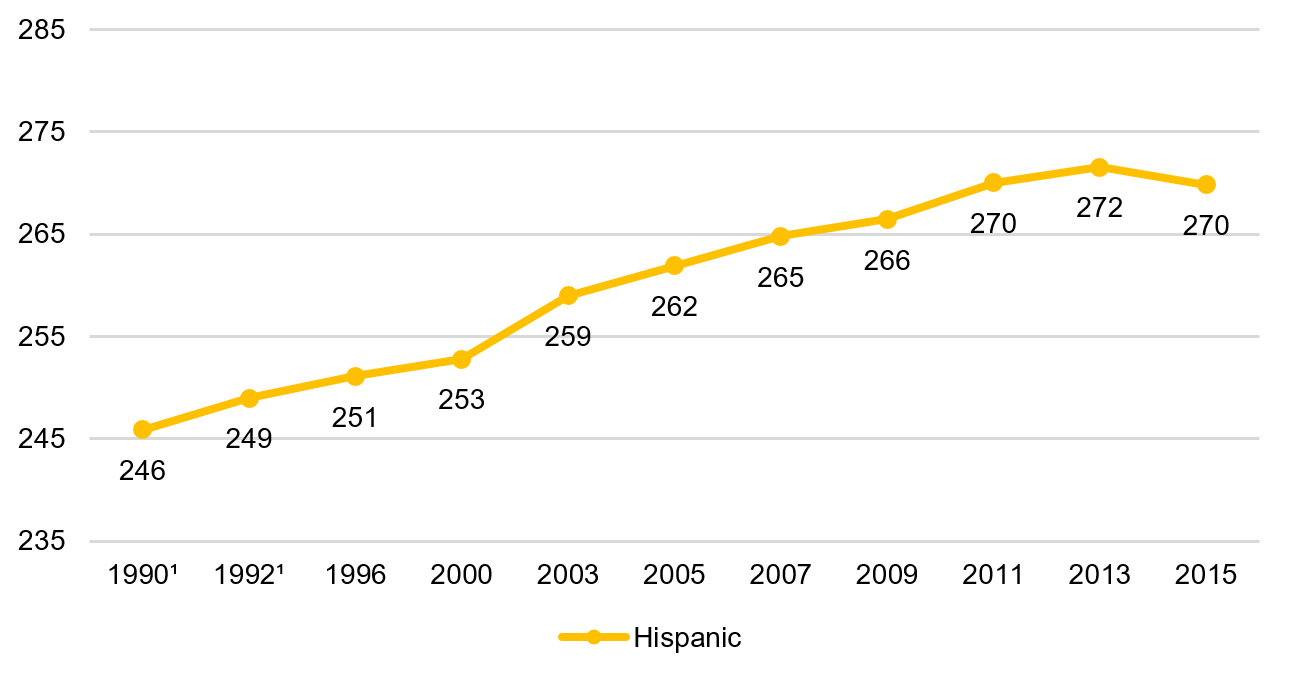
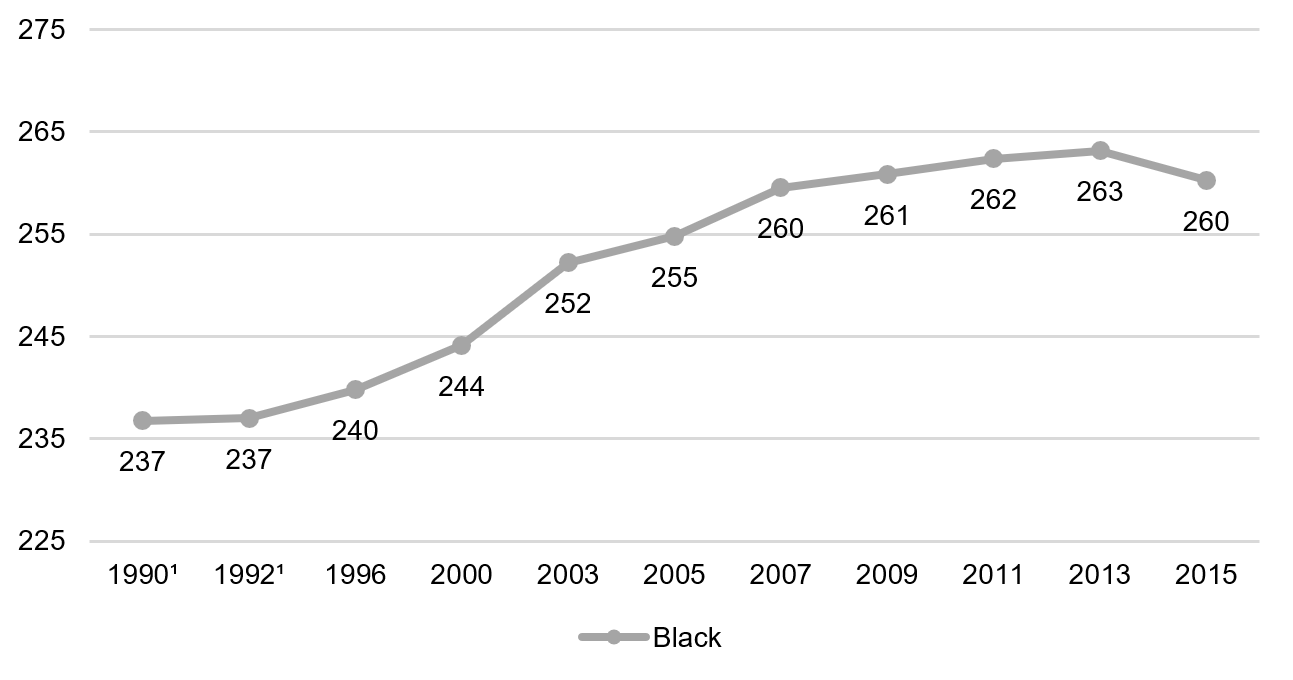
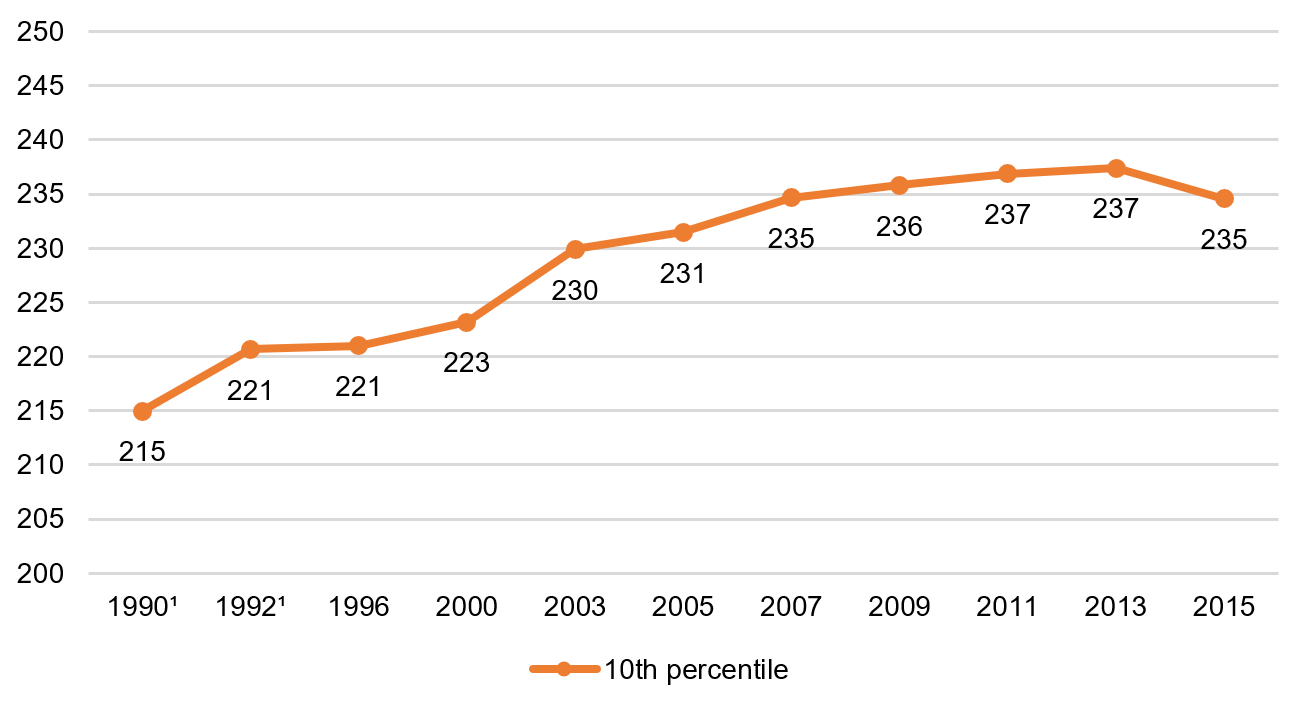
1. Progress in math in fourth and eighth grade has been widespread and long-lasting. Virtually all groups of students are doing much better now than before. Here are a few examples of what widespread progress looks like, reproduced from this 2017 post:
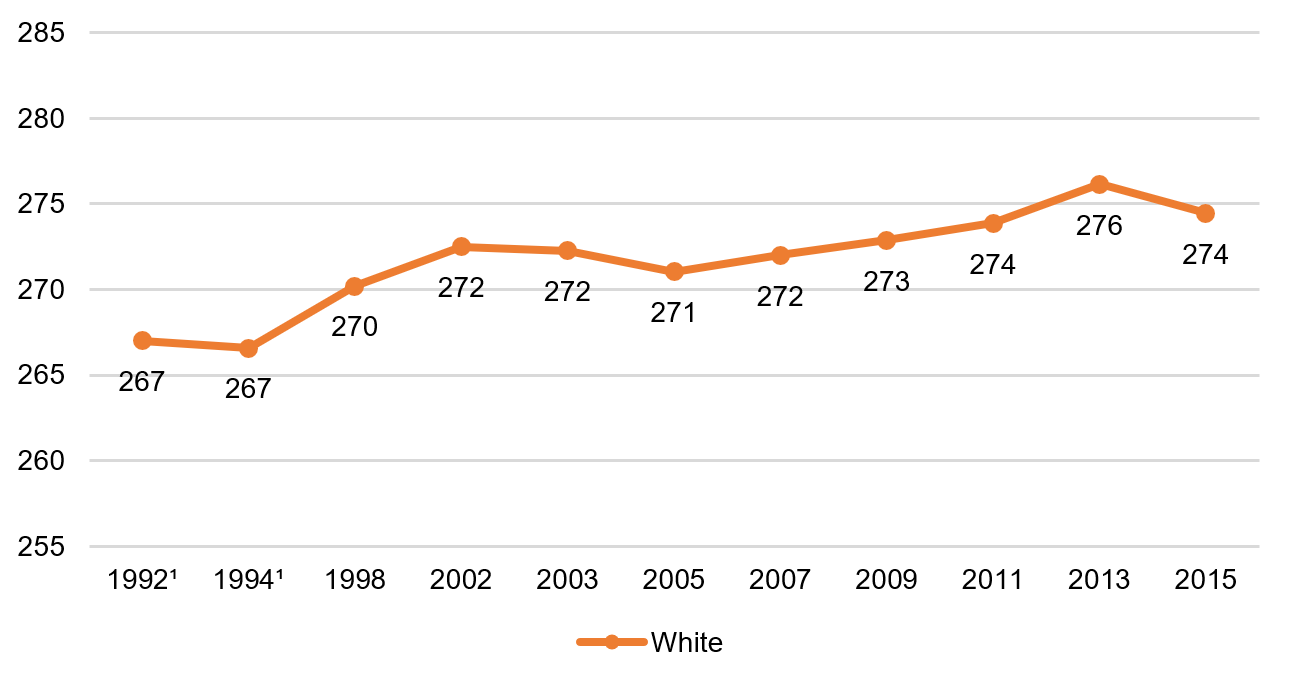
Eighth grade math, white students, 1990–2015
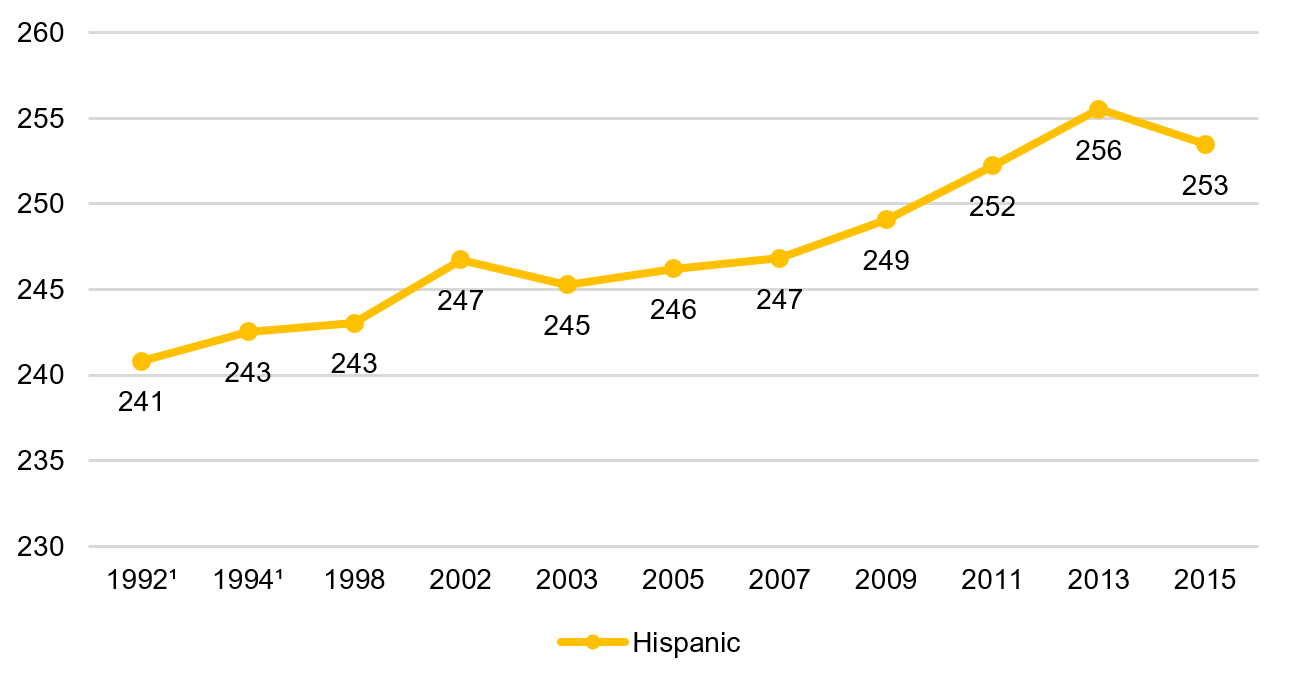
Eighth grade math, Hispanic students, 1990–2015
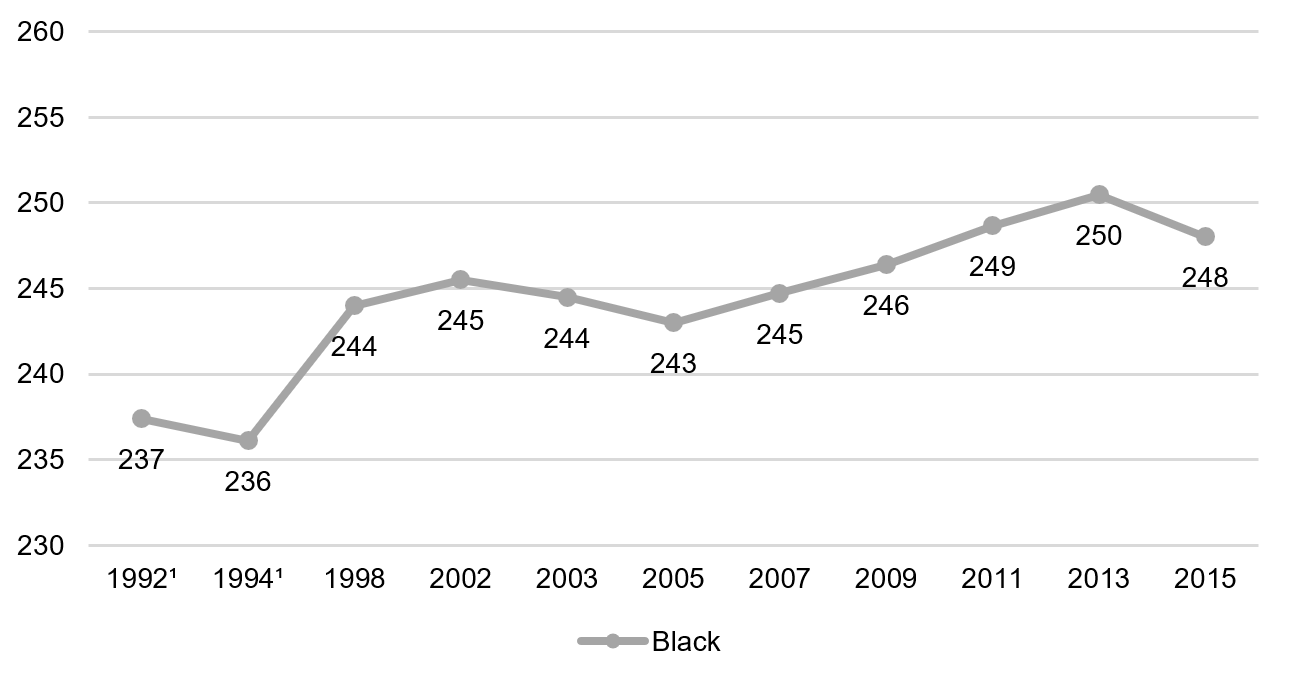
Eighth grade math, black students, 1990–2015
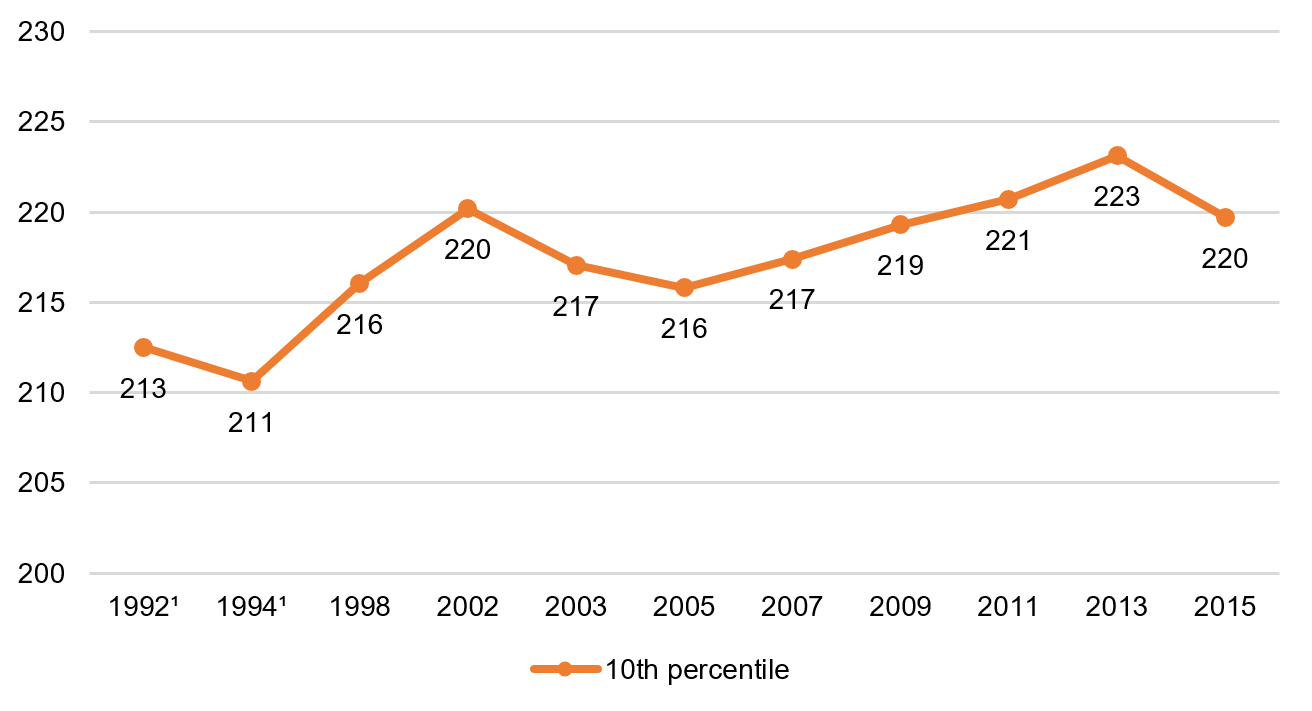
Eighth grade math, 10th percentile, 1990–2015
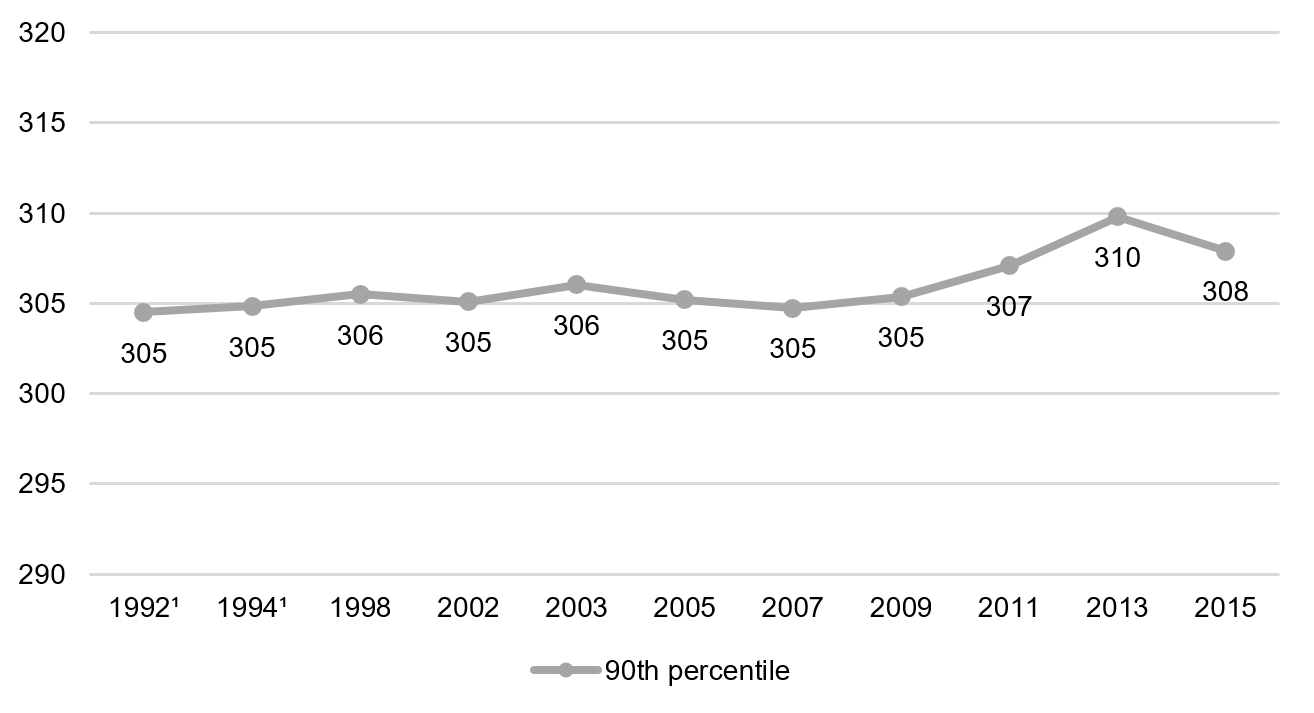
Eighth grade math, 90th percentile, 1990–2015
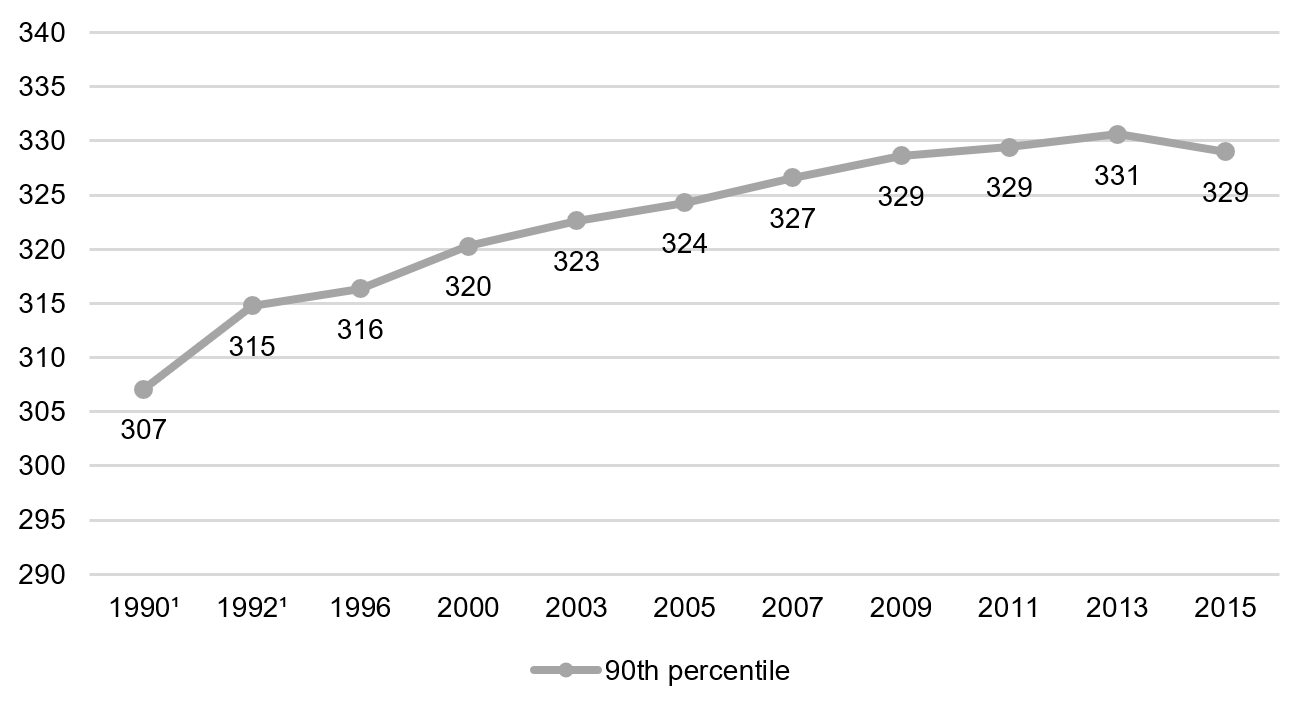
Note in particular the strong progress for students at the 90th percentile who, regrettably, include very few disadvantaged students.
2. In reading, progress was generally limited to low-performing students and students of color. Going back to the 2017 post again, we can see in particular the relatively flat performance of students at the 90th percentile compared to the strong gains we see at the 10th.
Eighth grade reading, white students, 1992–2015
Eighth grade reading, Hispanic students, 1992–2015
Eighth grade reading, black students, 1992–2015
Eighth grade reading, 10th percentile, 1992–2015
Eighth grade reading, 90th percentile, 1992–2015
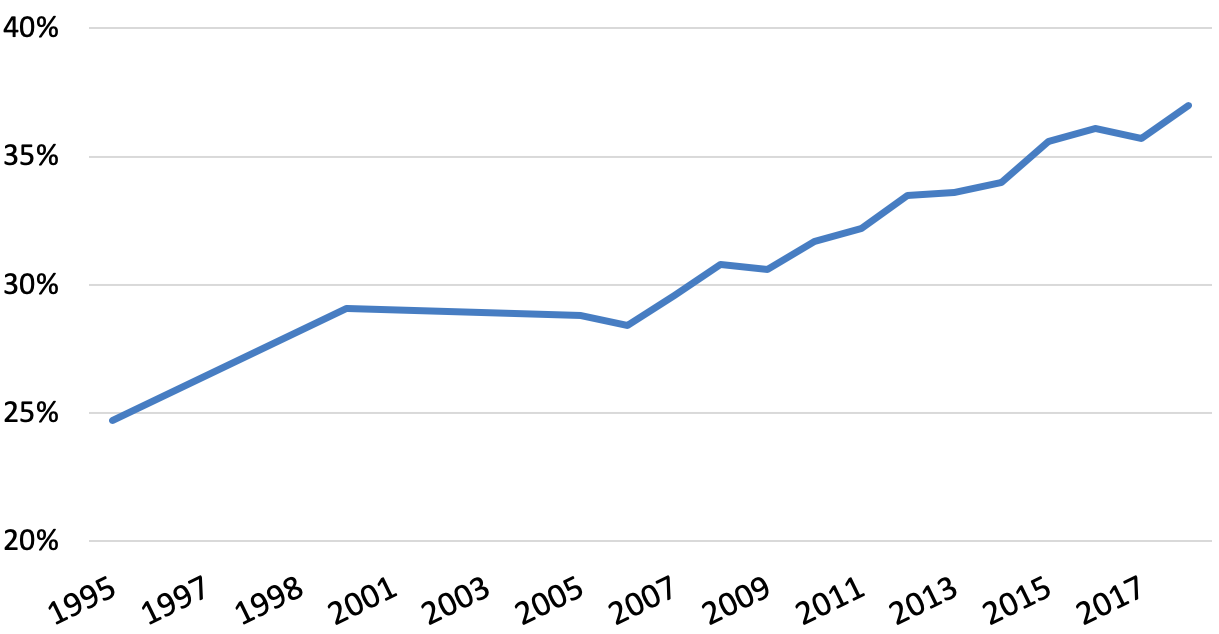
3. College completion rates are up significantly. As others have noted, there’s been limited progress on this count for disadvantaged students. But overall, the proportion of young Americans with at least a bachelor’s degree has grown significantly, going from 28 percent in 2007 to 37 percent just ten years later—an incredible increase of almost a third. For young white Americans, the college completion rate is now approaching fifty percent.
Percentage of 25–29-year-olds with a four-year degree or higher
What to make of these three trends? First, it sure seems like we got better at teaching math than we did at teaching reading. The reading gains, limited as they were to our lower-performing and lower-income students, may have been driven mostly by our significant progress in reducing child poverty rates. Perhaps a shift to a more scientifically-based approach to reading instruction in the early grades in the early 2000s helped as well. States that have put a steadfast focus on this type of instruction, like Florida, Mississippi, and Massachusetts, have seen better reading results than most everyone.
But whereas we’ve had a fairly coherent and stable approach to teaching math for several decades—thanks to leadership from the National Council of Teachers of Mathematics among others—our thinking and teaching on reading remains woefully inadequate—for poor kids and for everyone else. As Emily Hanford illustrated so effectively in her radio documentary, “balanced literacy” maintains its hegemony in the early grades, despite its weakness on systemic instruction in phonics, phonemic awareness, and other parts of evidence-based instruction. And as Natalie Wexler argues so well in her brand-new book, we continue to teach reading comprehension as a skill instead of embracing the critical role of knowledge-building in creating stronger readers. If progress is possible in math, it’s possible in reading, but we need to stop doing what isn’t working and launch a new strategy instead.
And what about the college completion boom? Do our schools deserve credit for that, or is there something else at play? That’s a big question that deserves its own post. But it may solve the riddle of why middle-class parents are perennially unwilling to sign up for education reform’s various hoped-for revolutions. When it comes to the most obvious marker of school success—the coveted college degree—things appear better than ever, at least for our own children.
So how are America’s middle-class kids doing? They still don’t read very well, though their math skills have improved a bit. And they are graduating from college in higher and higher numbers. In other words, achievement is mostly flat, while attainment is up. Whether that’s worthy of celebration or a sign that Lake Wobegon has infected our system of higher education, it’s a reality with which we reformers are going to have to grapple.