Mobile Navigation

  • National
    • Policy
      • High Expectations
      • Quality Choices
      • Personalized Pathways
    • Research
    • Commentary
      • Gadfly Newsletter
      • Flypaper Blog
    • Events
    • Scholars Program
  • Ohio
    • Policy
      • Priorities
      • Media & Testimony
    • Research
    • Commentary
      • Ohio Education Gadfly Biweekly
      • Ohio Gadfly Daily
  • Charter Authorizing
    • Application
    • Sponsored Schools
    • Resources
  • About
    • Mission
    • Board
    • Staff
    • Career
Home
Home
Advancing Educational Excellence

Main Navigation

  • National
  • Ohio
  • Charter Authorizing
  • About

Ohio Menu

  • Topics
    • Accountability & Testing
    • Advanced Education
    • Career & Technical Education
    • Charter Schools
    • Curriculum & Instruction
    • ESSA
    • Evidence-Based Learning
    • Governance
    • Personalized Learning
    • Private School Choice
    • School Finance
    • Standards
    • Teachers & School Leaders
  • Research
  • Policy
  • Commentary
    • Ohio Gadfly Newsletter
    • Ohio Gadfly Blog
    • Events

The Education Gadfly Weekly

Sign Up to Receive Fordham Updates

We'll send you quality research, commentary, analysis, and news on the education issues you care about.
Thank you for signing up!
Please check your email to confirm the subscription.

Ohio Gadfly—Is College Credit Plus living up to its potential?

Volume 20, Number 5
2.25.2026
2.25.2026

Ohio Gadfly—Is College Credit Plus living up to its potential?

Volume 20, Number 5
view
Is College Credit Plus living up to its potential blog image
Standards & Accountability

Is College Credit Plus living up to its potential?

A newly-updated report on College Credit Plus has been released, covering 2015–16 through 2024–25. Is Ohio’s dual enrollment program living up to the promise of boosting students to and through college with less debt? We take a look at the findings.

Jessica Poiner 2.25.2026
OhioOhio Gadfly Daily

Is College Credit Plus living up to its potential?

Jessica Poiner
2.25.2026
Ohio Gadfly Daily

Grade inflation comes to Ohio’s school ratings

Aaron Churchill
2.27.2026
Ohio Gadfly Daily

Indiana shows Ohio how to champion youth apprenticeships

Jessica Poiner
3.2.2026
Ohio Gadfly Daily

Proponent testimony on Ohio Senate Bill 19

Chad L. Aldis
2.24.2026
Ohio Gadfly Daily

Global school choice at a glance

Jeff Murray
2.26.2026
Flypaper

Ohio Education By the Numbers—2026 Edition

2.24.2026
Report
view
Ohio report card - overall calc blog image

Grade inflation comes to Ohio’s school ratings

Aaron Churchill 2.27.2026
Ohio Gadfly Daily
view
Youth apprenticeships blog image

Indiana shows Ohio how to champion youth apprenticeships

Jessica Poiner 3.2.2026
Ohio Gadfly Daily
view
Senate Bill 19 testimony image

Proponent testimony on Ohio Senate Bill 19

Chad L. Aldis 2.24.2026
Ohio Gadfly Daily
view
Students looking at a globe

Global school choice at a glance

Jeff Murray 2.26.2026
Flypaper
view
OEBTN 2026 SEO image

Ohio Education By the Numbers—2026 Edition

Aaron Churchill 2.24.2026
Report
view
Is College Credit Plus living up to its potential blog image

Is College Credit Plus living up to its potential?

Jessica Poiner
2.25.2026
Ohio Gadfly Daily

Ohio’s dual credit program, College Credit Plus (CCP), provides academically eligible students in grades 7–12 the opportunity to earn postsecondary credit by taking college courses for free. Launched during the 2015–16 school year after a significant overhaul of the state’s former dual-credit program, CCP permits students to take courses at their high school with an approved secondary teacher or college instructor, on a university campus, or online.

According to the Ohio Department of Higher Education (ODHE), the purpose of CCP is threefold: 1) to enhance students’ career readiness and postsecondary success, 2) to offer a wide variety of college credit options to college-ready students, and 3) to provide those options at no or limited cost. A performance audit conducted by the Ohio Auditor of State in 2022 found that overall participation, student impacts, and tuition savings from the program were positive, indicators that CCP was meeting its goals to boost student readiness and help families save money. Ohio’s goal of providing college credit options to all college-ready students, however, was still a work in progress, as the audit found that traditionally underserved students were missing out on the program’s benefits.

Given that it’s been a decade since CCP was launched, now seems like a good time to re-examine Ohio’s progress. ODHE recently released an updated annual report that includes CCP data from 2015–16 through 2024–25. For those interested in dual credit, the report is worth a read in its entirety. But for the sake of this analysis, we’ll examine the data through the lens of CCP’s three primary aims.

1. Boosting student readiness and postsecondary success

When it comes to student outcomes, the annual report primarily focuses on grades. During the 2024–25 school year, a total of 93 percent of students earned a passing grade in their CCP course or courses. Just under 3 percent earned a failing grade, while nearly 2 percent were identified as withdrawals.[1]

On the surface, this seems like great news. Tens of thousands of Ohio high schoolers are taking college courses, passing them, and earning credit. But a closer look at the annual report reveals that the vast majority of courses during the 2024–25 school were taken either online or at a high school with an approved secondary teacher. It’s possible that online courses and high school teachers are delivering rigorous, college-level instruction. But with widespread grade inflation, it’s hard to be sure. Advanced Placement (AP) and International Baccalaureate (IB) courses, which also offer the opportunity to earn college credit, avoid the grade inflation problem by awarding college credit only to those who earn a minimum passing score on a standardized exam. CCP courses, meanwhile, award college credit solely based on grades.

Another way to measure student outcomes is through attainment. The annual report notes that CCP is increasingly used as a pathway to earning a degree before graduation. In fact, in 2025, students earned a record 861 certificates and 958 associate degrees while still in high school.

Again, this seems like great news. But ODHE’s annual report doesn’t identify the subject or industry in which students earned their certificates or associate degrees. And as we’ve seen with industry-recognized credentials (IRCs) linked to high school graduation, those details matter. The number of Ohio students earning IRCs has skyrocketed, and more students are graduating as a result, but there are large discrepancies between graduation and academic proficiency rates, and the credentials students are earning haven’t (yet) been linked to data on wages, job outlook, or employer demand. In other words, there’s very little evidence that students are better off—academically, financially, and in terms of employability—after earning an IRC. Without detailed data about the certificates and associate degrees being earned under CCP, it’s similarly difficult to determine whether students are better off.

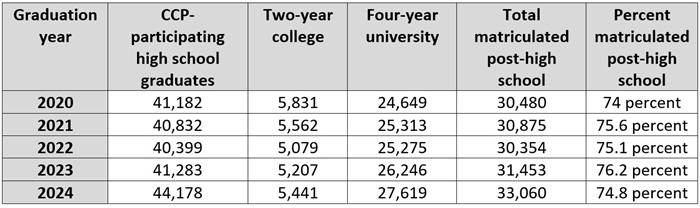
A third way to examine student outcomes is college-going rates. Using data obtained from the National Student Clearinghouse, the report identifies the number of CCP-participating high school graduates who went on to enroll in postsecondary education. Table 1 identifies the numbers for the last five years.

Table 1. Matriculation to postsecondary education after high school graduation
Is College Credit Plus living up to its potential blog Table 1

Based on these data, the majority of CCP participants enroll in a postsecondary institution after high school graduation. That’s good news. But it’s unclear how many go on to actually earn a degree, the ultimate indicator of postsecondary success. It makes sense that attainment rates would be missing for most of the years identified in Table 1, as many of these students could still be working toward a degree. But the report offers matriculation data as far back as 2016 and doesn’t provide accompanying attainment rates. That leaves us with an incomplete picture. ODHE should rectify this by including attainment data in its report.

2. Providing opportunities for all students

Since the inception of CCP, participation among low-income students has “hovered steadily” around 20 percent. During the 2024–25 academic year, however, that rate increased to 34 percent. It’s unclear how much of this sudden jump can be attributed to changing academic eligibility requirements, which could hurt, rather than help, students in the long-run. It’s also possible that the data have been impacted by the expansion of the Community Eligibility Provision. On its face, though, higher participation among low-income students is good news.

Unfortunately, the news isn’t as positive for minority students. The report fails to provide specific numbers, and state-level data available via report cards aren’t disaggregated by race, making it difficult to determine exact percentages. Based on what the report does include, though, there appears to be a sizable enrollment gap between White and minority students. Going forward, ODHE should offer more detailed data to ensure an accurate picture of enrollment gaps.

3. Helping students and families save money

ODHE’s report provides the rates of standard college tuition saved by participating students. These numbers have been calculated by multiplying the number of credits attempted at each institution type with the standard tuition rates that colleges report for the corresponding academic year. Table 2 identifies the numbers for the three most recent school years with available data. For the 2023–24 year, the total rate of tuition savings was more than $214 million. According to ODHE, families have saved over $1.5 billion in the last ten years.

Table 2. Tuition savings through CCP

Is College Credit Plus living up to its potential blog Table 2

These statewide numbers are impressive. But they could be glossing over the reality of negligible savings for individual families. Students who pass multiple CCP courses could be saving thousands of dollars in tuition because those accumulated credits help them graduate early. But according to the report, the majority of kids don’t participate in CCP until their junior or senior year, and most only enroll in one or two courses. Those one or two courses likely aren’t enough to shave a semester off a four-year degree. That means many students could still end up with four years’ worth of student loan debt regardless of the money they “saved” by earning college credit in high school.

***

What’s the verdict?

College Credit Plus has come a long way in the last decade. Tens of thousands of students are taking advantage of the opportunity to earn college credit while in high school. Most who participate in CCP go on to pass their courses and enroll in college after graduation. And based on standard tuition rates, the credits they earn in high school are saving them money.

But there are also signs that CCP isn’t yet living up to its full potential. Grade inflation, changing academic eligibility requirements, and a lack of detailed data on attainment collectively paint an incomplete picture of student outcomes. Sizable enrollment gaps (which could be explained by Ohio’s sizable achievement gaps) remain between low-income and minority students and their affluent and White peers. And despite “cumulative savings” exceeding $1.5 billion, it’s impossible to tell if individual students actually end up with less student loan debt courtesy of CCP.

Overall, state leaders should be encouraged by the data provided in this latest report. Tens of thousands of kids have access to opportunities they didn’t have before, and that’s nothing to sneeze at. But it should also serve as a reminder that there’s much work to be done—and no time to waste.



[1] The remaining outcomes each fell under 1.5 percent.

view
Ohio report card - overall calc blog image

Grade inflation comes to Ohio’s school ratings

Aaron Churchill
2.27.2026
Ohio Gadfly Daily

This is the fourth and last piece in a series that examines elements of Ohio’s school report card that could use refinement (previous articles covered chronic absenteeism, early literacy, and college and career readiness).

A wave of news stories and commentary have raised alarms about the grade inflation plaguing American high schools and universities. Report cards chock-full of easy A’s hide the truth from parents, weaken incentives to learn, create cultures of low expectations, cheapen grades and the diplomas based on them, and may even diminish students’ long-term economic prospects.

Unfortunately, grade inflation has also crept into Ohio’s school report card system (and other states, too), with many of the same consequences accruing to students, parents, and the general public. Peachy school ratings are most apparent and troubling in the “Overall” ratings given to Ohio schools.

The Overall rating and its mechanics

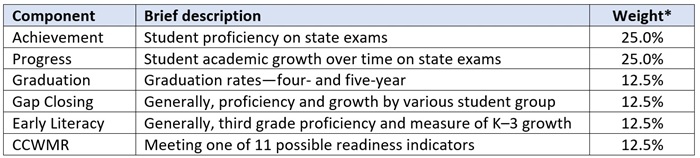
For more than two decades, Ohio has issued an Overall rating to districts and schools. This “summative” mark is supposed to offer a clear and user-friendly picture of academic performance across the various report card measures. Table 1 shows the current framework used to combine results. Each component contributes a certain weight to the Overall calculation, with “Achievement” (student proficiency) and “Progress” (academic growth) receiving the greatest emphasis. Starting in 2023, Ohio began issuing Overall ratings via a 1- to 5-star system.

Table 1: Ohio’s report card components and weights for calculating an Overall rating

Ohio report card - overall calc blog table 1
Notes: (*) Weights are adjusted proportionally when a component does not apply to a school. CCWMR = College, Career, Workforce, and Military Readiness. This document contains more technical detail about each component.

The Overall rating offers an essential bottom-line that helps the general public make sense of the disparate ratings and education data. The weighting system is sensible, too, as it rightly ensures that student proficiency and growth drive the ratings. Stars are transparent and easy to understand, albeit softer-sounding (for mediocre to low performers) than the state’s previous A–F system.

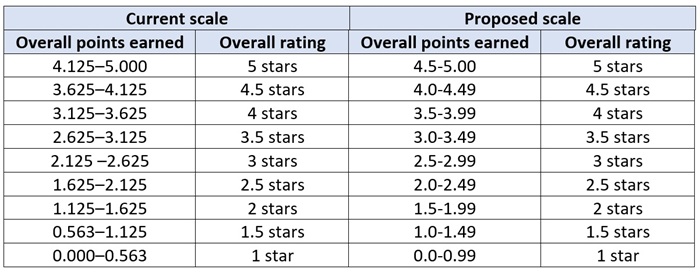
The inflationary problem, however, lies in the technical details. Specifically, the way Ohio translates the points earned on the various components into an Overall rating. Simply put, the method results in higher Overall ratings than what we would expect based on schools’ underlying results.

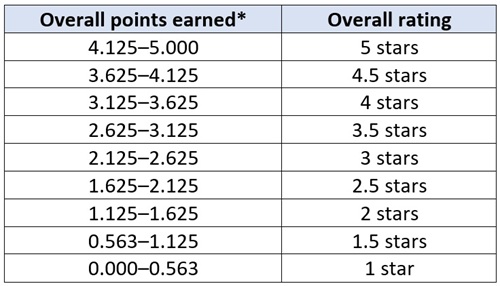
Table 2 displays the grading scale, with the left column representing the total points earned on the components and the corresponding Overall rating on the right. It’s hard to see at first, but upon close inspection, there is a significant misalignment between the points earned (based on the components) and the star rating. For instance, a school receiving 4.125 points receives 5 stars, even though its point total is closer to 4.5 stars. At the bottom of the scale, a school earning 0.75 points receives 1.5 stars, even though the 1-star rating is the nearest mark.

Table 2: Grading scale for the Overall rating

Ohio report card - overall calc blog table 2
Note: (*) The overall points earned is a weighted average number of points earned across the report card components. Schools receive 0 to 5 points for each component (except Progress) in quarter-point increments, based on the underlying data. For Progress, schools receive 1 to 5 points in whole-point increments based on their star rating. For more technical detail, see this document.

How the grading scale inflates ratings

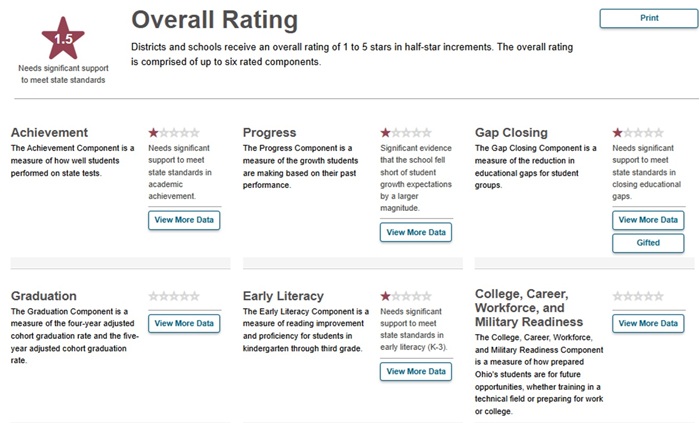
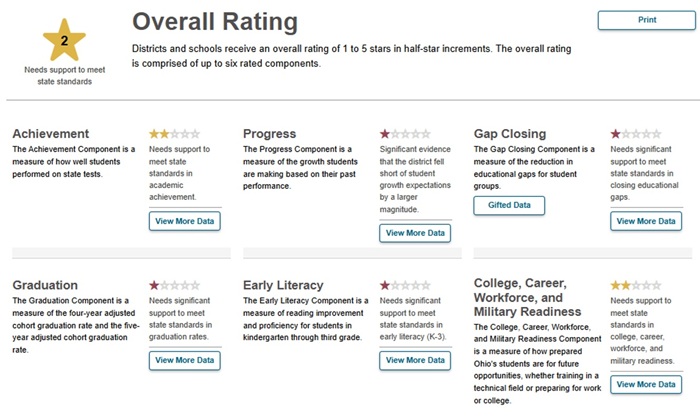
What are the real-world implications of this grading scale? Consider the report card for Valerie Elementary School in Dayton. It receives 1-star ratings on all of its components, yet strangely enough, receives a 1.5-star Overall rating. Another oddball is Lima City Schools. Despite receiving 1-star ratings on four of six components (including a heavier weighted one), the district ended up with a 2-star Overall rating.

Figure 1: Valerie Elementary (top) and Lima City Schools (bottom) report card, 2024–25

Ohio report card - overall calc blog figure 1a


Ohio report card - overall calc blog figure 1b

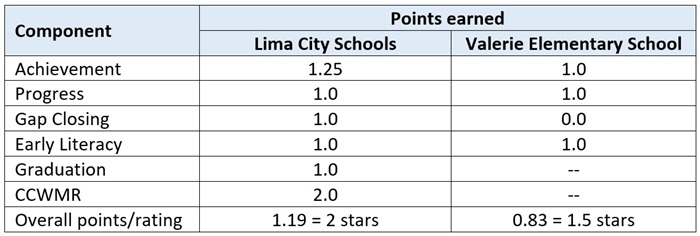
These counterintuitive Overall ratings are the direct result of the grading scale. As Table 3 shows, Lima City Schools earned 1.19 overall points, but that total was generously “rounded up” all the way to 2 stars. Valerie’s 0.83 points generated 1.5 stars, even though the point total was closer to the 1-star mark.

Table 3: Examples of Overall rating calculations

Ohio report card - overall calc blog table 3
Note: The table displays the points earned for each component—not the star ratings. The note below Table 2 has details about the points system.

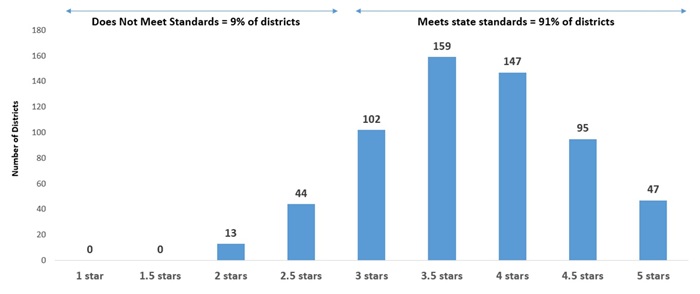
The lenient grading system gives schools statewide a roughly half-star boost. As Figure 2 shows, far more districts received top marks last year than low ratings. In fact, not a single district received 1 or 1.5 stars. The chart also indicates that 91 percent of districts received an Overall rating of 3 stars or above, which state law interprets as “meeting or exceeding state standards,” while just 9 percent of districts received less than 3 stars.

Figure 2: District-level Overall ratings, 2024–25

Ohio report card - overall calc blog figure 2

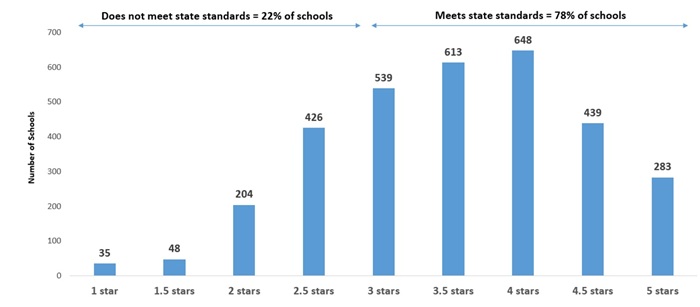
At a school level, Figure 3 shows that 78 percent of Ohio schools received 3 stars or above versus 22 percent below that mark. Just 2.5 percent of schools received an Overall rating of 1 or 1.5 stars. Roughly one third of the low-rated schools were early elementary schools for which the more conventional Achievement and Progress ratings did not apply.

Figure 3: School-level Overall ratings, 2024–25

Ohio report card - overall calc blog figure 3

Raising the bar

Much like inflating student grades is not a “victimless crime,” taking it easy on schools also hides the truth from parents and the public. Ohio’s Overall rating system deems 9 in 10 districts as “meeting state standards,” a rate that is out-of-touch when only 6 in 10 students achieve proficiency on state exams and many have struggled to recover academically post-Covid. Softened ratings also allow low-performing districts and schools to escape public scrutiny and accountability from local communities. For instance, Lorain and Dayton school districts registered abysmal proficiency rates of 25 and 27 percent, respectively, and demonstrated no evidence of academic progress last year. Yet both received 2 stars Overall—a semi-decent rating that papers over students’ academic challenges and the ineffective instruction they receive from their schools. Without a red flag, few community members will likely be stirred to ask questions or push for improvements. Parents may be lulled into thinking their child’s district or school is satisfactory when superior options are at hand.

Ohio needs to bring its Overall ratings back to reality. The simplest approach is revising the grading scale, which the Ohio Department of Education and Workforce can modify through administrative rule. Table 4 shows a straightforward option that would raise performance benchmarks and alleviate some inflationary pressure. Under this framework, 4.5 to 5.0 points would be needed to earn an Overall 5-star rating, 4.0 to 4.5 points would generate 4.5 stars, and so forth. This grading scale would more tightly align component ratings with the Overall star ratings, while also removing the artificial bump that schools systematically receive. For instance, under the proposed framework, Valerie would have received 1 star and Lima 1.5 stars Overall—marks that are more consistent with their underlying component ratings.

Table 4: Proposed change to the Overall grading scale

Ohio report card - overall calc blog table 4

The Overall rating is the most important and visible way that Ohio communicates school quality to parents and the general public. Schools that merit solid Overall ratings should receive them, and failing schools should be clearly identified as needing significant help. Unfortunately, the state’s current method for producing its summative rating misses the mark. Ohio policymakers need to recalibrate the Overall grading scale to give parents and communities an honest bottom-line assessment of school and student performance.

view
Youth apprenticeships blog image

Indiana shows Ohio how to champion youth apprenticeships

Jessica Poiner
3.2.2026
Ohio Gadfly Daily

One of the hallmarks of a high-quality career pathway is work-based learning (WBL). Defined as a coordinated sequence of experiences that provide students with hands-on education in the “real” world, WBL opportunities are sort of like putting training wheels on a bike—kids get a taste of what it’s like to work in a specific career, but they do so with extra support and under the watchful eye of someone who’s already mastered the skills.

In Ohio, WBL options include internships, apprenticeships or pre-apprenticeships, simulated work environments, and entrepreneurship. Which of these is best for an individual student depends on a variety of factors. But apprenticeships are arguably the most intriguing, as they are earn-and-learn opportunities. They offer students the chance to explore a career, develop soft and industry-specific skills, and receive mentorship from experienced professionals, all while getting paid. They often culminate in industry-recognized credentials or postsecondary credit. And they benefit employers, too; they can help build a stronger, more diverse talent pipeline, reduce employee turnover, and offer a return on investment.

Although it has a solid structure for adults, Ohio has some work to do on youth apprenticeships. Most students and families don’t even realize they’re an option. Those that do often discover that meaningful opportunities aren’t available in their region or career field. If Ohio wants to capitalize on the potential of apprenticeships, it needs to do better.

Indiana shows us how. The Hoosier State’s Modern Apprenticeship Program (MAP) connects high school juniors in central Indiana with paid, real-world work experience in high-demand industries. Because MAP aims to prepare students for “sustainable employment,” it focuses on industries that drive the local economy—advanced manufacturing, business operations, the construction trades, education, financial services, healthcare, and information technology. The program, which is year-round and occurs during and after school, is open to all students who are on-track to graduate and doesn’t require any previous experience.

Although there is no financial cost for students to participate, MAP does require a three-year time commitment. In the first year, students typically take classes at school in the morning and then work 10–16 hours a week at their apprenticeship. During the second year—a student’s senior year of high school—apprenticeship time increases to 20–24 hours a week. In their third year, once they’ve graduated from high school, students have three options:

  1. Attend a local college full-time and work part-time with their employer.

  2. Attend a local college part-time and work full-time with their employer.

  3. Work full-time with their employer and continue working on an industry-recognized certification or credential.

According to EmployIndy, the workforce intermediary that oversees MAP, the program recently totaled 152 apprentices across 53 employers. Approximately 91 percent of apprentices stay with their employer after completing the program. And for every $1 they invest, employers see an average return of $1.47. Participating students receive classroom and on-the-job training, mentorship, and valuable experience, all while earning money (pay starts at $13 an hour and increases incrementally) and getting a head start on college or career. Moreover, because the program focuses on employers that drive the local economy, the broader community benefits, as well.

In short, MAP is proving beneficial for everyone involved. Given its success, Ohio leaders should be eager to establish a similar program here. The good news is that going all-in on high school apprenticeships won’t require reinventing the wheel. In fact, Ohio already has a blueprint courtesy of its High School Tech internship program, which was launched by the governor’s Office of Workforce Transformation (OWT) in 2021. As part of this initiative, employers who hire high school interns in tech-related roles can be reimbursed up to 75 percent of intern wages, with a cap at $5,000 per intern. The program is administered by competitively selected regional intermediaries that are responsible for conducting outreach to businesses and educational entities as well as recruiting, interviewing, and placing interns.

Apprenticeships—especially MAP’s three-year program—are a lot more in-depth and time-intensive than Ohio’s internship program, which employs students just for a summer. In fact, that’s likely why MAP’s participation number is relatively small in comparison (152 apprentices in Indiana compared to nearly 1,000 interns in Ohio during the summer of 2024). And unlike the High School Tech internship, MAP is a regional program, not a statewide one. But both programs are run by regionally-focused intermediaries. And while they differ in how much time and effort they require from students and employers—and how much planning and support they’ll need to get off the ground—they’re both valuable investments in students and communities. 

The ultimate goal of career-connected learning is to provide students with pathways that offer a combination of rigorous academics and high-quality training that leads to a stable, well-paying job. Apprenticeships are a key part of accomplishing that goal, and Indiana has provided Ohio with an excellent roadmap. Here’s hoping Ohio leaders seize the opportunity.

view
Senate Bill 19 testimony image

Proponent testimony on Ohio Senate Bill 19

Chad L. Aldis
2.24.2026
Ohio Gadfly Daily

Note: Today, the Ohio House Education Committee heard testimony on Senate Bill 19. The bill proposes a wide-ranging overhaul of math education in the state—from requiring math improvement plans for students at risk of failure to making sure that future math teachers pass content exams before starting in the classroom—in order to address an ongoing achievement crisis. Fordham’s Vice President for Ohio Policy provided the following proponent testimony on the bill.

I want to start by thanking Chair Fowler Arthur both for putting this legislation before the committee and for recent public comments recognizing the importance of students being competent in both reading and math. While Ohio has admirably worked on improving students’ ability to read, the math achievement of students continues to fall below pre-pandemic levels. And let’s be honest, it wasn’t exactly great pre-pandemic.

Before I argue why this legislation is critical and talk about its high points, I want to emphasize that this bill passed the Senate unanimously. For too many education bills, that isn’t the case. Of note, the bill had seven committee hearings and—in my review of committee agendas—faced no opposition testimony.

The Scope of Ohio’s Math Challenge

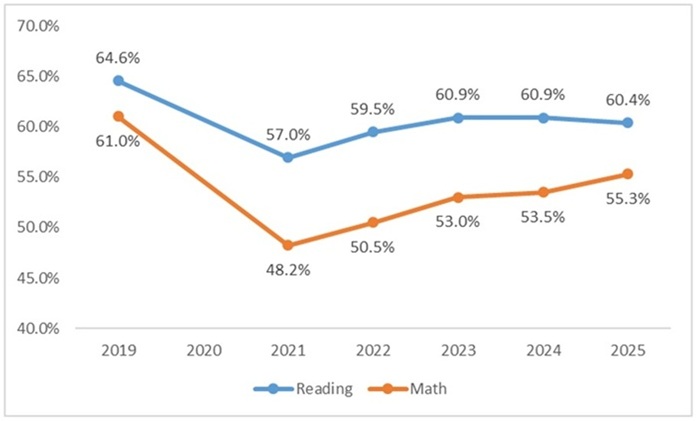
Despite recent academic gains, Ohio remains well below pre-pandemic achievement in both reading and math. As Fordham’s recent analyses show, math proficiency remains 5.7 percentage points below 2019 levels, with only 55.3 percent of students proficient (on grade level) statewide.

Statewide proficiency rates in math and reading, 2018–19 (pre-pandemic) to 2024–25

Senate Bill 19 testimony figure 1


These gaps aren’t just academic—they’re economic. Employers consistently cite quantitative reasoning and problem-solving as top skills for the modern workforce. Whether a student aspires to be a nurse, electrician, or software developer, math is a gatekeeper to opportunity. Without stronger math achievement, Ohio risks leaving a generation of students—and the state’s economic future—behind.

How Senate Bill 19 Addresses the Crisis

Senate Bill 19 takes a systematic, evidence-based approach to improving math outcomes that—if implemented robustly—has the potential to boost math achievement. It includes:

1. Academic Intervention and Monitoring

The bill requires schools to identify and support students scoring “limited” (the lowest level on state assessments) in math or reading, providing evidence-based interventions at no cost. This includes high-dosage tutoring, extended learning time, and other targeted supports.

2. Math Improvement Plans for Students and Districts

Beginning in the 2026–27 school year, each struggling student must receive a Math Improvement and Monitoring Plan, developed collaboratively with parents and teachers. Additionally, districts where fewer than 51 percent of students score proficient on the third-grade math assessment must create a Math Achievement Improvement Plan, ensuring leadership-level accountability and strategic intervention.

3. Statewide Oversight and Transparency

SB 19 strengthens state oversight by requiring the Department of Education and Workforce (DEW) to audit 5 percent of schools annually, reviewing the quality and fidelity of intervention programs. These findings will appear on public report cards—providing families and taxpayers with greater transparency.

4. High-Quality Math Curriculum and Instructional Materials

In one of the bill’s most significant provisions, DEW will review core math curricula and publish a list of high-quality, standards-aligned instructional materials. Schools’ use of these materials will be publicly reported on state report cards.

5. Strengthening the Teaching Profession

SB 19 recognizes that great instruction begins with great teachers. It calls for new math proficiency assessments for early-grade teacher candidates and state-developed professional development programs focused on evidence-based math instruction. These steps ensure educators have both the content knowledge and tools to deliver high-quality math lessons.

6. Opportunities for Advanced Learners

Finally, the bill opens new doors for high-achieving students by requiring that students who score accomplished or advanced in math on the state assessment be automatically placed in accelerated or Algebra I courses, with a parental opt-out. This provision ensures that excellence is nurtured, not neglected—a crucial step in closing both the lower and upper ends of Ohio’s achievement gaps.

Why This Matters: Ohio’s Path Forward

Ohio has taken strides to improve literacy through the Science of Reading reforms. But as Fordham has repeatedly emphasized, we must now apply that same urgency to math. The bill reflects a clear understanding that strong math achievement is not optional in today’s economy. It is the foundation for innovation, progress, and workforce readiness. Students who can think mathematically will not only succeed in college but also thrive in trades, technology, and countless real-world applications.

Conclusion

In short, Senate Bill 19 is both timely and essential. It creates a coherent, statewide strategy for improving math outcomes—built on evidence, transparency, and accountability. Most importantly, it affirms that every Ohio student, regardless of ZIP code, deserves access to rigorous math instruction and the opportunity to succeed.

Chair Fowler Arthur and members of the Committee, thank you for your leadership in confronting this urgent challenge. The Fordham Institute strongly supports Senate Bill 19, and we urge its swift passage.

view
Students looking at a globe

Global school choice at a glance

Jeff Murray
2.26.2026
Flypaper

School choice has expanded and diversified over the last 30 years. No longer is it just “public vs. private” or even “district vs. charter vs. private.” Today, it increasingly includes options like education savings accounts (ESAs), microschooling, tax-credit programs, a newly-resurgent homeschooling sector, and more. It is also a movement with international variations throughout the countries of the Organization for Economic Co-operation and Development (OECD), as a new report from The National Center on Education and the Economy (NCEE) makes clear.

The report starts with a definition of school choice that’s basic and familiar: Can primary or secondary level students enroll in a school—public or private—outside the school assigned to them based on their residential address? Thirty-seven of the 38 OECD member countries answer yes to this definition in some form, and the one outlier, Greece, seems to have lots of local variety built in to its government-run education system. Not all countries allow choices in every city, province, region, or state—or at every grade level—but the report’s authors consider any choice anywhere in the country as a binary example of “allowing school choice.”

School choice as a general concept is almost universal in the developed world, although the breadth of options varies greatly. Mexico, for example, allows limited public options in certain regions only. The Netherlands, by contrast, has a robust choice infrastructure nationwide, and more than 70 percent of students enroll in private or public schools outside the school assigned to them based on their residential address. Families across Finland have similar options, but only 2 percent of students take advantage of them. The report does not dwell on comparisons of uptake among the various countries, but does note that both supply and demand have been static in most countries over the last decade, with only Australia and the United States seeing an appreciable increase in the share of students utilizing an option not based on residential address, largely due to increases in the supply of options.

Open enrollment in another public school is the most common form of school choice in the OECD, with 36 countries allowing it at some level. This category includes charter schools—defined as “independent public schools that operate under a contract (charter) with an authorizing entity”—if such an option exists in a given country. (Sadly, there are no data provided on which countries allow for such schools.) Thirty-five of those 36 open-enrollment countries also provide government funding to support parents choosing tuition-charging private schools via vouchers or education savings accounts, although three restrict support to non-religious schools only.

The report then goes into a deep dive on four countries—Australia, Chile, The Netherlands, and Sweden—as well as highlighting a number of important facets of education, like curriculum, assessments, and staffing. Among the interesting details: Even in OECD countries that have national curricula, choice schools are often allowed to deviate from the prescribed topics and sequences, though a few require administrative approval for alterations. However, more than half of the OECD members that have national or regional assessments still require all private schools to administer the same exams required of traditional public schools even if their curricula are not the same—a topic still up for debate here in the United States.

The NCEE authors are appreciative of international efforts to deliver educational benefits to students through autonomy, innovation, and competition, even as they express concerns. Among these are making clear and reliable information available to parents on the number, quality, and accessibility of their choices (highlighting Australia’s My School platform as an exemplar) and the potential for school choice to increase racial, ethnic, and socioeconomic segregation. Here, Chile is cited as both troubling case study of a country where such segregation has occurred and as an example of a constructive response to the problem.

The report asserts that NCEE is neither for nor against any aspects of school choice—thus it does not make conclusions or recommendations based on this data snapshot—but that the organization wishes to “inform U.S. leaders, educators, and communities” about the “opportunities and tradeoffs” associated with what are clearly widespread and long-established school choice frameworks in countries around the world, likely because the United States is in a strong growth mode in terms of school choice. In the end, the authors’ attempt to visualize global school choice of the future—such as burgeoning microschools and a new picture of who is homeschooling and why—paints a picture driven most strongly by developments here in the U.S.

SOURCE: “School Choice: A Global Snapshot,” The National Center on Education and the Economy/NCEE (January 2026).

view
OEBTN 2026 SEO image

Ohio Education By the Numbers—2026 Edition

2.24.2026
Report

We welcome you to the ninth edition of the Thomas B. Fordham Institute’s Ohio Education by the Numbers. This guidebook offers policymakers, journalists, and civic and business leaders easy-to-use statistics—sans commentary—about Ohio’s K-12 schools and the students they serve. This edition includes the most recent data available through December 2025, which is primarily data from the 2024-25 school year.

The following tables and charts describe education in Ohio at a high level—they are not an evaluation of state policies or school practices. Nevertheless, a basic understanding of trends, as well as the current status of K-12 education, can help us make more informed decisions about ways to improve education for Ohio students.

Whether you’re a lawmaker, reporter, community or business leader, or a parent or grandparent, this booklet is designed for you. As a readily accessible resource, we hope you’ll find it to be a go-to guide as you discuss education in your community.

You can download a PDF version of the booklet from the button at the right of this page, and you can view these data online at our companion webpage, www.OhioByTheNumbers.com.

As always, we welcome feedback for future editions.

Fordham Logo

© 2026 The Thomas B. Fordham Institute
Privacy Policy
Usage Agreement

National

P.O. Box 110
Burke, VA 22009

202.223.5452

[email protected]

Ohio

P.O. Box 82291
Columbus, OH 43202

614.223.1580

[email protected]

Sponsorship

130 West Second Street, Suite 410
Dayton, Ohio 45402

937.227.3368

[email protected]