
Last month, when the state released data from the 2024–25 school year, the Ohio Department of Education and Workforce’s State Report Card touted the fact that test scores are at five-year highs. It’s true that achievement has risen from the disastrous lows right after the pandemic. Yet the department’s cheery depiction of student performance elides other truths: Achievement remains well below pre-pandemic marks, and achievement gaps remain unacceptably large.
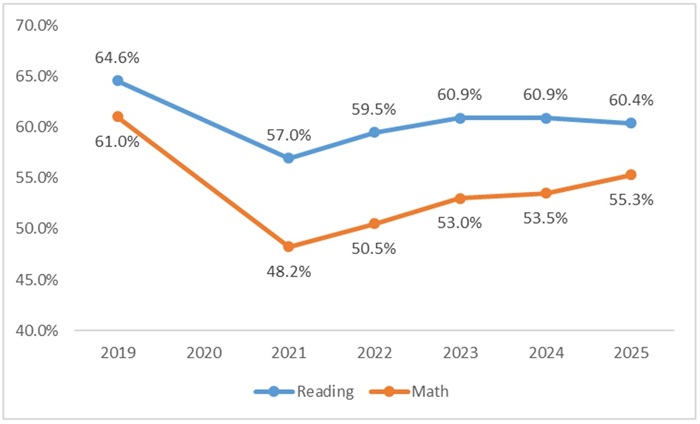
Let’s take a closer look at where student achievement stands—using a pre-pandemic baseline, not just a post-pandemic one. Figure 1 starts with the overall picture, showing statewide math and reading proficiency rates across all state exams (tests and proficiency standards were constant during this timeframe). In reading, proficiency last year was still 4.2 percentage points below the pre-pandemic proficiency rate of 64.6 percent. Math proficiency, despite trending upward over the past few years, continues to lag well behind the pre-pandemic mark. Last year, 55.3 percent of Ohio students achieved math proficiency, 5.7 percentage points below the rate in 2018–19.
Figure 1. Statewide proficiency rates in math and reading, 2018–19 (pre-pandemic) to 2024–25
The uneven “K-shaped” academic recovery, whereby disadvantaged students lost more ground during the pandemic and have made weaker progress since then, has been a much-discussed pattern nationally. Has this happened in Ohio, too? Yes and no.
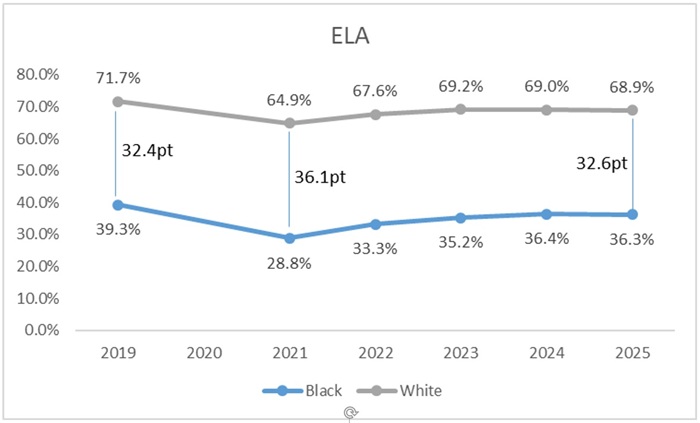
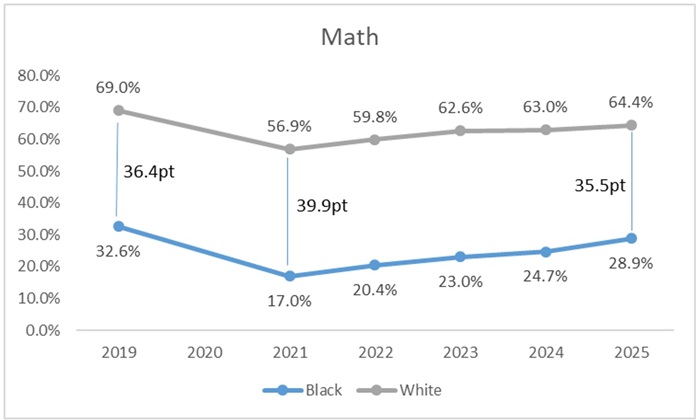
The charts below show proficiency rates for Black and White students, who together represent about four in five Ohio students overall. At a baseline, Ohio struggled with massive achievement gaps prior to the pandemic: In 2018–19, Black students’ proficiency rates lagged 32 and 36 percentage points behind in reading and math, respectively. The gap widened during the pandemic, reflecting prolonged closures, chronic absenteeism, and overall poor educational delivery in urban schools during those years. Since then, Black students’ proficiency rates have risen at a slightly faster clip than White students, which has narrowed the gap relative to 2020–21. That’s a bright spot, especially given concerns about weaker recovery for less advantaged student groups. Nevertheless, fewer Black students achieve proficiency today than Black students pre-pandemic: 36 versus 39 percent in reading and 29 versus 33 percent in math.
Figure 2. The Black-White achievement gap, 2018–19 to 2024–25
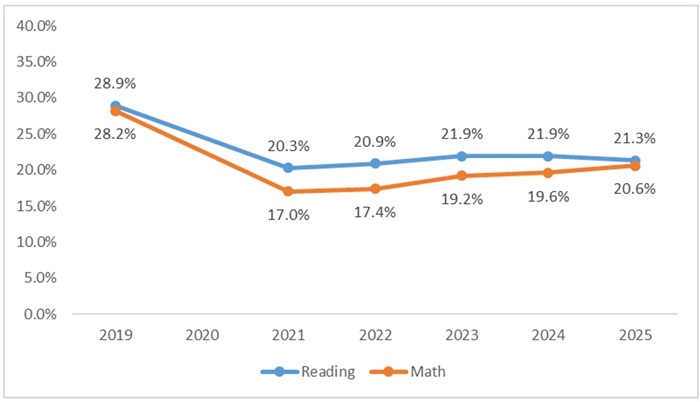
Representing just over 15 percent of Ohio pupils, students with disabilities are another group that experienced substantial declines during the pandemic. But we see almost no recovery in reading and only sluggish progress in math. Proficiency rates for students with disabilities continue to trail far behind the state average (35 to 40 percentage points below), and remain depressed relative to the pre-pandemic proficiency rates of students with disabilities (8 points behind).
Figure 3: Math and reading proficiency rates of students with disabilities, 2018–19 to 2024–25
Achievement gaps between low-income students and their peers are also commonly examined and discussed. However, Ohio’s data on this student group are no longer accurate, as the state now identifies large numbers of middle- and high-income students as “economically disadvantaged” due to changes in federal subsidized meals policy.[1] Proficiency rates for economically disadvantaged students have risen rapidly since the pandemic and now match pre-pandemic levels in reading and nearly do so in math. The gains, however, likely reflect to a large extent the changing—more affluent—composition of the student group.
* * *
Thankfully, schools have returned to in-person learning and their normal routines. Yet the pandemic continues to cast its shadow over the educational outcomes of Ohio students. Five years later—and with billions in federal Covid cash spent—Ohio remains underwater relative to pre-pandemic achievement in math and reading. Achievement gaps are still unacceptably large.
Much ink has been spilled about how to accelerate academic recovery. Proposals include going all-in, as Ohio is doing, on evidence-based reading instruction, giving struggling students more time and interventions (e.g., summer school or high-dosage tutoring), and pushing hard for school attendance. But even these ideas are unlikely to get students entirely back to the pre-pandemic square one—and then some. That will take further initiatives like strengthening accountability measures—such as third-grade retention and state intervention in poor-performing schools—to add urgency to math and reading improvement efforts. It’ll also require policies aimed at dramatically improving math instruction, an issue that Ohio has not yet addressed in a serious way. Bolder moves toward equitable charter school funding would better support the thousands of needy students attending those public schools. And an overhaul of archaic teacher policies that protect incompetent educators (tenure) and fail to reward our best classroom teachers is also needed.
With two in five Ohio students falling short of proficiency, and large majorities of minority and special-needs students struggling in math and reading, it’s hard to put a sunny face on 2024–25 exam results. Yes, there’s been progress since the darkest days of the pandemic. But there is a whole lot more that needs to get done. Let’s get cracking.
[1] In 2018–19, 49.9 percent of Ohio students were deemed economically disadvantaged. In 2024–25, the percentage was 62.1 percent.