Mobile Navigation

  • National
    • Policy
      • High Expectations
      • Quality Choices
      • Personalized Pathways
    • Research
    • Commentary
      • Gadfly Newsletter
      • Flypaper Blog
    • Events
    • Scholars Program
  • Ohio
    • Policy
      • Priorities
      • Media & Testimony
    • Research
    • Commentary
      • Ohio Education Gadfly Biweekly
      • Ohio Gadfly Daily
  • Charter Authorizing
    • Application
    • Sponsored Schools
    • Resources
  • About
    • Mission
    • Board
    • Staff
    • Career
Home
Home
Advancing Educational Excellence

Main Navigation

  • National
  • Ohio
  • Charter Authorizing
  • About

Michael J. Petrilli
9.23.2025
School grade on a chalkboard
Getty Images/marekuliasz
Listen to this article
Loading the Elevenlabs Text to Speech AudioNative Player...

Last week, the Houston Chronicle’s editorial board looked into claims by the Mikes (Mike Miles and Mike Morath) about the many Space City schools going from D’s or F’s to A’s and B’s on the state report card, thanks to the sweeping reforms undertaken in the district. In case you hit the paywall (like I did), let me provide a longish excerpt:

When state-appointed Houston ISD Superintendent Mike Miles told city council members Wednesday that no child walked into an F-rated school, that was great news. And when he added that 70,000 more students walked into A-and B-rated schools this year, that was also great news....

The district has touted big gains in the past without always being transparent about some of the fine print. That seems to be the case here again....

See, in Texas, every public school receives an A–F grade that’s mostly derived from how the students perform on standardized state tests.... But a school can earn an A for tremendous year-over-year growth, even if the overall scores are still below average. Which seems to be the case for Valley West Elementary, a largely Hispanic and Black school in southwest Houston, which went from an F to an A in a single year....

Even though Valley West earned an A for academic progress, its actual test scores only earned a C, or 74 out of 100.

Just fewer than half of third graders were reading on or above grade level, according to the test’s scoring. And only 35 percent of third graders were performing on grade level in math.

If you can read the whole article, you’ll see that the Chronicle appears to be confused about how growth is calculated (it’s at the student level, not with year-over-year gains in proficiency rates by schools).

Still, the editorial reflects a real concern that I’ve heard time and again from many reformers. Namely, that by focusing mostly on growth, we end up praising schools with very low proficiency rates, like Valley West, with its 35 percent proficiency in third grade math.

I don’t mind that because I understand that growth, done right, is the fairest measure of a school’s effectiveness. By controlling for students’ prior achievement, growth metrics like “value-added” can focus entirely on what’s under schools’ control—rather than what might have happened before kids got to them. This is why the best growth measures show little to no relationship with students’ socioeconomic demographics, whereas achievement measures are highly correlated with those background characteristics.

But life is full of trade-offs, and we can’t get around them here. Either we’re willing to celebrate schools that boast high growth but low achievement, or we tell high poverty schools that they have no chance of getting A grades no matter how amazing they do at helping kids make progress from one year to the next. A middle school whose sixth graders enter at the third-grade level can help them make two years of progress over the course of just one year, but when those kids are seventh graders, they will still be below grade level and far below proficiency. But that middle school is doing a fantastic job!

If we’re going to rate schools—and keep in mind that the majority of states, and all but two blue states, don’t, at least not with A–F or five-star rating systems—we have four choices, as I see it:

  1. We embrace the Texas model, give every school one grade for achievement and another grade for growth, and then use the higher of the two grades as their final, official grade.

  2. We turn Texas’ model on its head by giving every school grades for achievement and growth, but then use the lower of the two grades as the final, official grade. To get an A, schools would have to crush on achievement and growth.

  3. We smoosh grades together by giving every school grades for achievement and growth (and perhaps other factors, as well), and then blend them all together into a final grade. This is how Ohio’s five-star ratings system works.

  4. We skip the overall rating and just give schools a grade for achievement and a grade for growth—and leave it at that. (I’m not aware of any state going this route. Are you?)

Depending on our choice, Valley West could get an A (option #1), a B (option #3), or a C (option #2). Or an A and a C (option #4).

I find option #1 to be most appealing. It motivates high-poverty schools by indicating to them that they can earn an A with a strong showing on growth, while also rewarding high-achievement schools (which tend to be found in the affluent suburbs). It focuses states’ attention on the truly bad schools, the “Double F’s.”

But yes, it means giving A grades to some schools with very few kids reading or doing math on grade level. I’m OK with that. Are you?

Which option do you find most compelling? Are there others I’m not considering? Please weigh in!

Policy Priority:
High Expectations
Topics:
Accountability & Testing
Curriculum & Instruction
Governance
Jessica Poiner
9.22.2025
Early literacy RCs blog image
Getty Images/Ayman-Alakhras
Listen to this article
Loading the Elevenlabs Text to Speech AudioNative Player...

It’s been a little over two years since Ohio policymakers established a statewide initiative championing the science of reading, an evidence-based instructional approach that focuses on phonics and knowledge-building. Under this policy, public schools are required to use state-approved high-quality instructional materials (HQIM) and teachers and administrators must complete professional development. The state budget passed just a few months ago built on these efforts by continuing to fund literacy coaches and requiring the Department of Education and Workforce (DEW) to maintain and expand its professional development offerings.

Here at Fordham, we’ve been keeping a close eye on a variety of success indicators to track the progress of this sweeping effort. Recently released state report cards for the 2024–25 school year offer our first in-depth look at student achievement under these policies. But before we dig into the data, here are some important reminders about why it’s far too early to make any sweeping judgments.

First, this initiative is a huge undertaking. And as the saying goes, Rome wasn’t built in a day. Progress (or lack thereof) during the first official year of implementation shouldn’t be used to judge the success or failure of such a complex policy. The science of reading is a long-term investment in our schools and students’ futures, and patience—combined with a strong sense of urgency—is required. Remember also that a one-year change in proficiency rates doesn’t make for a trend. We won’t be able to understand the true impacts of this effort until we have a few more years of data.

Second, the science of reading largely focuses on Ohio’s youngest learners. The students who will benefit from these changes are currently in preschool, kindergarten, and first grade—but state testing doesn’t begin until third. Ohio’s “improving K–3 literacy” measure sheds some light on growth among early elementary students (more on that below), but for the most part, report card data won’t include impacted students for another few years.

Third, the 2024–25 school year was one of transition, during which plenty of districts were still working out science of reading implementation kinks. For example, according to a report given by DEW officials at a public meeting this summer, 82 percent of districts reported that they were fully aligned to the state’s HQIM expectations by June 15. That means one in every five weren’t fully aligned. (To its credit, DEW plans to audit districts and schools this year to verify their alignment.) Professional development is similar. State lawmakers required all current educators to complete a professional development course in the science of reading, but the deadline wasn’t until June 30, 2025. In other words, although science of reading implementation officially began last year, in reality, it was more of a transition period.

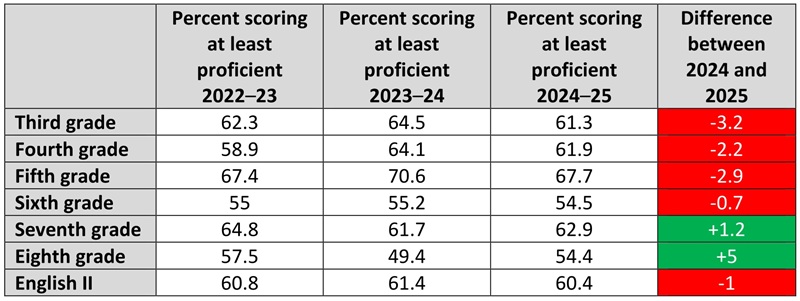
Even with these caveats, it’s crucial to closely examine report card data. To begin, let’s take a look at statewide results. Chart 1 shows the number of students who scored proficient or above on the state’s English language arts exams. In the final column, which identifies the difference between 2024 and 2025 results, green shading indicates improvement and red indicates a decline. Only two grades—seventh and eighth—saw an increase in the percentage of students who scored at least proficient. Every other grade saw a decrease, with the steepest drop coming for third graders.

Chart 1. Percentage of students scoring at least proficient on English language arts state tests

Early literacy RCs blog chart 1

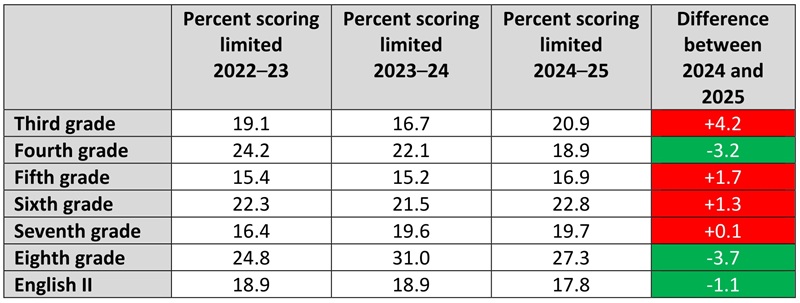
Tracking proficiency numbers will help state leaders measure progress. But identifying how many students score in the lowest achievement level, or “limited,” is also crucial, as declining numbers there would indicate progress as well. Chart 2 identifies the number of students in grades 3–8 and high school who scored limited during the last three school years. The final column identifies the difference between 2024 and 2025 results, with green shading indicating improvement (fewer students scoring limited) and red shading indicating a regression (more students scoring limited). Unfortunately, only three grade levels—fourth, eighth, and the high school English II exam—registered fewer limited scorers than the prior year. Every other grade saw an increase. The highest jump in limited scorers was in third grade, with an increase of more than 4 percentage points. Together, the data in charts 1 and 2 paint a worrisome picture for the make-or-break year of third grade, as fewer students scored proficient and more scored limited.

Chart 2. Percentage of students scoring limited on English language arts state tests

Early literacy RCs blog chart 2

Given that Ohio’s science of reading effort is a statewide initiative, it’s important to track statewide results. But state numbers can mask improvement (or lack thereof) in individual districts. The report card’s early literacy component allows us to dig deeper. For the sake of narrowed focus, let’s consider results from the Ohio Eight, a group of eight urban districts with a long history of poor performance. We’ll also add Lorain and East Cleveland to the mix, since they spent several years under the oversight of now-defanged Academic Distress Commissions. (So did Youngstown, which is one of the Ohio Eight.) Together, these ten districts serve nearly 187,000 students—more than a tenth of the state’s public-school population—and are among those most in need of early literacy improvement.

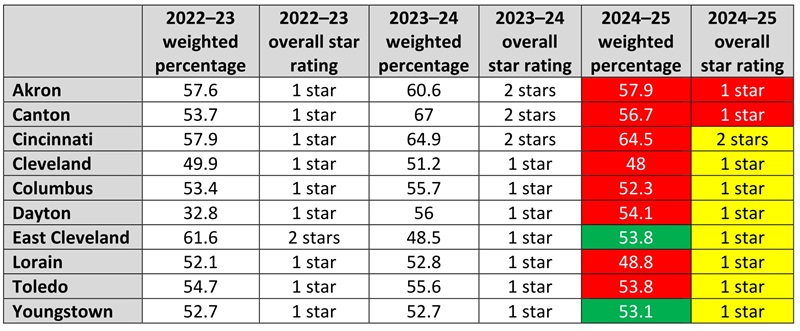
First, let’s look at how they performed overall on the early literacy component. Chart 3 displays two data points—districts’ star ratings on the component and the weighted percentage that determined those ratings. This percentage is based on three measures: third-grade reading proficiency rates, third-to-fourth grade promotional rates, and the percentage of off-track readers who move to on-track status in the following year. Districts with a weighted component percent of less than 58 earned one out of five stars while those with a weighted component percent from 58 to less than 68 earned two stars. In the columns dedicated to the most recent school year, green shading indicates improvement from the prior year, yellow indicates results that remained flat, and red indicates a decline.

Chart 3. Overall early literacy results on state report cards in selected districts

Early literacy RCs blog chart 3

Cincinnati was the highest performer of these districts and the only one to earn two stars. Its weighted percentage did decline between 2024 and 2025, but the drop was small enough that it did not impact its rating. The lowest performers were Cleveland, which earned a weighted percentage of 48, and Lorain, with a 48.8. Just two districts earned a higher weighted percentage than they did the prior year: East Cleveland and Youngstown. East Cleveland improved by 5.3 percentage points, while Youngstown eked out a gain of less than half a percentage point.

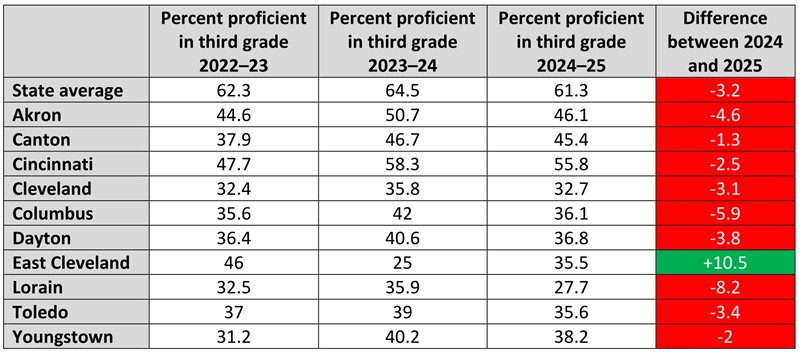
Next, let’s take a closer look at one of the early literacy component’s three measures: third grade reading proficiency. Chart 4 displays the percentage of students who scored proficient on the reading segment of the ELA exam, as well as the statewide third grade proficiency average.[1] The final column identifies improvement between 2024 and 2025 with green shading and a decline with red.

Chart 4. Percentage of third graders scoring proficient on the reading segment of state ELA exam in selected districts

Early literacy RCs blog chart 4

The only district that improved was East Cleveland, with a sizable jump of more than 10 percentage points. Considering East Cleveland had the worst proficiency rate of these districts in 2024—an abysmal 25 percent—that’s good news. Meanwhile, in the nine districts that regressed, the decline ranged from 1.3 percentage points in Canton to a whopping 8.2 percentage points in Lorain. That puts Lorain’s third grade proficiency rate at just under 28 percent, making it the only district in the group where fewer than a third of third graders were proficient (although Cleveland, the next lowest performer, only meets that threshold via rounding). It’s also worth noting that almost all of these districts are considerably behind the state average, with the difference ranging from 15.2 to 33.6 percentage points. Cincinnati had the smallest gap and is just 5.5 percentage points behind the state average.

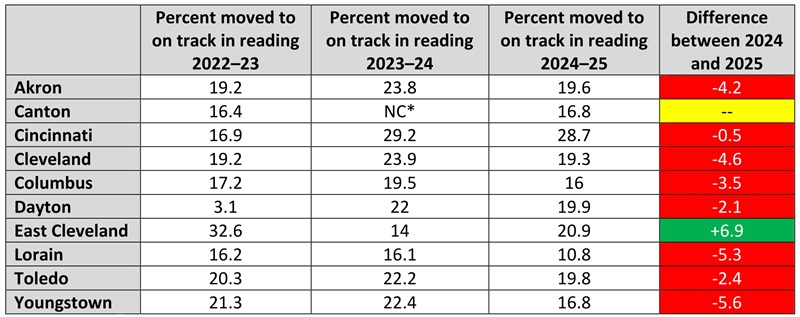
Lastly, let’s take a look at progress. DEW tracks district progress via the “improving K–3 literacy” measure, which uses the results of fall diagnostic assessments to determine the percentage of students who move from “not on track” to “on track” in reading from one year to the next. These results indicate how well schools are improving K–3 literacy throughout all the early grades, not just third. By doing so, the measure identifies schools and districts that are making critical progress with struggling readers. Chart 5 displays the overall percentage of students that each district moved to on track in reading during the three most recent school years, as well as the difference between 2024 and 2025 results, with green shading indicating improvement and red a decline. Canton, which is shaded in yellow, is a unique case, as its kindergarten data for the 2023–24 school year were misstated on its report card.

Chart 5. Results for the improving K–3 literacy measure on state report cards in selected districts

Early literacy RCs blog chart 5
*The improving K–3 literacy measure is “NC,” or not calculated, if more than 90 percent of kindergarten students are on-track.

Unfortunately, there’s very little progress to celebrate. Only one district—East Cleveland—showed improvement. But it did so with a sizable jump of nearly 7 percentage points that catapulted it from the worst of these districts in 2024 to second among them in 2025. There’s still a lot of work to be done, but improved results in both progress and proficiency should be welcome news in East Cleveland.

The other nine districts didn’t fare as well. The percentage of students who were moved to on track in reading declined across the board, with drops ranging from half a percentage point in Cincinnati to 5.3 percentage points in Lorain. The decline in Lorain means the district managed to move just 10 percent of its students to on track in reading. That’s not just the lowest percentage among these districts, it’s the lowest in the entire state. Lorain’s third grade proficiency rate, meanwhile, was the second lowest in the state. Such abysmal numbers should prompt some pointed questions for lawmakers, who voted to give the district a free pass by dissolving its Academic Distress Commission and its state-mandated academic improvement plan. Clearly, Lorain hasn’t improved much in terms of early literacy. In fact, the district is moving backwards.

***

This latest round of state report cards clearly demonstrate that Ohio districts and schools have their work cut out for them when it comes to boosting reading outcomes. But with the state’s science of reading initiative, they have evidence-based tools that should help over the long haul. Now that last year’s transition period is in the rearview, it’s time to look ahead—and put the pedal to the metal!


[1] The statewide results are for the entire third grade English language arts exam, which includes writing, and not just the reading segment.

Policy Priority:
Standards & Accountability
Topics:
Accountability & Testing
Jeff Murray
9.22.2025
Gadfly Bites logo
Listen to this article
Loading the Elevenlabs Text to Speech AudioNative Player...

News stories featured in Gadfly Bites may require a paid subscription to read in full. Just sayin’.

  1. Let’s start today’s clips on the low end of the scale re: newly-released state report cards. TV news in Cleveland is focusing on the I Promise School in Akron, which earned a low Performance Index score, very low test scores, and some of the worst proficiency rates in the state for its students in both English and math. Fordham’s Jessica Poiner, a northeast Ohio native who has written extensively about I Promise’s genesis and evolution, is quoted and linked throughout this piece, but the key for me is the statement from Akron City Schools that has a whole lot of information deflection about why things have not improved given all the money, personnel, and supports poured into the school. (Fox 8 News, Cleveland, 9/18/25)

  2. Jessica has also been keeping close tabs on East Cleveland City Schools, once one of the worst-performing districts in the state and one of just two still subject to an Academic Distress Commission…nominally. Her past work is not quoted in here, but I’m sure she’ll be digging into the data again soon enough. Because things appear to be looking up for the district, and its leader has lots of information (compare to the above “information” provided by Akron City Schools) on how he believes he and his team were able to move up from 2 stars to 3 stars overall. (Cleveland.com, 9/21/25)

  3. Back on the low end again, Fordham’s Aaron Churchill is among the voices discussing the disappointing data on reading achievement statewide in this piece. Math achievement is a little better, but I’m not sure we should be cheering about this information just yet. (Dayton Daily News, 9/21/25)

  4. Let’s end today’s clips on the higher end of the report card scale. The folks at Parma City Schools are celebrating a rise from 3.5 stars to 4 stars this year and while early literacy remains a low-scoring sore spot for them, they too have a lot of information about how they achieved their boost and how they plan to continue their rise. (Cleveland.com, 9/22/25)

Did you know you can have every edition of Gadfly Bites sent directly to your Inbox? Subscribe by clicking here.

Policy Priority:
School Funding
Topics:
Governance
Jeff Murray
9.19.2025
Ohio charter news logo
Listen to this article
Loading the Elevenlabs Text to Speech AudioNative Player...

Stories featured in Ohio Charter News Weekly may require a paid subscription to read in full.

News to Newsweek

Newsweek has, it seems, just discovered the existence of charter schools and spent a couple thousand words introducing them to readers this week. They call the growth of the sector a “slow rise”, which is probably fair, but they also lean warily into the fact that charters are expanding nationwide and student enrollment has been on a faster clip in recent years. Not a bad introduction, overall, and far preferable to the misinformation we have been used to receiving via national sources.

Marching for charters

No lack of charter knowledge in New York City, where thousands of parents, students, and educators (representing more than 200 schools) marched across the Brooklyn Bridge yesterday to promote charter excellence and to demand more equitable funding for their schools. The timing of the event is not coincidental, as mayoral candidates in the Big Apple have been staking out their positions recently—both for and against charter schools—ahead of the November election.

Emulate Indiana

Speaking of equitable funding for charters, Fordham’s Aaron Churchill this week looked at changes in school funding in Indiana designed to bring district and charter resources into near-parity. He calls it “path-breaking”, especially because it attempts to send both state and local funding to the schools students actually attend, and he urges Ohio to move toward such a system using Hoosier State efforts as a template.

Still arguing in Kentucky

Meanwhile, charter opponents in Kentucky pled their case this week before the state Supreme Court, arguing that a state law allowing funding for charter schools is unconstitutional on the grounds that it “redirect[s] public school money, public funds, to schools operating outside the common school system without the approval of Kentucky’s voters.” There is no timeline for a ruling, thus prolonging the nearly decade-long stalemate that has persisted since the Bluegrass State’s charter statute was signed into law in 2017. No schools have yet opened as a result of ongoing legal action around the funding question, but this court hearing is a tiny lurch toward a resolution.

One more

While charter school supporters in Missouri are pleased that recent legislation finally allowed charters to operate in the city of Columbia—bringing the total of cities to three—the Director of Education Policy at The Show-Me Institute recently opined that at least one other large city also needs to be granted that permission. Families in Springfield also deserve more and better options, says Cory Koedel, and research shows that charter schools help their students succeed.

*****

Did you know you can have every edition of the Ohio Charter News Weekly sent directly to your Inbox? Subscribe by clicking here.

Policy Priority:
School Choice
Topics:
Charter Schools
Jeff Murray
9.19.2025
Gadfly Bites logo
Listen to this article
Loading the Elevenlabs Text to Speech AudioNative Player...

News stories featured in Gadfly Bites may require a paid subscription to read in full. Just sayin’.

  1. More report card coverage means more Aaron Churchill quotes. So let’s bring ‘em on! Here he’s parsing both reading (down) and math (up) achievement results. “Reading generally did not fall as much [last year as] during the pandemic,” he said, suggesting that teachers and schools are still getting used to new science-of-reading curriculum and pacing and needing a bit more time to get it all down pat. “We have seen more robust recovery in math. But that’s against a larger dip that we had in the pandemic,” adding that “One year doesn’t make a long-term trend.” Pragmatic and wise. “We need to preach some patience.” (Cleveland.com, 9/17/25)

  2. Blog posts from both Aaron Churchill and Jessica Poiner are quoted and linked in this great piece on what is termed the “chaos” of industry-recognized credentials in Ohio’s schools. Sadly, the correct term is probably “fraudulosity” or “trickuliciousness” (if we're trying to be nice about it) because it seems pretty clear from my colleagues (and many others interviewed here) as well as the hard data that schools and districts across the state are spending a lot of time and effort to get students to earn credentials as a path to high school graduation without regard to whether the skills they represent—and they do represent skills achieved, don’t get me wrong—are of any practical value in the job market into which those graduates are emerging. I feel it’s pretty clear that a majority of them are valueless, and that adults pushing kids into them know this to be true. If so, it’s not “chaos” that’s happening, but something much worse than that, whatever you want to call it. (The 74, 9/18/25)

  3. The former superintendent of Cincinnati City Schools opined doomily this week that “America’s schools are in historic turbulence” and must be fixed ASAP. This is not just her opinion; she shares it with the 200 current school district leaders she surveyed over the summer. “Their message was clear,” she says: “They are exhausted, anxious, and deeply concerned for our students’ futures. They identified five urgent challenges − and paths forward.” You will likely not be surprised to find out that poor academic achievement of students is barely clinging on at number 5 on the list (and characterized as “The Silent Emergency”, as if no one has been screaming it from the rooftops for years). You will be even less surprised to find out that the number one solution to all of these problems is Send More Money. I don’t know how much she was paid to come up with those findings, or indeed who footed the bill. Probably a lot. Personally, I could have gotten the same results for them for the price of 18 holes at General Custer’s. (Cincinnati Enquirer, 9/16/25)

  4. The data used here are pretty old, but lawyer and podcaster Jack D’Aurora insists in this op-ed that student academic success clearly isn’t about the amount of money being spent—using Upper Arlington, Columbus, and Steubenville school districts as evidence—but about how (and how well) the dollars are used. I’ll leave you to read it and see if he’s truly making the points he thinks he is, but I will say I feel bad for the folks who run Steubenville City Schools for always being “the exemplar” in education discourse today…no matter what the point is or who’s trying to make it. That intense wattage of limelight cannot be a positive experience. (Columbus Dispatch, 9/18/25)

Did you know you can have every edition of Gadfly Bites sent directly to your Inbox? Subscribe by clicking here.

Policy Priority:
School Funding
Topics:
Governance
Teresa Eliopoulos
9.18.2025
Students raising their hands in a school classroom
Getty Images/Jacob Wackerhausen
Listen to this article
Loading the Elevenlabs Text to Speech AudioNative Player...

From my experiences supporting districts to choose and use high-quality instructional materials (HQIM), I’ve seen that curriculum selection often breaks down where it matters the most: in classrooms. So I was fascinated to read educator Brian Wong’s firsthand account of his school’s math adoption. One section in particular stood out:

When my co-teacher and I first started teaching the curriculum, we received a two-hour Zoom training, and then we were sent on our way. The training is supplemented with coaches, but they are stretched thin among New York City’s many math teachers.

The good news is that Wong and his colleagues persisted with the curriculum, collaborating to figure out how to leverage it for the benefit of their students. The bad news is twofold. First, Wong recalls, “we made all kinds of preventable mistakes in those early days,” and it took a full school year before the curriculum “started to click.” While some growing pains are inevitable with new materials, better planning and stronger educator supports could have spared a whole student cohort from full exposure to a process of instructional trial and error.

Second, Wong’s limited access to professional learning is all too common, and may even be better than average. In a 2024 survey, only 48 percent of teachers reported receiving professional learning on using instructional materials.

The latest NAEP scores highlight the urgency of improving student outcomes, and quality materials are a key ingredient in this work. But curriculum alone is not enough. Districts must have a comprehensive, strategic adoption process to ensure every student benefits from excellent teaching and learning.

To better understand this challenge, EdReports partnered with The Decision Lab to conduct a nationally representative survey of over 250 district leaders and educators. Our new report, Beyond Selection: Rethinking How Districts Adopt Curriculum, uncovers why district intentions around HQIM often fail to translate into classroom impact—and what can be done about it.

Late-stage challenges often begin early

Our survey shows that districts face their greatest hurdles in the late stages of curriculum adoption. Nearly half of respondents reported challenges with consensus-building (49 percent) and implementation (48 percent), far higher than those who pointed to early-stage tasks like determining needs (13 percent) or narrowing options (14 percent).

This pattern reflects a broader confidence-implementation gap. While 72 percent of district leaders say they feel confident in selecting high-quality instructional materials, only 59 percent have systems to evaluate implementation effectiveness, and just 60 percent pilot curricula before adoption. Strong intentions too often falter without early investments in planning and process design, leading to fractured decision-making, limited buy-in, and stalled implementation later on.

Regulatory and technological pressures add to the strain. Districts identify incompatibility of existing infrastructure with new technology systems as their single greatest challenge, with regulatory compliance a close second. This reflects the ever-increasing complexity of the policy landscape, with 40 states passing “science of reading” laws since 2013.

Finally, we found that leaders are open to targeted support from external partners but prefer to maintain ownership of final adoption decisions. While only 14 percent welcome outside help in making curriculum choices, many seek assistance with data interpretation (55 percent), curriculum evaluation (41 percent), and implementation logistics (40 percent). Districts also value help with communication and process management—highlighting the importance of support that extends beyond curriculum expertise.

Moving toward a stronger adoption process

These findings should prompt state and district leaders to reassess their approach, ensuring coherence from start to finish in curriculum adoption and implementation. Our survey reveals clear opportunities to strengthen districts processes by addressing foundational barriers, designing comprehensive approaches, and strategically leveraging both internal expertise and external support.

1. Establish strong foundations. Given their reported challenges with technology compatibility and regulatory compliance, districts should prioritize mapping requirements, aligning timelines, and ensuring systems are ready before reviews even begin. Rhode Island’s approach—defining HQIM and providing statewide guidance and resources—shows how early clarity can lead to more consistent, successful decisions.

2. Design comprehensive processes. Adoption must be understood as a long-term process, not a single event. Confidence in choosing materials is meaningless if districts fail to plan for piloting, evaluation, and teacher support. Building a clear instructional vision, detailed roadmaps, and professional learning plans from the outset helps connect early choices to classroom impact.

3. Prioritize educator voice and stakeholder consensus. Teachers bring expertise no one else can, and their early involvement is critical for building ownership. At the same time, families and communities need structured opportunities to contribute and understand decisions. Louisiana’s experience illustrates the power of deep engagement: teacher enthusiasm has sustained HQIM use for over a decade.

4. Leverage external expertise strategically. In a resource-constrained environment, selective partnerships can free up district capacity, strengthen communication and stakeholder engagement, and support smoother implementation. Using free, trusted resources such as EdReports’ independent curriculum reviews and adoption resources can free up internal capacity. Further, the most effective external support helps to build local expertise over time, as Rhode Island’s district learning cohorts demonstrate.

When these four elements come together—strong foundations, comprehensive planning, authentic engagement, and strategic support—districts can move toward a curriculum adoption process that delivers on the promise of HQIM: better teaching and stronger outcomes for all students.

Policy Priority:
High Expectations
Topics:
Evidence-Based Learning
Curriculum & Instruction
Governance
Teachers & School Leaders
Michael J. Petrilli
9.18.2025
Serious portrait of a student in a classroom
Getty Images/Yuliia Kaveshnikova
Listen to this article
Loading the Elevenlabs Text to Speech AudioNative Player...

There’s been a lot of smart analysis of the dismal results released last week from the National Assessment of Educational Progress (NAEP)—much of which I’ve highlighted in the last two issues of SCHOOLED, my new Substack newsletter.

But here’s an alarming fact that you probably haven’t seen before: The cohort of students who scored at record-low levels in 12th grade reading were part of the same generation of kids who scored at record-high levels in fourth grade. Let’s see how this looks when we glimpse scores by cohort.

Table 1. Average NAEP scale scores in reading, by cohort

1

* As Andrew Ho pointed out on LinkedIn, Covid knocked NAEP off its normal schedule, so 12th graders were tested in 2024 instead of 2023. It’s the high school graduating class of 2023 that was tested as eighth graders in 2019 and fourth graders in 2015. So I can’t claim that this was the exact same cohort. But for our purposes, it’s close enough.

Sure enough, when the Class of 2023 was in fourth grade, in 2015, they posted the highest average score ever on the reading NAEP (223)—a full ten points ahead of fourth graders in 2000. That equates to about a grade level of progress over the course of just one generation of students. Pretty darn impressive.

Let’s pause on that good news for a moment. What it means is that elementary schools back in the early 2010s were doing a good job teaching reading, or that students in that generation (people who today are about 20 years old) came into school relatively well prepared, or both.

Of course, we know what happened when these folks were about 15 years old, in 2020. The Covid pandemic struck and sent many of them to Zoom School for a year or longer. No wonder their scores fell off a cliff by 12th grade.

But as others, such as Eric Hanushek, have pointed out, it wasn’t just the pandemic. By 2019, this cohort’s eighth grade literacy scores were already showing signs of trouble. Whereas the class of 2023 had the best reading scores ever as fourth graders—two points ahead of second place, the class of 2019—their eighth grade scores were two points lower than those for the class of 2019, for a four-point swing. Given that scores were down just (!) three points in 12th grade, that indicates that much of the damage might have been done by the end of middle school.

(The general patterns look much the same for math, though the class of 2024 can’t boast the best fourth-grade math scores ever; those came in 2013, for the class of 2022.)

The same story emerges if we re-run this analysis for the lowest-performing 10 percent of students, whose recent declines have been particularly dramatic.

Table 2. NAEP scale scores in reading, 10th percentile, by cohort

2

So what happened?

We know that Covid (and school closures) hurt achievement significantly between the time that our recent high school graduates were in eighth grade (2019) and in 12th grade (2023–24).

But we also know that reading achievement for this cohort sputtered between the fourth and eighth grades between 2015 and 2019. What explains that?

The obvious culprit is the rise of smartphones and social media during this period and its impact on motivation, sleep, and the time spent reading for fun. While others, including Harvard’s (and NAGB’s) Marty West, have come to the same conclusion, none of us can prove it.

But let’s assume that, someday, a smart economist publishes a study demonstrating convincingly that phones and social media are to blame. It’s still not obvious what we should do about it. Phone bans can help between 9:00 a.m. and 3:00 p.m., Monday through Friday. But as Mike Goldstein and Sean Geraghty point out, that ignores the real issue—what kids are doing with their devices after school, on the weekends, and especially into the wee hours of the night. Schools can be part of the battle against screens and scrolling, but we’re going to need to engage parents and communities, as well, if we want to get back to the best reading (and math) scores ever.

Author's note: A big thanks to my colleague Jill Hoppe for her help with data collection for this piece.

Policy Priority:
High Expectations
Topics:
Accountability & Testing
Evidence-Based Learning
Curriculum & Instruction
Governance
Teachers & School Leaders
Mike Goldstein Sean Geraghty
9.18.2025
Teenager using a cellphone
Getty Images/ojos de hojalata
Listen to this article
Loading the Elevenlabs Text to Speech AudioNative Player...

Scary NAEP results again.

Harvard Graduate School of Education Academic Dean Marty West writes: “We must search for new explanations and solutions.” But how?

Earlier this year, we wrote:

Education is in a trap. Our field studies daylight behavior—8 a.m. to 3 p.m.—in great detail. Classes are observed, schools are visited, test scores are released. We can describe five different math curricula and how they differ.

But we’re missing the details of what happens after dark: the TikTok binge, the fight over putting the phone away, the slow collapse of homework, the late-night texting and gaming that leads to five hours of sleep, the kid whose executive function is so shot he couldn’t get his homework done if he were in an empty jail cell.

We have the big picture, from data like the American Time Use Survey, which Jonathan Haidt used to great effect.

Parents get tons of (often confident) advice: take phones away, set screen limits, make kids go outside. But when real parents try these interventions, they often fail. We don’t have fine-grained data on this, so we don’t learn why they failed or how frequently.

For Part 2, below, we share three real case studies from the past year. Together, they illustrate what our field is missing: quality “field studies” of teen patterns (how is time “really” spent) and choppy intervention efforts.

Let’s not leap to solve everything! Let’s first examine what’s going on.

Case study 1

Sarah is on her phone most of the night, so when her alarm rings, she struggles to wake up. Mom pleads for her to go to school most mornings—sometimes successfully, sometimes not. Even when she goes, Sarah is late. Not only that, often Mom is late to work after battling Sarah. And once Sarah plops down in the classroom, she is irritable.

Mom read Jonathan Haidt’s Anxious Generation and found it enlightening even though it made her feel like a failure. She’d let Sarah have a phone at age 11. At first, the phone wasn’t so bad. Somewhere along the line, though, there was a tipping point. Now Sarah is always on it.

Mom tried to take the phone back, first through gentle coaxing, then through incentives, then straight up “I’m taking it”—all advice she’s seen on parenting blogs. Sarah’s response was extreme. She left home three times. Mom and Dad would drive, panicked, around their neighborhood looking for her. She was never too far, but each time, Mom gave back the phone. Another time Sarah poured a two-liter bottle of Pepsi on Mom’s bed. Mom was scared. These reactions seemed crazy. She googled “phone addiction treatment,” but when she’d find a place, the Reddit reviews were bad.

Sarah cycled through three therapists over two years. One Sarah didn’t like. Another wouldn’t ever give Mom straight answers about what they were doing in therapy, so Mom moved on. The third seemed to make progress. The phone stayed but at least there was detente in the household. Sarah agreed to try a midnight bedtime and to hand over her phone at 11:30 p.m. to Mom.

A new problem emerged. Sarah would lay there at midnight in good faith but didn’t fall asleep. She tried:

  • No caffeine after 2 p.m., but this did nothing.
  • A weighted blanket, which made her feel trapped and didn’t last more than two nights.
  • Melatonin. It knocked her out but left her groggy, so she discontinued.
  • Dimming the lights an hour before bed. That one, for whatever reason, made a difference. Her Fitbit sleep score rose from 63 to 77 on a typical night.

Obviously, the lesson here is not that teens need light dimmers!

Instead: Most interventions fail, whether initiated by parents or professionals. Trying, failing, adjusting—that’s how you find the things that actually work. Glib explanations to parents probably make things worse, creating false expectations of quick resolution. Sarah may be better rested, but other issues remain.

Case study 2

Alan is a distracted tenth grader. Does he have ADHD? One therapist said no. Another said yes—but Mom wondered if the therapist thought she just wanted medication and extra time on SATs.

They tried Ritalin. His teachers said he behaved better in class, but he said it killed his appetite, so they stopped.

Mom has a solid relationship with Alan. She’ll sit him down at the kitchen table to do homework, and he won’t complain too much. But the second she turns her back, he switches to another tab in his browser to chat on Discord. It doesn’t even seem willful—almost automatic, he says, before he even realizes what he’s done.

She’s tried to have him just work with pencil and paper, but the school assignments are literally all online. Math homework, for example, is “Delta Math.” There’s no book.

Alan, on Zoom, comes off as confident and charming. “I can pull up those grades,” he says. “I don’t really need help. This is just Mom overreacting.” He does have high scores on state standardized tests.

Even when Alan does sit down in good faith to get started at 7 p.m., it’s not perfectly clear what homework is due. One night, an executive function coach sat beside him, and it took 27 clicks through Google Classroom to uncover the real list of assignments—which came from six teachers with six different approaches to listing assignments across multiple platforms. Alan hadn’t been lying. He genuinely didn’t know what he was missing, and it took some real detective work to figure it out.

The school recommends Alan show up for afterschool help sessions. But there are two problems. One is he plays sports, and neither he nor Mom wants him to give that up. Two is that the format of the help sessions are not “sit your butt down and get started on the work.” Instead, the sessions are built as if the key problem is comprehension. Teachers say, “Bring me the problems where you’re stuck.” But that’s not Alan’s issue. It’s task initiation and persistence.

The coach tried to experiment alongside Alan:

  • Writing out nightly plans with estimated times and making friendly bets on what would work.
  • Moving from the bedroom back to the kitchen table.
  • Sharing screenshots with Mom so she became the “good cop,” while the coach played the “friendly bad cop.”
  • Chunking big projects. Alan said he “knew” to do that, but alongside the coach, he couldn’t articulate precisely how.

Some things worked and some didn’t. There were setbacks. One night Alan did 60 minutes of English homework and forgot to hit “submit,” a perfect picture of how foggy the process can be.

But over time, Alan got back on track. He even submitted two big papers early (out of character), raised an F in chemistry to a B and a D+ in math to an A. Teachers noticed the change and opened the door for him to make up old work. His relationship with his mom improved.

Excited, Alan was eager to “go it alone” in the fall term. We wish the story here were glorious. Instead, he fell back into old habits.

Why share this? Too often these “intervention stories” are tied up neatly in a bow—and that doesn’t line up with what we see in the 6 p.m.-to-midnight space.

Case study 3

Jon is an 11th grader in foster care. He’s already in his second high school, so friendships haven’t come easily. Still, he’s outgoing and able to find a few guys to hang with. He uses marijuana three or four times a week.

Academically, he’s in the lower track courses—officially called “college prep”—but the rigor is a joke. Most kids copy homework in plain sight of the teacher. Jon sometimes wonders if vocational-technical school would’ve been better, but that ship has sailed.

He gets services through the Department of Social Services—bus passes, help with medical appointments on occasion, weekly sessions with a caseworker. Jon described a mix bag on that. Over the years, the caseworker switched pretty frequently, so he’d have to re-explain his story to a new adult all over again. One therapist tried trauma-focused CBT, walking him through breathing exercises and thought logs, which felt useful in the moment. But he tired of it and says “I should go back to that.” Jon likes the current counselor, but scheduling is choppy. The net effect: Therapy is “on the list” of services he receives from the state, but it rarely stuck long enough to change his day-to-day life.

His foster mom leans on him for yardwork, and he tries to help out. Sports? He tried basketball in ninth grade but didn’t make the junior varsity team, and he ran track one season but didn’t love it.

Jon says what he really wants is a part-time job. He’s applied to 21 restaurants online, but received no calls back. He asked his caseworker, who said, “Keep trying. It’s hard to find jobs.” He asked his foster mom, and she said, “They want experience, and you don’t have any.”

He got paired with a coach, Geordie, who specializes in helping people “stuck” in their job search. First thing Geordie did is ask Jon to walk him through exactly what he’s been doing. Jon pulls up Indeed.com. He clicks through the application, types in his experience (none), and hits submit. “That’s it,” he shrugs.

Geordie explains that online applications rarely work, especially for a first job. You’ve got to go in person. He has Jon practice the basics: what to wear, how to shake hands, what to say. The pitch is simple but crucial: “I’m never on my phone while working, and I show up 15 minutes early.” (Then you actually have to do those two things, if hired.)

Jon told Geordie what his foster mom had said. Geordie: “That’s true to a point. If a manager has two candidates and both seem trustworthy, and one has experience, that’s who gets the job. But often the manager doesn’t have a perfect applicant, so anyone who seems trustworthy can get hired.”

That weekend, Jon tried it. He walked into restaurants, introduced himself, handed over his info face to face. He had two job offers within days.

At one interview, the manager offered shifts: Wednesdays and Thursdays 4–8 p.m., and Saturdays 12–8 p.m.. Jon wanted to say yes, but he realized he had a mandatory appointment at the Department of Social Services many Wednesdays from 4–5, and only recently had that scheduling gotten locked in. His instinct was to turn down the whole job.

Geordie stopped him. “That’s crazy,” he said. “You negotiate.” Together they rehearsed: Jon could propose starting on Wednesday at 5:30 instead, working until 8 or even 9:30. Or he could swap in a Tuesday 4–8 shift.

Jon went back, made the ask, and the boss agreed.

We asked Jon what he stopped doing in order to make room for the 16 hours a week of work. “Mostly scrolling on my phone,” he said. He’s saving up, but not sure for what. He’s working hard, and his foster mom is impressed and tells him so.

Why does this matter?

We (the authors) focus on a broader outcome we call teen flourishing. Jon’s success (a job) probably doesn’t vault his K–12 experience much, but it makes him feel more confident and productive. Sarah’s increased sleep probably does improve her typical morning at school. We care equally about both.

But for the Fordham Institute audience, our dear K–12 systems friends, these three stories reveal what standardized test scores cannot: the intricate web of factors—sleep deprivation, technology addiction, executive function challenges, social isolation, and a new form of lethargy—that shape student outcomes between dismissal and first period. Sarah’s phone battles, Alan’s invisible homework load, and Jon’s job search illuminate why our education debates often miss the mark.

Here’s what we’re saying and not saying:

  • K–12 leaders need better questions. Instead of asking “What curriculum will raise test scores?” or hand-waving about AI tutors for all, we might ask “What’s actually happening in teen students’ lives?” 
  • K–12 leaders need to accept they are not well-positioned to answer these questions. They have too much on their plate and are not succeeding with basic mission of learning, so they should ask someone else to do that. 

For example, U.S. military members suffered a new form of blast injuries in Iraq and Afghanistan from IEDs. DARPA could specify the problem—the physics of blasts, field diagnostics—but not the solutions. They recruited others to come up with rapid advances in diagnosis, mechanisms, and treatment.

That’s what we need here.

We’re not in a situation where “we know what works.” Parents get glib advice that makes things sound too easy. Psychologists give us tiny interventions in controlled settings that don’t mirror real life. K–12 leaders have the political juice to demand better!

We need approaches that work in the messy reality of 6 p.m. to midnight—where progress is slow, setbacks are common, and sometimes the solution is as unexpected as a dimmer switch or a face-to-face conversation with a restaurant manager.

Until we study and address what happens after dark, our high school improvement efforts will continue to fall short.

Policy Priority:
High Expectations
Topics:
Evidence-Based Learning
Curriculum & Instruction
Teachers & School Leaders
Chester E. Finn, Jr.
9.18.2025
American flag in a school classroom
Getty Images/TrongNguyen
Listen to this article
Loading the Elevenlabs Text to Speech AudioNative Player...

Editor's note: This was first published in the “Civic-Ready” issue of NASBE’s State Education Standard.

As the nation’s 250th birthday nears, civics education is once again a hot topic, and deservedly so. It hurts to see how little American young people know about the country’s past, its core principles, and how its governments are designed to work. It hurts more to confront evidence that many appear to be losing faith in democracy itself—a worsening problem as domestic discord and conflicts deepen over the role of government itself.

Education leaders face a heavy lift: The National Assessment of Educational Progress, known as the “Nation’s Report Card,” last tested eighth graders in civics and US history in 2022. The grim results showed just 22 percent reaching “proficient” in civics and a dismal 14 percent attaining that level in history. At the same time, a 2023 survey reflects generational differences in confidence in democracy in general: Just 37 percent of those ages 26–41 strongly agreed that democracy is the best system of government, compared with 62 percent of those ages 58–64 and 75 percent of those older than 77.[1]

Nobody should expect schools to do it all, but they have a clear role when it comes to knowledge and skills and a substantial role when it comes to the formation of attitudes and values. And state education leaders—especially state boards—have a role, too. They must sort through some fervent disputes and make good decisions: on standards, assessment and accountability, as well as incentives for districts’ selection of quality curricula and professional development.

Lively disputes surround what schools should teach and children should learn about how governments work, their own rights and responsibilities, and the attributes of good citizenship in 21st century America. Such disputes typically involve both civics and US history, sometimes the entirety of social studies. They usually center on one or both of these sets of questions:

  • Is America’s saga a tale of success—the creation of sound principles followed by ever-improving implementation—or a sorely flawed story of failures, exclusions, and inequality? Closely related, should lessons in civics (and history) aim to foster patriotism or skepticism regarding one’s own attitude toward the land in which one resides?
  • Should lessons in civics and history concentrate on core information (e.g., how a bill becomes a law, what federalism is, what President Lincoln did) or on attitudes, concepts, and skills? Closely related, should such lessons emphasize what one knows about government or how one participates in it (sometimes termed “knowledge civics versus action civics”)?

These are important differences, to be sure, especially in a time of political polarization, and it is possible they could lead to radically different curricula and instruction in various parts of the land—a “red state civics” and a “blue state civics,” diverging most on topics such as race and gender.

Today’s “culture wars” undoubtedly make the job of teachers and school leaders harder, as they try to navigate conflicting pressures from parents, officials, and interest groups. In more than a dozen states, lawmakers have been seeking to limit what can be discussed in class, even as the airwaves, social media, and official missives signal from Washington that national officials are “cracking down” on topics and practices they do not favor and teachers are reported to be “censoring themselves” to avoid criticism and controversy.[2]

Reasons for Optimism

There is ample reason for concern but no cause to panic. Conflicts like these need not paralyze those seeking to strengthen the teaching and learning of civics and history in 2025, the semiquincentennial year of the Declaration that follows, and the decades thereafter.

Much of the curricular Sturm und Drang in civics and history appears to be the handiwork of a relatively small number of “conflict entrepreneurs” whose daily fare consists of hurling brickbats and stirring up trouble and whose visibility and income are derived from the same. By overwhelming numbers, ordinary Americans agree to a great extent about what schools should teach and children should learn about civics and history.

In February 2025, the University of Southern California’s Dornsife Center for Applied Research in Education reported widespread agreement (71 percent) that US schools are doing a mediocre or poor job of preparing students to be good citizens. But they also found strong, often bipartisan agreement about what schools should teach their pupils in this realm as well as what civics-related activities students should engage in and schools should encourage. Agreement is not total, but it is sufficient for the analysts to conclude that:

Contrary to political rhetoric, there is high overall support—and a recent narrowing of the partisan divide—for students learning civics topics in school. There is high overall and cross-partisan support for students learning about civic education topics through a wide range of instructional activities.[3]

A second source of optimism for civics-education boosters is the emergence in recent years of worthy consensus-seeking efforts at curriculum development. These generally start with the well-founded conviction that the correct response to the “big choice” questions above is some version of “yes, both.” There are several examples:

  • The Educating for American Democracy “roadmap” spans K-12 civics and history. It contains a comprehensive roster of probing questions (but not answers) that students and teachers should grapple with at various grade levels.[4]
  • The Civic Literacy Curriculum developed at Arizona State University starts with the 100-question US naturalization test but goes far beyond it.[5]
  • A model K-12 social studies standards called American Birthright was developed by the conservative-leaning Civics Alliance.[6]
  • The exemplary Advanced Placement course in US Government and Politics, developed by the College Board in collaboration with the National Constitution Center.[7]

In addition, groups such as iCivics, the Bill of Rights Institute, and the Jack Miller Center have amassed sizable collections of resources (including games) to deepen educators and students’ knowledge and understanding of American history and government.

Structural Challenges

These efforts do not resolve all the challenges that await conscientious policymakers who want their schools to help young people grow into good citizens who are well informed, principled, and engaged. But the toughest challenges are not hot arguments and angry politics. They are structural, involving priorities, accumulated negligence, and institutional rigidities. I count six main ones.

Academic Standards. By themselves, standards do not teach anyone anything. Rather, they describe a desired result, usually one grade at a time. They thus serve as a starting point for curricula, assessment, teacher preparation, and more. To quote George Harrison, “If you don’t know where you’re goin’, any road will take you there.”

At least since enactment of No Child Left Behind (NCLB) in 2002, state leaders have taken standards seriously in the federally mandated subjects of reading, math, and science. Civics and history do not typically get the same attention.

My colleagues at the Thomas B. Fordham Institute reviewed state standards for those two subjects in 2021, examining their content, rigor, clarity, and organization. The reviewers gave “honors” grades to civics standards in just 18 states and to US history standards in 17. Only five were “exemplary” in both. Twenty were rated “inadequate.” The authors dinged standards that “[p]rovide overbroad, vague, or otherwise insufficient guidance for curriculum and instruction; omit or seriously underemphasize topics that are essential to informed citizenship and historical comprehension; and make poor use of the early grades or fail to revisit essential content in later grades.”[8]

Standards are malleable—and entirely within the control of state leaders. Several jurisdictions have revised their standards since publication of the Fordham study, and others are working on them. However, changes do not always improve the result.

Instructional Time. The second big challenge is the trivial place those subjects occupy in most states’ curricula and graduation requirements. RAND reported in 2023 that the typical US elementary school devotes just three hours a week to social studies.[9] The Council of Chief State School Officers reported in 2018 that almost half of US school districts had reduced the time given to this subject in the aftermath of NCLB’s failure even to mention it, much less to measure student and school performance in this realm.[10]

Middle schools tend to give one period a day to social studies, but that may also encompass world history (or global studies), geography, economics, state and local history, and perhaps a bit of sociology, psychology, and anthropology. In Maryland, for instance, the state’s sixth- and seventh-grade social studies framework describes it as “a two-year experience in which students employ geographic, economic, civic, and historical tools to understand how big geographic questions link the past to the present.”[11] All worth doing, to be sure, but quite a lot more than US history and civics.

In high school, students are usually required to take such courses as American History and Civics (or American Government)—but just once. Civics often lasts just half a year if there is a separate course at all, although some states require students to pass a civics exam. My team at the Hoover Institution tabulated graduation requirements in civics in 2024:

  • Eight states—Alaska, Delaware, Kansas, Maine, New Jersey, Rhode Island, Vermont, and Wyoming—require neither a civics course nor a civics test.
  • Four states—Idaho, Louisiana, Virginia, and West Virginia—require a full-year civics course and the passing of a standard civics test.
  • Sixteen states require a half-year civics course and passing a civics test.
  • Sixteen states and the District of Columbia require a half- or full-year course but no test.
  • Pennsylvania and Wisconsin have no course requirement but require students to take a civics assessment—although Pennsylvania does not require passing it.[12]

Bear in mind that those half-year and one-year requirements are typically the only civics requirements during a typical high school education, though schools may offer electives such as the AP class “United States Government and Politics.”

Accountability. Few states incorporate civics learning into their assessment and accountability systems for students, teachers, or schools. The main exceptions are the 20 states that require high school pupils to pass a civics test before graduating, although in most of them the passing bar is low and the test deals only with basic knowledge, usually drawn from the naturalization test. As RAND researchers observed:

[S]tudent achievement in social studies remains largely absent from states’ accountability frameworks … and, in the rare cases in which states do factor in social studies achievement, it is weighted at much lower levels than student achievement in other core subjects…. One factor that severely limits states’ ability to include indicators of social studies achievement in their accountability systems is a lack of social studies assessments…. [O]nly a handful of states use a statewide summative assessment in social studies like they do in ELA and math. Typically, states do not assess at all in this subject area…. Furthermore, some of the states that historically assessed students in social studies suspended their assessments because of the COVID-19 pandemic—while retaining test requirements in other subjects—a signal that social studies is seen as a lesser priority.[13]

Teacher Preparation. The fourth challenge is the slipshod preparation of civics instructors, who typically get certified as “elementary” or “middle school social studies” teachers with minimal obligation to have studied civics, American government, or US history, nor any requirement to pass a proficiency test in those fields. One can often elect to major in psychology or sociology while taking few courses in history or American government, emerge with a generic social studies license, and then teach those key subjects.

Unsurprisingly, many teachers report feeling ill prepared. RAND analysts concluded this from a 2020 survey:

We asked teachers to tell us, on a scale from “not prepared at all” to “very well prepared,” how prepared they felt to promote their students’ civic development within their classes. A little more than 60 percent of all teachers indicated they felt “somewhat prepared,” and only 19 percent responded that they felt “very well prepared”.… About one-quarter of all elementary teachers indicated they felt that they were “not prepared” or “not very well prepared” to teach civic development.[14]

Civics Learning Everywhere. Citizenship is not something one learns in a single class. It is shaped by so much that one learns and experiences in school and the rest of one’s life—or fails to experience. Learning in literature, science, and the arts also shapes civics learning, as does what happens on playing fields, in student government, and in other extracurricular pursuits.

Role models also matter greatly: teachers, coaches, neighbors, preachers, team captains, and, of course, parents and family members. If the adult influencers in one’s life seldom vote, do not scrupulously obey laws and rules, seldom engage in civic or neighborhood activities, pay scant attention to current affairs, ignore or berate those who disagree with them, and fail to treat others with civility, even the finest civics class likely cannot compensate. The formal education system must do its part, but it occupies only a portion of childrens’ lives and cannot do it all.

Curriculum. All the solid curricula, frameworks, standards, and supplemental materials for teaching civics and history will not matter if they are not widely used. Surveys show that social studies teachers, especially in the earlier grades but frequently in middle and high schools, too, are scrounging, improvising, and piecing together lessons rather than deploying top-notch curricula for which they have received suitable professional development and ongoing support.[15]

What Should a State Policymaker Do?

State education leaders and policymakers who are serious about civics learning have several powerful levers within their grasp—and even more that they can do by way of leadership and suasion in realms where they are not entirely in charge.

The starting point should be the state’s academic standards, ensuring that these do a solid job of specifying the K-12 system’s desired outcomes in civics and US history. They should be rigorous and content rich. Skills and dispositions matter too, and it is good to give students experience in the real world, possibly via student government or community service.

One may start by checking Fordham’s five-year-old review of the state’s extant standards.[16] Consider the criteria used as well as what the reviewers found and recommended. Perhaps look at the standards of states that aced that review and what can be learned (or borrowed) from them.

Consider the Educating for American Democracy roadmap, which has the makings of exemplary K-12 standards in both subjects, and take a look at the Civic Alliance’s model. Oversimplifying, the former asks the right questions while the latter supplies much factual content that students will need to develop thorough answers to those challenging questions.

When the standards are in good shape, state leaders should ensure that their schools have access to high-quality curricula aligned with the standards. Though local discretion is needed in the touchier elements of these subjects, any state-sanctioned (and paid-for) materials should focus on top-notch content from the earliest elementary grades through high school.

Yet exemplary standards and curricula do not accomplish much unless schools have ample space in their days and years to give these subjects their due, whether in distinctive social studies classes, infusing this content across the curriculum, or both. (There is room within English language arts, for example, for many history and civics topics and examples.)

Nor can this work be accomplished unless states also ensure that schools successfully teach it and students successfully learn it by building civics and history into results-based accountability and report cards for elementary, middle, and high schools. State leaders might also consider an end-of-course exam or something similar for students at least once during the K-12 years. The naturalization test, focused as it is on basic information, is a starting place, but a sophisticated assessment and accountability plan contains much more.

For any of these reforms to succeed, teachers must be well prepared to help their students learn civics and history, which means policymakers—including those responsible for higher education—should review certification and licensure requirements with these subjects in mind. They should also ensure that high-quality professional development is delivered to those already teaching to boost their knowledge and pedagogical skills.[17]

Finally, state leaders would do well both to ensure that ample attention gets paid—in school and out—to the upcoming semiquincentennial of the Declaration of Independence in 2026 and then build on it. View it not as a one-time celebration but as the beginning of a decade in which Americans recall the nation’s founding and its grand if unfinished saga. This renaissance in civics and history education might culminate in the 250th anniversary of that hot Philadelphia summer of 1787 that produced the Constitution. State leaders, as well as educators and students, should bear in mind Benjamin Franklin’s response when asked what sort of government was forged at that time: “A republic,” he said, “if you can keep it.”

Notes

[1] McCourtney Institute for Democracy, “Mood of the Nation: Americans’ Belief in Democracy,” poll, January 18, 2023.

[2] See, e.g, American Historical Association, “Teaching History with Integrity: Freedom to Learn,” web page.

[3] Anna Saavedra et al., “Agreement across the Aisle: Schools Should Prepare Students for the Rights and Responsibilities of Citizenship,” report (University of Southern California, February 2025).

[4] Educating for American Democracy, “Educating for American Democracy: Excellence in History and Civics for All Learners,” report (iCivics, March 2, 2021). (Full disclosure: I’m on EAD’s steering committee.)

[5] Arizona State University, Center for American Civics, “The Civic Literacy Curriculum,” website.

[6] Civics Alliance, “American Birthright,” web page.

[7] College Board, “AP United States Government and Politics,” web page.

[8] Jeremy Stern et al., “The State of State Standards for Civics and US History in 2021,” report (Fordham Institute, June 2021).

[9] Melissa Kay Diliberti, Ashley Woo, and Julia H. Kaufman, “The Missing Infrastructure for Elementary Social-Studies Instruction: Findings from the 2022 American Instructional Resources Survey,” research report (RAND, 2023).

[10] Chief State School Officers Association, “The Marginalization of Social Studies,” infographic (2018).

[11] Maryland State Department of Education, Grade 6 and 7 Social Studies Framework, September 2023.

[12] Sophia Craiutu and Jed Ngalande, “State Civics Requirements in 2024,” essay (Hoover Institution, December 2024).

[13] Diliberti, Woo, and Kaufman, “The Missing Infrastructure.”

[14] Laura S. Hamilton, Julia H. Kaufman, and Lynn Hu, Preparing Children and Youth for Civic Life in the Era of Truth Decay: Insights from the American Teacher Panel (RAND, 2020), 48.

[15] Diliberti, Woo, and Kaufman, “The Missing Infrastructure.”

[16] Stern et al., “The State of State Standards for Civics and US History in 2021.”

[17] Educating for American Democracy, “Pedagogy Companion to the Roadmap to Educating for American Democracy.”

Policy Priority:
High Expectations
Topics:
Curriculum & Instruction
Governance
Teachers & School Leaders
Where

Online

Share

In recent years, school boards have become increasingly prominent sites for debate, conflict, and sometimes even violence. Parents, advocates, and community members have argued bitterly about curriculum content, parental rights, public health measures, and school safety. But how well do those at the helm–school board members–really represent the constituents they serve? 

Pagination

  • First page « First
  • Previous page ‹ Previous
  • Page 84
  • Page 85
  • Page 86
  • Page 87
  • Current page 88
  • Page 89
  • Page 90
  • Page 91
  • Page 92
  • Next page Next ›
  • Last page Last »
Fordham Logo

© 2026 The Thomas B. Fordham Institute
Privacy Policy
Usage Agreement

National

P.O. Box 110
Burke, VA 22009

202.223.5452

[email protected]

Ohio

P.O. Box 82291
Columbus, OH 43202

614.223.1580

[email protected]

Sponsorship

130 West Second Street, Suite 410
Dayton, Ohio 45402

937.227.3368

[email protected]