Mobile Navigation

  • National
    • Policy
      • High Expectations
      • Quality Choices
      • Personalized Pathways
    • Research
    • Commentary
      • Gadfly Newsletter
      • Flypaper Blog
    • Events
    • Scholars Program
  • Ohio
    • Policy
      • Priorities
      • Media & Testimony
    • Research
    • Commentary
      • Ohio Education Gadfly Biweekly
      • Ohio Gadfly Daily
  • Charter Authorizing
    • Application
    • Sponsored Schools
    • Resources
  • About
    • Mission
    • Board
    • Staff
    • Career
Home
Home
Advancing Educational Excellence

Main Navigation

  • National
  • Ohio
  • Charter Authorizing
  • About

Jeff Murray
9.17.2025
Gadfly Bites logo
Listen to this article
Loading the Elevenlabs Text to Speech AudioNative Player...

News stories featured in Gadfly Bites may require a paid subscription to read in full. Just sayin’.

  1. Before we get to the big news of the week, let’s start with Aaron Churchill’s guest spot on the All Sides radio show Monday. He was talking about the state of school funding in Ohio but the reporters get to talk first, so Aaron’s segment begins around 21:00. It’s great stuff, but I am sad that he didn’t ever really answer that “if you had a magic wand…” question. Too bad. (WOSU-FM, Columbus, 9/15/25)

  2. Aaron was also on TV earlier this week, talking about the potential benefits of a year-round school schedule. He starts talking at 1:47 in the clip. Aaron seems to be a fan, especially in terms of avoiding the worst impacts of the “summer slide”, but then again everybody interviewed for this piece is in that camp. Interesting. (Spectrum News 1, 9/14/25)

  3. After all that, Aaron still had energy to comment on new school and district report card data, which dropped on Monday. A typical example is this coverage from the Dayton Daily News, which focuses on local districts and goes with a quick “some rise; some fall; some stay the same” high-level analysis. (For now, I’ll let you read for yourself which districts fall into which categories, but I bet you can guess.) Obviously, DDN will dig in deeper soon, as is their usual MO. Can’t wait! (Dayton Daily News, 9/16/25)

  4. Here also are some big-picture statewide takes on report cards. First up is from Ohio Public Media, which focuses on the fact that math scores ticked up almost 2 percentage points across the state for last year, while reading scores were down half a percentage point. (WOUB-FM, Athens, 9/16/25) Second is a nice overview from the OCJ. The big picture from them is that 13 districts earned 2 stars (the lowest achieved) and 47 earned 5 stars (the highest possible). They also decide to highlight how many students residing in three urban districts (Cleveland, Columbus, and Cincinnati) are reported as using EdChoice vouchers. Can’t imagine why. (Ohio Capital Journal, 9/17/25)

  5. There will obviously be lots more analysis of the new data coming soon, but let’s check out a couple of the more-predictable hot takes on report cards generally: Some definite shade thrown on the science of reading push across the state due to the fact that reading scores were slightly lower overall last year compared to the previous year. (Cleveland.com, 9/15/25) This news roundup suggests that SoR is blunting the achievement of previously high-flying districts… (Cleveland.com, 9/16/25) …while this one complains report cards are just generally unfair to bottom dwellers as well, calling year-to-year changes in their components “artificial” and difficult to compare over time. Department of Education and Workforce spokespeople quoted in these pieces seem confident, however, that the direction of reading scores particularly will reverse in the next year. (Cleveland.com, 9/16/25)

  6. Here’s what I feel is a nice, balanced look at Akron City Schools’ new report card data. It includes open-eyed discussion of the good (overall rating rose from 2.5 to 3.5 stars, largely due to the positive influence of one of those newfangled components—postsecondary readiness) and the bad (less than half of the district’s third graders reached proficient on reading scores). District leaders seem to accept both results without equivocation and tell Akron Signal what they are doing right now get better outcomes across the board. Seems fair to me. (Akron Signal, 9/16/25) This also is a fair report card analysis—from the other end of the scale. Olentangy Local Schools here in central Ohio is largest district in the state to earn a 5-star overall rating, and their component scores are all pretty good too. “Top ratings don’t happen by accident,” superintendent Todd Meyer tells the Dispatch, “but through the strategic, intentional alignment of our staff’s work and commitment to our mission to facilitate maximum learning for every student.” No lies detected. (Columbus Dispatch, 9/17/25)

Did you know you can have every edition of Gadfly Bites sent directly to your Inbox? Subscribe by clicking here.

Policy Priority:
School Funding
Topics:
Governance
Brandon L. Wright
9.17.2025
Students in a classroom
Getty Images/Carlos Barquero Perez
Listen to this article
Loading the Elevenlabs Text to Speech AudioNative Player...

The latest twelfth-grade results from the National Assessment of Educational Progress are awful, as so many outlets pointed out over the last week. Average math and reading scores hit their lowest levels on record—going back to 2005 for math and 1992 for reading—with the bottom of the score distribution faring the worst. This, rightly, is where most of the commentary and policy efforts will focus. But it shouldn’t be the only focus—because marks at the high end were bad, too.

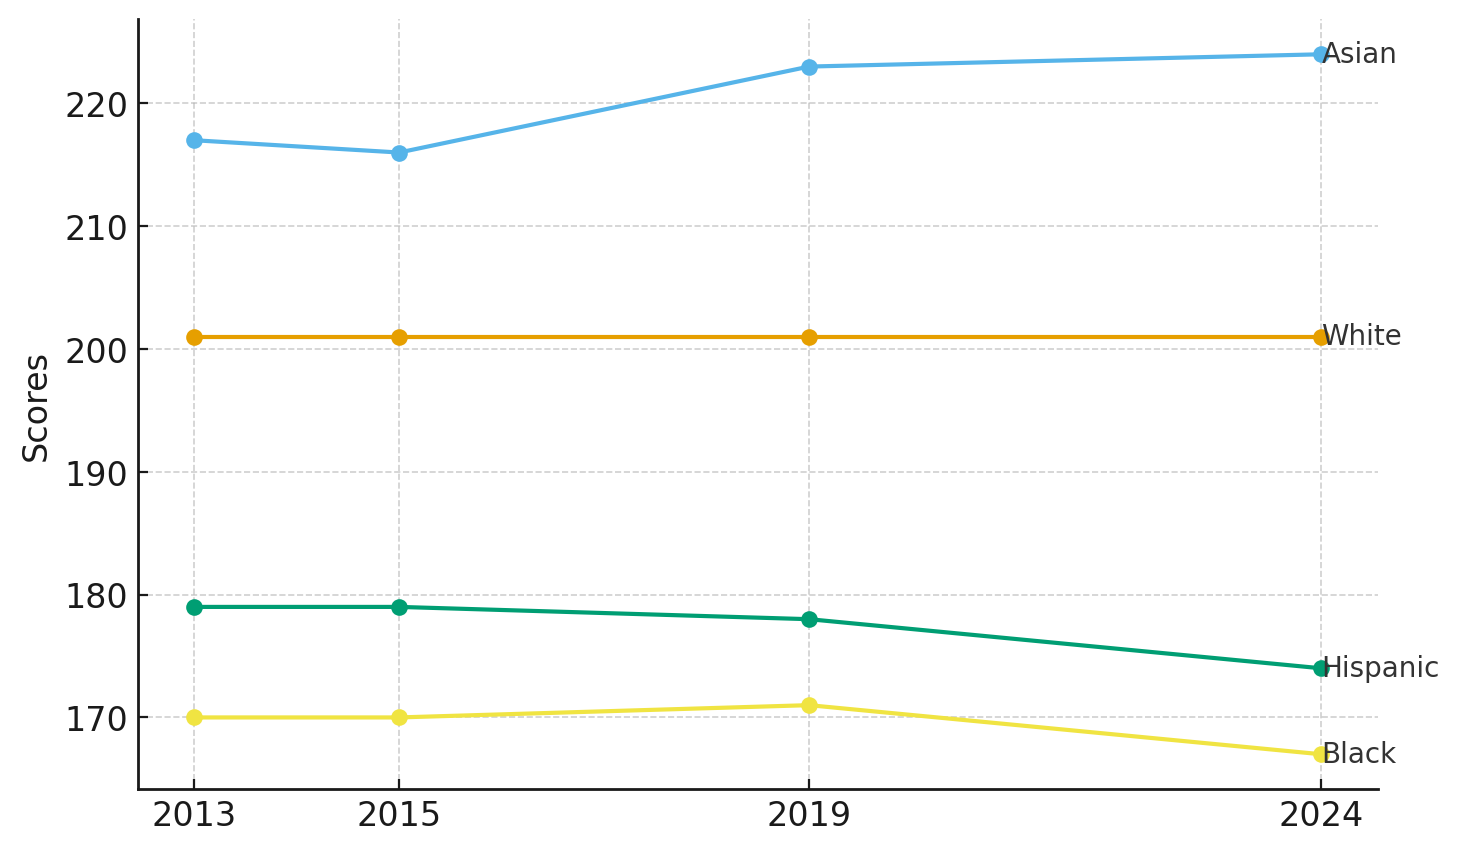
Math performance at the Advanced achievement level and the 90th percentile is flat, and there were notable declines for top-decile Hispanic and Black students (see figure 1). Drops among those two groups are alarming, if not surprising. Since NAEP has been administered, the percentage of Hispanic students at Advanced has hovered around 0.5 and Black students have rounded to 0 percent—compared to, in the most recent results, 4 percent for White students and 15 percent for Asian students.

Figure 1. NAEP math scores, 90th percentile, by race/ethnicity, 2013–24

1

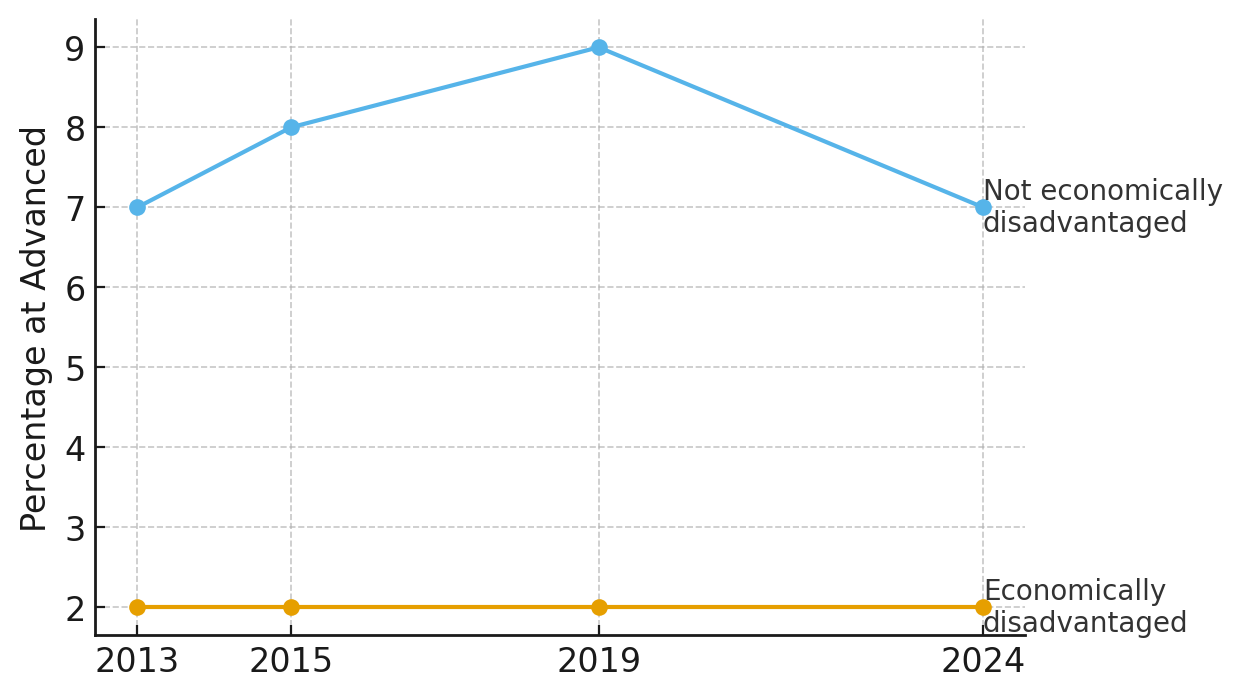
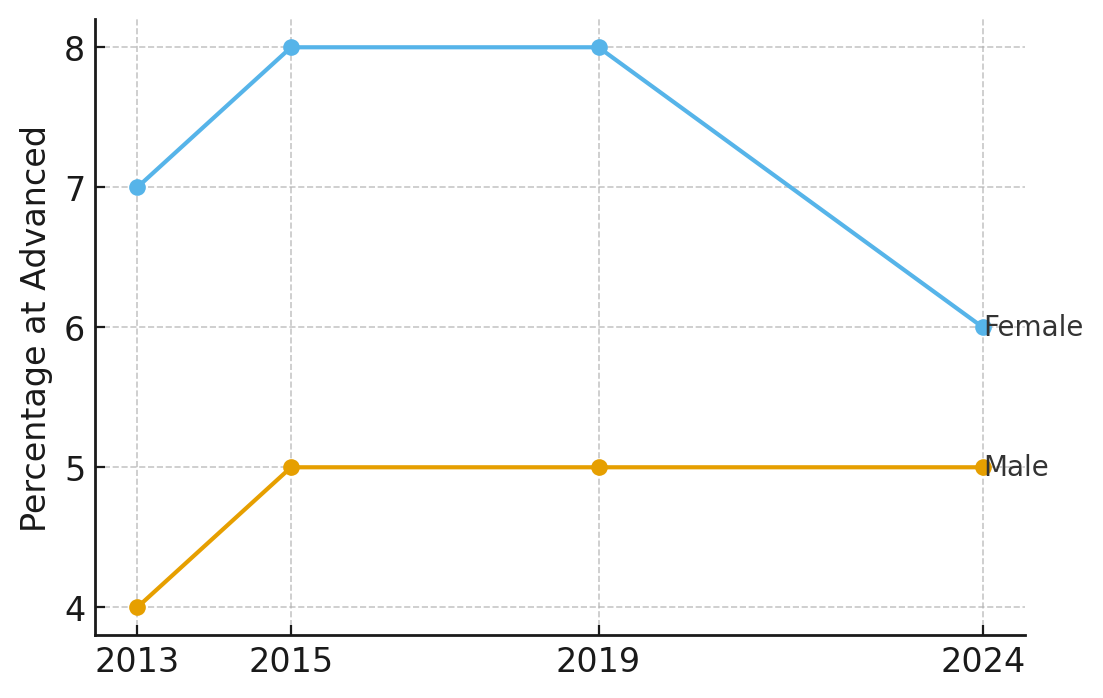
In reading, the percentage of students at the Advanced achievement level actually fell. And the decline, rather puzzlingly, seems to have been driven mostly by girls and kids whose families are middle class or higher—groups that historically have done better than their less affluent and male peers, respectively. The percentage of non-economically-disadvantaged students at the Advanced level fell from 9 to 7 (see figure 2), and the 90th percentile score also saw a statistically significant drop—while both metrics held steady for their economically disadvantaged peers. Likewise, girls dropped from 8 percent at Advanced to 6 percent (see figure 3), and their top-decile score declined significantly, while boys stayed flat in both.

Figure 2. NAEP reading scores, percentage at Advanced achievement level, by economically-disadvantaged status, 2013–24

2

Figure 3. NAEP reading scores, percentage at Advanced achievement level, male and female, 2013–24

3

Yes, these trends are better—in some cases far better—than those for other subgroups and students in general. But as I’ve argued consistently and frequently over the years, that’s no reason to ignore high achievers. They, like every child, are entitled to an education in which they’re nurtured and challenged and get to fulfill their potential. Leaving them to stagnate is its own form of neglect. It also matters for the country. Our economy, scientific progress, and military competitiveness hinge disproportionately on the students who reach the highest levels of skill and knowledge. And on international tests like PISA and TIMSS, the U.S. already trails gobs of similarly affluent and developed countries that are systematically cultivating their most talented students. We should do the same or else risk falling further behind.

As for the subgroups who saw the worst results at the high end—Hispanic and Black students in math and female and non-economically-disadvantaged students in reading—they call for two rather different reactions. For the former, we generally know what’s going on and what to do. School systems just tend not to do it. These students of color are more likely to live in poverty and have less access to healthcare, healthy food, safe streets, early childhood education, and more. Their schools more often suffer from crowded and unruly classrooms with less experienced teachers who are more likely to transfer or quit. Such disadvantages lead to big differences in baseline achievement and preparation for advanced instruction. Worse—and rather ironically, in the name of equity—this advanced instruction is less likely to exist in their schools, and when it does, flawed designs often favor less-marginalized peers.

The solution, then, is to build wider, more diverse pipelines of advanced learners, starting in elementary school, with universal screening for advanced instruction and then automatic enrollment into advanced education, at least by middle school.

The reading results are much more of a conundrum. Why would non-economically-disadvantaged students and girls, in particular, be slipping? We can’t yet know the answer to that question, but some plausible explanations stand out. Pandemic burnout hit girls especially hard. Many experienced higher levels of stress and anxiety than boys, and those lingering effects may be showing up in their scores. Social media is another likely culprit. The time and attention it consumes—and the unique pressures it places on girls—leaves less space for long-form reading. And the broader cultural decline in reading for pleasure only sharpens the problem. Surveys show teenagers read far fewer books now than a generation ago, and that trend is steepest among girls. Most of these possible explanations also involve tech devices that students from higher-income families are significantly more likely to possess and have access to than their less affluent peers, perhaps explaining why declines only happened among more-economically-advantaged teens.

If these tech-based explanation are accurate, then the growing call for schools to ban cellphones and limit other tech devices as much as possible will help some. As for reading, schools could try to follow the advice of my colleague Meredith Coffey: protect time for in-class reading, set school-wide expectations for longer assigned readings, and rethink test prep. Expectations for the impact schools can make should be tempered, though. Principals and teachers could plead with parents to better police screen time at home. But our broader culture is still a strong, major force here, and only so much can happen in our classrooms.

More generally, amid the worst NAEP scores in history, it should be understood that our high achievers are in trouble, too. So, by all means, address the tragic, near-universal declines, especially among our lowest-performing students. But don’t let that focus lead to neglect at the top. Both-and, not either-or.

Policy Priority:
High Expectations
Topics:
Accountability & Testing
Evidence-Based Learning
Curriculum & Instruction
Governance
Advanced Education
Teachers & School Leaders
Jeff Murray
9.16.2025
Rural teacher applicants SR image
Getty Images/StphaneLemire
Listen to this article
Loading the Elevenlabs Text to Speech AudioNative Player...

Claims of teacher shortages in recent years are more complex than the typical rhetoric suggests. Digging into limited labor market data helps uncover particular scarcities—and surpluses—depending on subject, grade level, student type, and teaching location. New research exploring the staffing processes in rural districts helps illustrate the nuance required to both assess and address the challenges specific to those schools.

Researchers Se Woong Lee and Minseok Yang (the latter a Fordham-AEI EEPS alum) use data from the Wisconsin Education Career Access Network (WECAN), a centralized system for Badger State districts to post teacher—and other—vacancies, and for hopeful candidates to upload their applications for those jobs. More than 95 percent of districts use the system, thus providing a trove of data from across the state. They analyze WECAN job postings and applications from 2014 to 2016. Interestingly, some charter and private schools also use the system today, but it is unclear whether they did so in the previous decade. Either way, Lee and Yang focus their study only on full-time teaching positions in traditional districts. That still results in more than 390,000 application-year observations, representing 41,300 teacher candidates who applied for 26,600 vacancies across 404 districts. Staffing records from the Wisconsin Department of Public Instruction provide data on final hiring decisions. Their analysis separated districts into four different typologies—rural, town, suburban, and urban—and compared the numbers and characteristics of applicants and hirees for teaching jobs in the various locales. They also used a mapping tool to determine the distance between applicants’ reported home addresses and the schools to which they applied.

The first big finding: 62 percent of applicants did not apply for vacancies in any rural school, while 6 percent applied exclusively to rural schools. The remainder listed themselves as geographically flexible and showed that to be true by applying to schools of multiple types. The median number of applications received per teacher vacancy in rural districts was nine, compared to eight for urban districts, ten for town districts, and 14 for suburban districts. Their analysis indicates that distance from an urban area seems to be driving this pattern: the farther away a job is from the city, the fewer candidates who apply. Additionally, math and special education teaching vacancies, regularly reported to be the hardest jobs to fill, received lower than the median number of applications across the board with minimal difference based on district type.

Female, non-white, and highly-qualified teachers (as determined by factors like years of experience, degree attainment, and college GPA) all demonstrated reduced inclination to apply for rural jobs. Conversely, individuals with prior rural teaching experience and graduates of rural-based teacher preparation programs exhibited a higher inclination to apply for such jobs. It is perhaps not surprising to learn that applicants to rural schools tend to live much further away (median 39 miles) from the districts to which they are applying, compared to those applying for suburban or urban jobs.

As to hiring, women, teachers with less than three years of experience, and those possessing master’s degrees were more likely to be hired by rural districts than by other district types. The authors speculate that the latter finding is probably due to the fact that so few of them apply to rural schools so they are quickly snapped up whenever possible. Internal applicants (defined as those who currently or previously worked in the district to which they are applying) were 5.9 percentage points more likely to be hired in a rural district than at any other district, and candidates with rural teaching experience or who graduated from a teacher prep program in a rural area also were more likely to be hired in rural districts than in urban or suburban districts.

Lee and Yang note a couple of limitations to their work relating to details of both the supply and demand sides of the equation. How many other candidates declined an offer before the final candidate accepted? Do novice teachers really want rural jobs or are those simply the easiest for them to get? Etc. The age of the data also raises questions about its applicability to today’s employment ecosystem, not to mention the impact of public school/district enrollment declines and growth in the charter and private school sectors. Even so, Wisconsin’s geography hasn’t changed much since 2016, with more than half of districts still defined as rural and encompassing 30 percent of the population. Concern regarding teacher vacancies in those schools has only increased in the last ten years, and the findings here echo those of other analyses showing a nuanced picture of hiring in specific places and subjects.

Based on their findings, the authors assert that “grow your own” programs and efforts to bring pre-service teachers into rural schools for internships or job shadowing would be beneficial policies for district leaders to implement. At the state level, paying all candidates during their student-teaching period, providing funds for hiring bonuses in hard-to-staff positions, and increased support to rural-focused teacher-preparation programs are also suggested as ways to help boost the number and diversity of applicants for rural teaching vacancies.

SOURCE: Se Woong Lee and Minseok Yang, “Who Is Applying to and Being Hired by Rural Schools? What Vacancy and Application Data Reveal About the Rural Teacher Labor Market,” Educational Evaluation and Policy Analysis (August 2025).

Policy Priority:
School Funding
Topics:
Teachers & School Leaders
Ohio Education Gadfly
9.15.2025
Media alerts stock image
Getty Images/almir1968
Listen to this article
Loading the Elevenlabs Text to Speech AudioNative Player...

Author’s correction (9/16/25): The original version of the press release inadvertently misstated the Algebra I proficiency rates for the Ohio Eight districts. The percentages displayed below are the correct ones.

Today, the Ohio Department of Education and Workforce published report cards for the 2024–25 school year. The data released today include state math and reading exam results in grades 3-8 and high school; they also feature one-to-five-star ratings for Ohio districts and schools.

“State exams and report cards continue to provide an important annual check on where students stand academically and what type of progress they are making,” said Aaron Churchill, Ohio Research Director for the Thomas B. Fordham Institute. “This year’s report cards make abundantly clear that Ohio must keep the pedal to the floor on policy initiatives aimed at effective instruction in math and reading, as too many students continue to struggle in these critical subjects. The Science of Reading initiative, for instance, promises higher long-term performance but only if policymakers stay patient and push hard for rigorous implementation.”

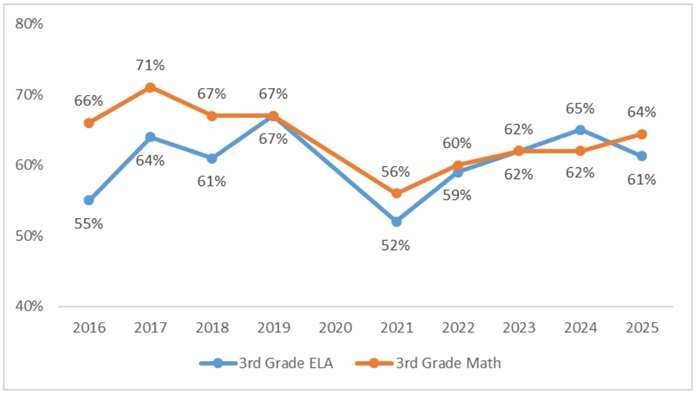
Across all tested grades, overall reading proficiency rates edged down from 60.9 to 60.4 percent in 2023–24 to 2024-25. As the figure below indicates, this decline includes a 3.2 percentage point dip in the key third-grade reading measure (64.5 to 61.3 percent proficient).

Third grade reading and math proficiency rates—statewide

Press release image 1

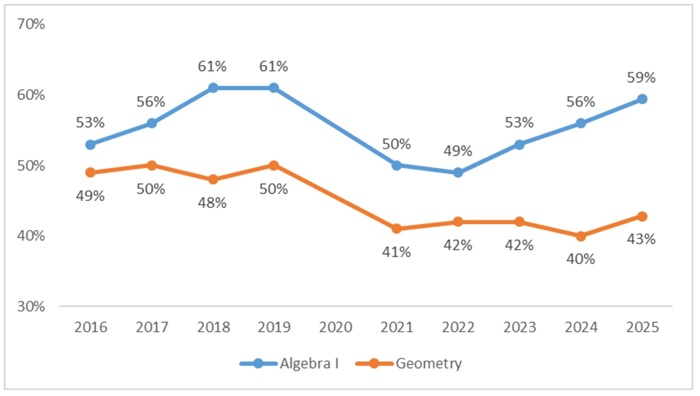
Math proficiency fell sharply during the pandemic across all grades. In high school math, scores still lag behind pre-pandemic levels but this year’s data reveal continuing signs of improvement. Algebra I proficiency rates rose from 55.9 to 59.4 percent from 2023–24 to 2024–25; Geometry also edged higher from 39.8 to 42.8 percent. Across all tested grades, math proficiency rates were up from 53.5 percent proficient in 2023–24 to 55.3 percent in 2024–25.

High school math proficiency rates, Algebra I and Geometry—statewide

Press release image 2

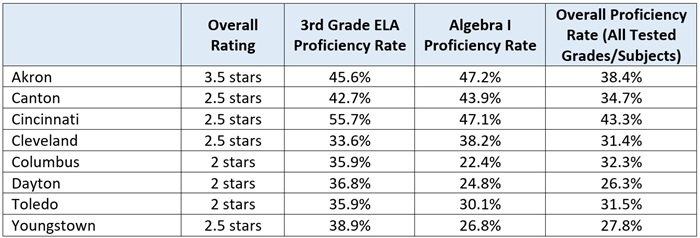
A closer look at academic performance in Ohio’s major urban districts shows alarmingly low proficiency rates. Just one in three students in Canton, Cleveland, Columbus, and Toledo achieve state proficiency standards. Less than 30 percent of students in Dayton and Youngstown score proficient.

Urban Districts’ Overall Ratings and Proficiency Rates

press release 3 revised

“No one should be satisfied with the results from this year’s report cards,” said Churchill. “Too many students across Ohio fall short of state academic standards, and achievement in our urban school systems remains tragic. Without ambitious efforts to improve our school systems, another generation of Ohio students will leave high school without the reading, writing, and math skills necessary to compete for the jobs of the future.”

Policy Priority:
Media Statements
Topics:
Accountability & Testing
Jessica Poiner
9.15.2025
IRC revamp recs blog image
Getty Images/coffeekai
Listen to this article
Loading the Elevenlabs Text to Speech AudioNative Player...

A rapidly rising number of Ohio students are earning industry-recognized credentials (IRCs). This should be good news, as IRCs can boost earnings and employment if they are high-quality and tied to in-demand jobs. But a closer look at state data reveals that many of the credentials Ohio students are earning don’t take much time or effort to obtain. Moreover, they lead to industries and jobs that pay relatively low wages. There are credentials with the potential to provide long-term benefits. But those aren’t the ones Ohio students are most likely to earn.

Ohio’s uptick in attainment—and the questionable quality of its most-earned credentials—can be explained as an unintended consequence of well-meaning state policy. For years, students have been permitted to meet high school graduation requirements by earning a 12-point credential or “bundling” a group of credentials in the same career field that added up to 12. The problem was that these IRCs weren’t consistently or transparently linked to data on wages, job outlook, or employer demand. Absent such data, there was little evidence indicating that the lower-point credentials students could bundle to graduate were actually benefiting them in the long run. But that didn’t stop some of Ohio’s largest districts from funneling students toward these easy-to-earn IRCs in an effort to boost graduation rates.

In short, Ohio lawmakers needed to go back to the drawing board. They did so via the recently passed state budget, which eliminates the point system and requires the committee to establish new criteria for how students can use credentials to graduate. If the committee wants to get things right this time around, it needs to do two things: 1) establish a system that accurately and transparently identifies IRC value and 2) develop a process for revalidating IRCs over time.

Fortunately, Ohio doesn’t have to start from scratch. Credentials of Value, a recently published report from Advance CTE, offers plenty of insight into how other states have tackled these two tall tasks. Let’s take a closer look at each.

1. Establishing a system that accurately and transparently identifies credential value.

Meaningful credentials are those that offer students a return on investment. There are plenty of ways to measure such returns, but one of the most important is whether a credential has value to employers. If an IRC doesn’t help students get their foot in the door in a growing career field, set them apart from other job applicants, or incentivize employers to offer them higher wages, then it’s probably not worth their time. To be clear, Ohio’s credential approval process under the point value system did involve a labor market audit and an industry feedback survey. But the new process needs to be much more in-depth and transparent.

The Credentials of Value report offers several ideas from other states that could help Ohio craft a better system. For example, when validating credentials during its approval process, Wyoming asks employers two specific questions: 1) If a learner comes to you with this credential, would you monetarily incentivize them? 2) If a learner comes to you with this credential in a hiring situation in which all things are equal, will this credential give them hiring preference? A minimum of ten employers must answer both questions affirmatively before a credential can be approved for the state list. Tennessee evaluates IRCs using a “robust scoring rubric” that measures credentials against high-skill, high-wage, and in-demand occupation definitions and cross-references labor market trends. And in South Dakota, leaders have leveraged real-time data from the state labor agency to review job listings from across the state and determine the required credentials employers are seeking for specific occupations.

Employer demand isn’t the only measure that matters. Ohio officials should also pay particular attention to wages. Florida considers whether credentials are tied to occupations that meet wage thresholds within specific economic regions, rather than a statewide wage benchmark that could be influenced by areas with particularly high or low costs of living. Given Ohio’s size and regional diversity, Buckeye leaders should consider following suit. Meanwhile, both Michigan and New Hampshire reported using the Living Wage Calculator created by the Massachusetts Institute of Technology to determine “family-sustaining wages” while identifying the value of credentials. For Ohio, looking to a trusted expert source—rather than relying on in-house calculations—would be a positive step toward transparency.

2. Developing a system for revalidating credentials over time.

The labor market is constantly evolving. A credential that’s in demand and leads to a well-paying job in 2025 could be obsolete by 2030. Ohio leaders should prepare for this possibility by proactively developing a system through which credentials are regularly reevaluated over time.

Once again, the Credentials of Value report offers some intriguing examples from other states that Ohio leaders could consider. For example, Maryland ensures that its state-approved credential list contains only IRCs of value by putting credentials through a rigorous vetting process every two years. South Dakota has a statewide advisory board that reviews credentials annually, and its revalidation process intentionally mirrors the initial credential approval process. Wisconsin and Kentucky collect employment-related outcomes data to review the return on investment for credential earners. And Colorado ties its reevaluation of approved credentials to the state’s Talent Pipeline Report, which is updated annually and identifies areas of growing demand.

***

Ohio policymakers deserve credit for their willingness to go back to the drawing board with credential approval. But calling for a new framework is the easy part. Creating a better one will be much more difficult, and getting it right is more important than ever. Fortunately, there’s no reason to start from scratch. Advance CTE’s recent report offers plenty of ideas from other states. Here’s hoping Ohio leaders are willing to take a closer look.

Policy Priority:
Standards & Accountability
Topics:
Career & Technical Education
Jeff Murray
9.15.2025
Gadfly Bites logo
Listen to this article
Loading the Elevenlabs Text to Speech AudioNative Player...

News stories featured in Gadfly Bites may require a paid subscription to read in full. Just sayin’.

  1. As we talked about last week, it’s school and district report card day today. Ahead of the data release frenzy, here’s a look at two “storylines” that will be under the microscope for Cleveland Metropolitan School District. (One assumes that the journalist doesn’t NOT care about other schools, but you wouldn’t know that from this piece.) They are: Whether CMSD can maintain their 3-star overall rating from last year and whether the implementation of science of reading-aligned curricula and teaching will boost CMSD’s early literacy scores particularly. Early indications for both do not sound super positive to me. Just sayin’. Our report card guru Aaron Churchill weighs in on both topics in a preview of larger discussions to come. (Cleveland.com, 9/15/25)

  2. Speaking of different storylines, here is some data showing that homeschooling is at an all-time high in Ohio this year. Even higher than during the pandemic. Here are a few words from a happy homeschool mom for you: “We loved it. We’ve had the ability to tailor each child’s education to that child.” (10 TV News, Columbus, 9/14/25)

  3. One more storyline for you: St. Francis de Sales Catholic School in Toledo is also at its highest enrollment this year, its 70th in operation. The all-boys school is also in the process of expanding to make room for lots more kids. There are several great stories here from staff, students, and families, but I’ll just leave you with this one: “St. Francis has set me up for the rest of my life,” said senior Brent Gehring, heading into the Air National Guard after graduation. “The academics are strong, and the relationships I have here will stay with me. The brotherhood makes it special here.” Why yes, they DO take EdChoice vouchers at St. Francis. How astute of you to ask. (Toledo Blade, 9/14/25)

Did you know you can have every edition of Gadfly Bites sent directly to your Inbox? Subscribe by clicking here.

Policy Priority:
School Funding
Topics:
Governance
Aaron Churchill
9.12.2025
Local funding - Indiana blog image
Getty Images/Smart
Listen to this article
Loading the Elevenlabs Text to Speech AudioNative Player...

A core principle of fair school funding is that dollars should follow students to the schools they attend. This was the recommendation of a renowned group of education leaders, who two decades ago called for a system in which “funding from all levels follows every student to whatever public school he or she attends.” Here in Ohio, one of the main ideas behind the acclaimed Cupp-Patterson school funding plan is that “dollars flow directly to where students are educated.”

The concept makes perfect sense. The school bearing the responsibility—and the cost—of educating a student should receive the per-pupil allotment for her education. This principle should apply to traditional districts. For instance, when students transfer from Columbus to Westerville (or vice versa), dollars should move with them. It should also apply for schools of choice. Public charter schools, along with regional STEM and career-tech schools, should receive full per-pupil funding when students enroll. In a truly “sector agnostic” system, private schools would also be included.

Unfortunately, Ohio has long struggled to follow this principle. Despite their adoption of the Cupp-Patterson formula, state lawmakers continue to hand out “guarantees” to school districts. These extra subsidies, which amount to hundreds of millions of dollars, undermine an enrollment-driven formula by shielding districts from funding reductions when students are no longer enrolled. This funding of “empty desks,” instead of actual students, reduces the availability of state dollars for districts that are growing and in need of additional resources.

Another egregious violation of the funds-follow-students principle happens at the local level. In Ohio (and most other states), local taxpayer funds stay with the district, rather than travelling with students when they choose non-district alternatives such as public charter schools. Of the $12 billion that Ohio districts generate in local taxpayer support, charters receive next to nothing. Their lack of local funding results in significant shortfalls relative to their district counterparts. Considering all funds—including both state and local—Ohio charter students are funded on average at about 23 percent less than their peers attending district schools.

Shortchanging charter students is hardly fair, but the notion that local funds move with them is a political third rail. School districts have long viewed these dollars as “theirs,” and some have even accused charters of taking them when, in fact, no money was moving. In the face of this opposition, few have dared to fight the uphill battle against their financial interests. Today, despite serving almost 90,000 students—along with strong evidence that they deliver a superior education—Ohio’s brick-and-mortar charters remain almost entirely shut out of local funding. The only exception is nine Cleveland schools that received a mere $6 million out of the Cleveland Metropolitan School District’s $284 million in local tax revenues in 2024.[1] The other roughly 310 charter schools in Ohio received goose eggs.

Breaking the status quo in Ohio will be a politically fraught undertaking. But a handful of other states are showing that local revenue sharing can be done. In most of these cases, districts are required to provide a portion of local facility dollars to charters (but not the larger pot of local revenues that cover operational expenses). Florida, for instance, requires school districts to share a portion of facility-related local revenues and provided about $56 million to charter schools for their capital needs in 2024.

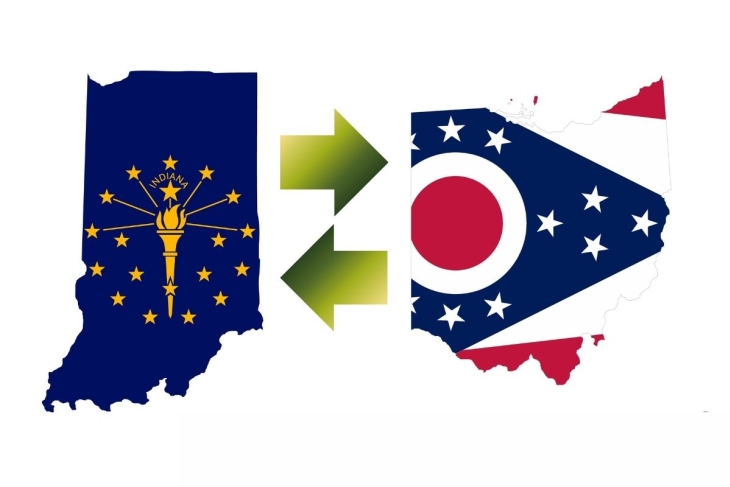
An even more ambitious effort is underway in Indiana. For those unfamiliar, Hoosier State lawmakers in 2023 began requiring certain districts to provide charters with a share of local operational funding, proportional to their enrollments. The legislation was initially quite narrow, as it applied to charters in just four counties, including those encompassing Indianapolis and Gary. Moreover, charters’ share of local funding was limited to any revenue growth moving forward, whether via levy passage or increased valuations. It did not apply to existing local tax revenues.

Earlier this year, the Indiana legislature took it a step further. Under recently passed legislation, the state now ensures that practically every Indiana charter school receives a proportional share of all local revenues—both existing funds and additional growth. This more comprehensive revenue-sharing requirement is being phased in over four years starting in 2028. The Mind Trust, an Indiana-based education group, expects Indianapolis charters to receive some $3,750 per pupil in local revenue by 2031, which will bridge a substantial portion of the city’s charter funding gap.

Ohio lawmakers should take a page from path-breaking states such as Indiana and begin providing charter schools with a share of local dollars. Under an Indiana-like approach, Columbus’s 70-plus charters, which serve nearly 30 percent of the city’s public school students, would receive more than $175 million per year (or some $9,000 per pupil). That would make a huge dent—maybe even erase—the charter funding gap in that city, and others, too.[2]

Some may see a robust local revenue-sharing requirement as a pie-in-the-sky idea. Perhaps. And if so, the onus remains on Ohio lawmakers to keep boosting state aid for charter schools to offset the absence of local dollars. Yet other states—building on principles of fair funding—have forged a pathway toward equitable charter funding that Ohio can and should emulate.


[1] These funds were received through a unique (for Ohio) revenue-sharing agreement called for under the Cleveland Plan and authorized under Revised Code 5705.21.

[2] If public charter schools begin to receive a proportional share in local funding, state lawmakers would need to modify charters’ funding formula to reflect their receipt of local dollars.

Policy Priority:
School Funding
Topics:
School Finance
Jeff Murray
9.12.2025
Ohio charter news logo
Listen to this article
Loading the Elevenlabs Text to Speech AudioNative Player...

Ohio Charter News returns after a one-week break, covering news items from 8/30 – 9/12/25.

Stories featured in Ohio Charter News Weekly may require a paid subscription to read in full.

New schools for the new school year

We start with two great profiles of charter schools that recently opened their doors around Ohio. First up, is T-Squared Honors Academy, a homegrown charter school network in northeast Ohio whose latest campus opened in East Cleveland to start the 2025-26 school year. The new school is housed in a former GE headquarters building (that looks like a gorgeous Gilded Age home) and welcomed ninth and tenth graders for its first year. It is named for W.E.B. Du Bois’ theory of the “Talented Tenth”, and the vision for the school follows suit: “Every student has the potential to think critically, lead boldly, and care deeply about the issues affecting their communities and the wider world.” Nice. Next up is the Academy for Urban Scholars, whose sixth Ohio charter school campus launched its inaugural year in Toledo last week. “We meet the students where they are at and provide wrap-around services to them,” explained co-founder Pamela Gregory during opening day festivities. “They will all have a success coach who will help identify barriers to the student’s graduation. They will help students overcome those obstacles.” It is also pleasing to read about the plethora of Glass City talent both running and supporting the school, which should bode well for its future. Here’s to a great school year for everyone!

A busload of misinformation

Sadly, the Associated Press followed the same misleading playbook as other recent national and international coverage last week when discussing the student transportation troubles in Dayton and, by extension, all of Ohio. Besides repeating the myth that transporting charter and private school students somehow limits districts from transporting their own students, the AP also neglects to mention that high school busing in Ohio is entirely voluntary (except for students with specific IEP requirements). When will the misinformation end?

Better news from Indianapolis

As school leaders and policymakers across Indiana begin to actualize the state’s new requirements for greater cooperation and collaboration among district, charter, and private schools, busing of students will be one important litmus test of how well the effort is going. Here’s a look at a group of Indianapolis charters (and one private school) who have banded together with the desire to solve longstanding transportation problems in their city. Worryingly, there seems to be no movement by the city schools to join in with this important effort yet.

NAEP news

While most of the news about new NAEP score data for older students (12th grade reading and math, along with 8th grade science) was bad, kudos to Marc Porter Magee for highlighting the fact that charter school students’ scores largely bucked the national downward trend. And kudos to those charter schools who continue stepping up to help mitigate Covid learning loss for their students.

Private, not public

A virtual private school model will replace the Archdiocese of Oklahoma City’s plans to open the nation’s first religious charter school. Those original plans were rebuffed when an appeal to the U.S. Supreme Court resulted in a prior Oklahoma Supreme Court decision against it being allowed to stand. The appropriately-named St. Carlo Acutis Classical Academy is now planned to open its virtual doors in the 2026-27 school year, enrolling up to 300 students statewide in kindergarten through eighth grade.

New data

New data from the National Alliance for Public Charter Schools shows that charter enrollment has seen a steady rise over the past six years. From the 2019-20 to the 2024-25 academic year, charter schools saw a boost of nearly 15 percent, representing more than 492,000 students. Over the same time period, traditional district enrollment fell by 4.4 percent, or over 1.9 million students. Big news indeed.

*****

Did you know you can have every edition of the Ohio Charter News Weekly sent directly to your Inbox? Subscribe by clicking here.

Policy Priority:
School Choice
Topics:
Charter Schools
Jeff Murray
9.12.2025
Gadfly Bites logo
Listen to this article
Loading the Elevenlabs Text to Speech AudioNative Player...

News stories featured in Gadfly Bites may require a paid subscription to read in full. Just sayin’.

  1. As I was reading this news coverage about the teacher pipeline situation in Ohio, one specific part of it leaped out at me: “However, it is hard to quantify the shortage in Ohio because the state has not required schools to report relevant data.” It even came with a voice attached to it in my head—that of my colleague Jessica Poiner. She’s not quoted or namechecked here, but this has been such a signature concern of hers for years—and her published analysis and commentary has been so widely quoted elsewhere—I can’t help but believe that this has helped reshape the conversation in a very good way. Even better: “Ohio’s teacher shortage will be more easily tracked in the coming years. Starting Sept. 30, the Department of Education and Workforce will collect employment, retention, and vacancy staff data.” Talk about an influencer! (NBC4 News, Columbus, 9/12/25)

  2. Here’s another look at one of my favorite topics: Adults banning kids from bringing items into their schools. This time, it’s metal water bottles which are now forbidden—with consequences—in one Akron City Schools high school. (Actually, this makes two district buildings with such a ban if you read far enough into the piece, but it’s this one that’s making news right now.) Why? School leaders are a little cagey about that part, saying both that heavy, opaque, stainless steel bottles constitute a “significant safety concern” but also that “multiple factors” contributed to the decision. The adults declined to discuss any specific incidents with the ABJ but students haven’t been shy about sharing. Junior Matthew Burrow described a pretty out-of-control environment at Firestone if I do say so myself (“I’ve seen fights with Chromebooks; people throwing chairs, backpacks, tables – I’ve seen it all.”), and suggested that his favorite type of solid, insulated, keep-the-water-cool-all-day bottle is being scapegoated here as just one potential problem among many. Honestly, I don’t know why the adults don’t just try to pacify the kids with TikTok videos or Royal Kingdom on their phones… (Akron Beacon Journal, 9/10/25) Apropos of nothing in particular, here’s a very nice look at homeschooling. It includes in-depth how-to info and testimonials from several happy (and successful) homeschooling families in Akron. (Akron Signal, 9/11/25)

  3. As we discussed on Wednesday, the internationally-overblown rhetoric around high school busing in Dayton (and Ohio writ large) is missing several important components, not least of which is the fact that no district in the entire state is required to transport high school students. It is entirely optional (except for students with specific IEP provisions). I’m going to hope that Columbus City Schools’ decision to revisit their completely-voluntary high school busing program for cuts doesn’t fall prey to the anti-choice fake-outrage media machine currently operating on myth-fueled overdrive around the world. (Columbus Dispatch, 9/11/25) Interestingly, the elected school board in Columbus is also considering changes to its very popular intradistrict high school choice program as another way to save some money. Can’t imagine that will be well received by the thousands and thousands of families using it. But that’s a discussion for another day. Today, we let Columbus City Schools’ rosy report card preview (“a significant win for Columbus City Schools educators who work hard in classrooms every day.”) have the last word. (Spectrum News, 9/10/25)

Did you know you can have every edition of Gadfly Bites sent directly to your Inbox? Subscribe by clicking here.

Policy Priority:
School Funding
Topics:
Governance
Henry Seton
9.11.2025
Student using a computer in class
Getty Images/koldo studio
Listen to this article
Loading the Elevenlabs Text to Speech AudioNative Player...

This fall, students are returning to school amidst tighter cellphone restrictions than ever. From California to Florida, a rare consensus of politicians, educators, and parents is rising against the dangers that smartphones pose to student learning and well-being.

But it is too early to celebrate. Simply banning cellphones is like locking the front door while leaving the back door open.

As an educator who has worked in phone-free schools for decades, I have seen firsthand how the distraction economy survives. Laptops, Chromebooks, and tablets—sometimes handed out by the schools themselves—can connect to the same social media platforms, as well as potent, addictive games, all on a bigger, brighter screen. These devices can also remotely access smartphones and even gaming systems like PlayStation and Xbox.

Firewalls help, but they are frequently no more than low fences. Classroom rules depend heavily on the eagerness of teachers and administrators to enforce them. Many educators look the other way, averse to confrontation, hoping that a distracted student is better than a disruptive one.

Even when students are actually on task, research consistently shows that screens are less effective than paper for deep reading and long-term retention. Students reading on paper can comprehend more complex texts, sustain focus longer, and remember more the next day.

And the effect is immediate: The moment a laptop is open on a desk, students’ attention spans shrink—not just for those using the devices but also for peers in their line of sight. According to a recent PISA study, about two-thirds of U.S. teens say they’re distracted by their own digital devices, and roughly 54 percent say they’re distracted by peers’ usage—a pattern linked to a 15-point drop in math scores in OECD countries.

In my first decade teaching in Massachusetts, I studied public data to find the schools near me where students had the fastest rates of growth from year to year. Again and again, I found the same thing: engaged students but minimal tech. With only a notebook, pencil, and text, students flourished under strong instruction—whether debating literature and history in whole-class discussions or wrestling with STEM problems in small groups while their teachers circulated and coached.

My own 10th grade world history course is hardly tech free. I project instructions and a timer for most activities, so expectations are clear. I post all lessons and resources online in case students need to revisit a topic. Students occasionally use their laptops in class when necessary—for example researching and preparing slides for current-events presentations. But I design most lessons to be device-free for students.

What about AI and the argument that our future will be intertwined with ChatGPT and Claude? The reality, as any teenager will tell you, is that it takes mere hours, if not minutes, to learn how to use AI tools adroitly. Conversely, it takes decades to develop the reading skills needed to be a discerning thinker. As cognitive scientists like Daniel Willingham have argued, attributes like creativity and critical thinking rarely exist in isolation but instead rely on deep foundations of subject-specific content knowledge that build slowly over time.

We need to insist that schools tighten access to all electronics, not just cellphones. The default for our nation’s classrooms needs to be that electronics are away unless they bring a clear benefit. And when students are on devices, teachers need to monitor all screens rather than naively hoping that students will self-police when highly addictive apps are a click away.

If we want to prepare our young people for a future that demands focus, knowledge, and critical thinking, the first steps are simple: Ban the phones, close the laptops, put away the tablets, and let the learning begin.

Policy Priority:
High Expectations
Topics:
Curriculum & Instruction
Teachers & School Leaders

Pagination

  • First page « First
  • Previous page ‹ Previous
  • Page 85
  • Page 86
  • Page 87
  • Page 88
  • Current page 89
  • Page 90
  • Page 91
  • Page 92
  • Page 93
  • Next page Next ›
  • Last page Last »
Fordham Logo

© 2026 The Thomas B. Fordham Institute
Privacy Policy
Usage Agreement

National

P.O. Box 110
Burke, VA 22009

202.223.5452

[email protected]

Ohio

P.O. Box 82291
Columbus, OH 43202

614.223.1580

[email protected]

Sponsorship

130 West Second Street, Suite 410
Dayton, Ohio 45402

937.227.3368

[email protected]