Mobile Navigation

  • National
    • Policy
      • High Expectations
      • Quality Choices
      • Personalized Pathways
    • Research
    • Commentary
      • Gadfly Newsletter
      • Flypaper Blog
    • Events
    • Scholars Program
  • Ohio
    • Policy
      • Priorities
      • Media & Testimony
    • Research
    • Commentary
      • Ohio Education Gadfly Biweekly
      • Ohio Gadfly Daily
  • Charter Authorizing
    • Application
    • Sponsored Schools
    • Resources
  • About
    • Mission
    • Board
    • Staff
    • Career
Home
Home
Advancing Educational Excellence

Main Navigation

  • National
  • Ohio
  • Charter Authorizing
  • About

The Education Gadfly
8.27.2026
Gadfly Guy
Listen to this article
Loading the Elevenlabs Text to Speech AudioNative Player...

WHAT WE’RE READING

Aleksandra Appleton reports on Indiana’s efforts to build postsecondary pathways that avoid the shortcomings of many existing apprenticeship models. The plan lets high schoolers begin training for in-demand careers, then helps those students earn a college degree down the road—often with financial support from their employers.

—

After years of falling or stagnant student achievement, Maryland is changing how students learn math. The source of the declines isn’t completely clear—Baltimore Banner’s Liz Bowie wonders whether raising the bar with Common Core inadvertently harmed struggling students:

Theories abound, but today educators believe the way teachers translated the standards into the classroom didn’t help. Students were expected to perform at higher levels than ever before, and often there was no plan to help students who were already behind. In addition, many of the concepts were taught once, rather than being reinforced in the next year or two. That meant struggling students fell further behind.

It’s a mystery also on Nat Malkus’s mind, as he considers factors ranging from smartphones and social media to the pandemic and the Great Recession. He wonders about the timing of federal efforts, too, but suggests it was ESSA and the decline of NCLB that caused—or reflected—a broader cultural shift against high standards.

EXTRA CREDIT:

Chad Aldeman, “Why Common Tests Matter” (in state voucher programs)

Daniel Buck, “Kentucky Audit Reveals Systemic School Failure — What’s Happening in Your State? ”

Corey DeAngelis, “A Nebraska Lawsuit Claims Public Schools Are Unconstitutional”

Ray Domanico, “Private Schools Are No Threat to Democracy”

Jessica Grose, “AI in Norway’s Schools”

Michael Hartney and Vlad Kogan, “Absentee Teachers: The Other Attendance Problem”

Colleen Hroncich, “In the AI Era, School Choice Is Crucial”

Patricia Levesque, “The Three Prongs of Education Reform Success: Policy, Programs, and Political Perseverance”

Kenneth Marcus, “Why Moving the Office of Civil Rights from ED to DOJ Will Be Better for Families”

Karen Hawley Miles, “What Districts Actually Need to Implement College & Career Pathways at Scale”

Kelsey Piper, “Why parents love a school with bogus numbers”  (about Alpha School)

Benjamin Riley, “The 50 Percent Problem”

Natalie Wexler, “Do We Need Another National Reading Panel? ”

Daniel Willingham, “Students Should Only Use AI for Things They Already Know How to Do Well”


Editor's note: This was first published on Mike Petrilli's Substack, SCHOOLED, a free Substack and email newsletter restarting the education-reform conversation. Click here to subscribe for sharp analysis of the week’s biggest K–12 debates, curated commentary from across the ed-policy world, and lively discussion—including reader reactions and pushback.

The Education Gadfly
8.27.2026
Gadfly Guy
Listen to this article
Loading the Elevenlabs Text to Speech AudioNative Player...

CHEERS

We said goodbye this week to Dolly Parton. Beyond her legendary contributions to the American songbook, she cared deeply about literacy and used her fame and fortune to provide millions of free books to children around the world—every month. In her honor, check out Linda Jacobson’s 2024 piece on Dolly’s Imagination Library.

—

And in a new article from The 74, Patrick O’Donnell reports on how Ohio is addressing the “mismatch…between what schools offer and business want” when it comes to industry-ready credentials, and highlights Fordham-Ohio’s work on the issue:

Fordham has reported multiple times the last few years on ways some districts, notably urban, high-poverty ones where some students struggle to graduate, have large numbers of students earning low-value credentials just to earn a diploma.

“Credentials are intended to signify students’ acquisition of technical skills and help them gain an edge in the labor market, not simply be a workaround to a diploma,” wrote Fordham’s Aaron Churchill. “Ohio schools have discovered the easiest ones to attain and used them to get students to the finish line (and inflate their graduation rates as well as report card ratings).” That system, Churchill and Fordham’s Jessica Poiner reported, had more than 9,000 students earning RISE UP retail sales and customer service credentials in 2023—credentials that, combined, allow students to graduate—but were sought by employers for just three jobs statewide that year.

JEERS

Last week, Boston College professor Heather Cox Richardson used her popular Substack to create a misleading narrative about the history of school choice in America. By cherry-picking events and attributing singular intentions and perspectives to major events and initiatives—all calibrated to make her argument against parental choice—she loses the chance to teach her readers about the nation’s complex history of public schooling.

—

In a post that Pangram flagged as being (appropriately)100 percent AI-generated, Dana Williams says “effort migration”—outsourcing tedious learning—is the way of the future, that “AI isn’t helping students cheat,” and that “the ability to think critically with technology will become one of the most important forms of literacy a student can learn” since that’s what employers will want in adults. Dana says we should rethink academic integrity as a result, but applying this reasoning to K–12 schools, where students haven’t developed independent critical thinking skills, is a dangerous path.


Editor's note: This was first published on Mike Petrilli's Substack, SCHOOLED, a free Substack and email newsletter restarting the education-reform conversation. Click here to subscribe for sharp analysis of the week’s biggest K–12 debates, curated commentary from across the ed-policy world, and lively discussion—including reader reactions and pushback.
Meredith Coffey, Ph.D.
8.27.2026
Portrait of a Graduate
Listen to this article
Loading the Elevenlabs Text to Speech AudioNative Player...

We’re approaching the end of an era: New York State is scrapping its storied high school Regents exams as a graduation requirement. Initially administered in the 19th century, the Regents were the first standardized state assessments of their kind. And since the early 2000s, students have had to pass five Regents in four subject areas to graduate with the standard “Regents diploma.”

Under the new plan, however, students will take Regents only for federal compliance purposes; passing won’t be required to graduate. Instead, as part of a new framework called the New York State Portrait of a Graduate, a high school diploma will be based upon students’ demonstration of six vaguely appealing “interconnected attributes”: academically prepared, creative innovator, critical thinker, effective communicator, global citizen, and reflective and future focused.

The specifics of the new graduation requirements are still in the works, but so far, official documents indicate that students will “establish their readiness” through “exhibits of evidence,” apparently the state’s hazy umbrella term for tasks including “performances, portfolios, assessments, [and] presentations.” Also, “real-world projects” and “work-based learning” may be involved. Individual teachers will design, administer, and score their students’ “exhibits of evidence” according to a statewide rubric with mastery levels, rather than letter or number grades. I’m really leaning on quotes here because, frankly, most of the guidance is too nebulous to paraphrase.

Though some other states are similarly deemphasizing traditional state testing and developing “portraits” and “visions,” New York is an outlier in its aggressive effort to overhaul its entire assessment system—and to effectively give up on clear academic expectations. As terrible as that is, it’s also more than a little troubling that the Empire State has committed to dismantling the Regents requirements without a clear sense of what will replace them.

As an English language arts (ELA) teacher in New York City in the 2010s, I certainly saw room for improvement on the ELA exam. (I’m looking at you, Part 3, with your overemphasis on “identifying the central idea.”) More broadly, I heard valid concerns around teaching to the test, inadequate support for low-performing students, and the exams’ relevance to labor market demands.

But I also saw real value in the Regents. The graduation requirement set a reasonably high bar for all students throughout the state. And while opponents contended that the exams created an inequitable barrier to graduation, EdTrust and others have rightly argued that such an argument amounts to shooting the messenger, given that the tests simply revealed schools that were failing to educate already disadvantaged students.

In fact, I taught many such students at one of New York City’s “transfer” schools, serving 16- to 21-year-olds who had left traditional high school settings. For our student population, Regents exams were indeed a substantial hurdle—one that gave us a high bar to work toward. Finishing school couldn’t just be a box-checking exercise; rather, my students knew that they had to pass the same exams as the kids at Stuyvesant. This non-negotiable standard communicated that they were still being taken seriously. That’s a powerful message for students who’ve been written off before.

Yet, it wasn’t a one-size-fits-all system. In limited circumstances, if a student with disabilities made a genuine attempt but absolutely could not pass a Regents exam, there existed a “local” diploma alternative. Conversely, students who wanted to go above and beyond could take four additional exams to earn an “advanced” Regents diploma.

Alas, Regents diplomas are now headed for the sunset. As for what’s next, current New York educators have noted that the incoming “portrait of a graduate” framework could prove either transformative or “one of the most well-intentioned failures in recent education policy,” and there’s good reason to fear it’s careening toward the latter.

Similarly flexible statewide systems have flopped before. Kentucky and Vermont both tried portfolio-based assessment in the ’90s. External reviews found administrative burdens, drains on instructional time, rampant cheating, uneven rigor, and scoring that managed to be both inconsistent and inflated. In Vermont, scoring reliability was so poor that a grader had a better chance of correctly predicting the outcome of a coin toss than agreeing with a colleague’s score. Both programs were largely abandoned by the early aughts.

Given that New York’s current plan is even fuzzier than what Kentucky and Vermont attempted, its prospects look pretty awful. The portrait-of-a-graduate bell won’t be unrung, but with three years left to go before full implementation, there’s opportunity to mitigate the risks. Here are three of the likeliest pitfalls, and what New York can do about them.

First, the portrait-of-a-graduate approach creates substantial challenges around transparency and buy-in from families. Most parents could readily understand what it meant for a kid to earn a 75 on the Algebra I Regents. But the same can’t be said for a “proficient” rating for “global citizen.”

New York needs to develop a robust and realistic family engagement plan (including support for educators, who will simultaneously be expected to learn the ropes and explain it all to students and families). Where did the number grade go? What’s an interconnected attribute? Why should families care about abstract concepts like “reflective and future focused”? And, even if they’ve been persuaded, how can they support students who need extra help? If a student isn’t cutting it as a “creative innovator,” families aren’t going to intuit the most effective interventions.

The burden of adapting to this new system will be even greater for families already facing disadvantages, such as immigrant families navigating language barriers and unfamiliar institutions. New York must take that seriously.

Second, the portrait-of-a-graduate rollout and implementation are going to pose significant logistical difficulties. Plans are taking shape to have educators participate in a handful of virtual and regional in-person training sessions. But that’s barely more than the usual back-to-school PD. With the new framework, teachers will have to internalize a radically revised assessment system and rubrics. They will have to rewrite entire courses and design tasks aligned to the new state guidance. Performance-based assessments can take many hours to execute. Administrators will have to ensure that the six interconnected attributes build on one another across subjects and grade levels. They’ll have to develop new infrastructure for tracking students’ evidence of learning. And that’s all while maintaining the normal instructional load amidst staffing shortages and chronically low morale.

Maybe these “growing pains” will be worth it in the long run, but New York can’t afford to underestimate them. The state should provide exemplar “exhibits of evidence,” along with the lessons and materials required to get students there, so that teachers aren’t forced to start from scratch. New York also ought to establish protected, compensated planning time dedicated specifically to portrait work, rather than compelling teachers to be stretched even thinner during their existing prep periods. And a state-funded, standardized digital platform would ease the administrative burden around creating and maintaining portrait-of-a-graduate student records. Plus, when students move, everyone will benefit if their evidence moves seamlessly with them—not across disparate systems cobbled together by different districts.

The most serious challenge emerging from the new framework, however, will be maintaining rigorous, consistent baseline expectations for all students. Research shows that higher expectations translate into more student learning. But when “exhibits of evidence” are to be designed, administered, and scored by the students’ own teachers, there’s little incentive to hold students to high expectations. In fact, incentives point in the opposite direction: Teachers typically want their students to graduate, and they want themselves and their schools to earn good ratings.

The official language around the portrait-of-a-graduate framework already implicitly encourages “leveled” assessments, celebrating the flexibility to adapt to “local context, community priorities, and district readiness” (emphasis mine). But such flexibility invites lowered expectations and poses tremendous equity risks. First, disadvantaged students are already more likely to receive assignments that aren’t challenging enough. What’s more, if New York lacks a consistent measure of student performance, then there is no way for the state to know which students are being underserved. Rather than revealing where students need more resources, an inconsistent assessment system will conceal those needs. In a state with huge disparities in district size, capacity, and prosperity, this is a systemic disservice.

The current guidance describes a plan for calibration, such that teachers across schools will be trained to score “exhibits of evidence” comparably. Despite the common rubric, I’m skeptical that it’s possible to ensure comparable scoring of entirely different tasks, but even in the best-case scenario, calibration isn’t enough to combat the powerful, systemic incentives to pass one’s own students.

When possible, “exhibits of evidence” should be scored blindly or by external graders to maximize objectivity. New York should also consider developing a handful of statewide anchor tasks; schools could be required to choose a small number of tasks from a limited menu, which would boost consistency while allowing flexibility for the remaining “exhibits.” These tasks could still include end-of-course exams; Massachusetts, for example, has proposed a “portrait of a learner” model that still includes end-of-course testing, with equity as a stated rationale. And accountability matters: Both the “exhibits” and the scoring should be subject to auditing, and data should be publicly reported.

New York is set on its highly questionable course. But realizing the promise of the new portrait-of-a-graduate framework—that every student will be prepared for what comes next—will depend on whether the state builds a system that’s consistent and rigorous, or settles for one that clings to abstract ideals. There’s still time to shape the plan so that New York doesn’t become another cautionary tale.

Policy Priority:
High Expectations
Topics:
Accountability & Testing
Curriculum & Instruction
Governance
Harry Anthony Patrinos
8.27.2026
Child upset while reading
Getty Images/April Story
Listen to this article
Loading the Elevenlabs Text to Speech AudioNative Player...

More than a dozen states now require that third graders who can’t read at grade level repeat the grade rather than advance to fourth, where every subject assumes literacy. The theory is sound. But in state after state, exemptions meant for a narrow set of students are being granted so widely that the policies aren’t benefiting the students they were designed for.  

Arkansas, the state I know best, is the latest to confront this problem. I wrote earlier this year that its version of a retention law—called the LEARNS Act and modeled in part on Mississippi’s approach—would only succeed if exemptions are paired with mandatory support. This year was the first in which Arkansas enforced the legislation, and third-grade reading proficiency climbed from 35 percent in 2024 to 43 percent, according to recent data. But exemptions were granted at alarming rates in some places. In North Little Rock, for example, more than half of students who failed the reading standard were exempted and promoted. In Pulaski County Special School District, the same was true of roughly half of the roughly 200 students scoring at the lowest performance level. A provision meant for a narrow set of circumstances is being applied well beyond it.

Or take Ohio, whose “Third Grade Reading Guarantee” had worked well. Retained students made significant gains compared to peers who narrowly avoided retention. But lawmakers functionally repealed the law in 2023, because of political pressure. Now, the state has a massive loophole that permits struggling students to advance based on a parent request.

Something similar happened in Tennessee and Michigan. In the first year Tennessee’s retention law took effect, 60 percent of third graders fell short in reading, but only 1.2 percent were actually retained. In Michigan, exemptions were granted to students based on parental request or an existing individualized education program (IEP), and as a result, fewer than seven in 100 eligible students were held back. So like Ohio, Michigan simply removed the requirement instead of narrowing the loopholes.

The problem with all of this backtracking is that research on retention generally shows that it works. The foundational study of Florida’s policy found that students who were held back made substantial gains in reading proficiency compared to promoted peers, and that the gap widened in the second year. A follow-up study found that exemptions were a strong predictor of which low-scoring students moved on to fourth grade without those proficiency gains. And a later analysis that tracked retained students through tenth grade found that retained students took fewer remedial courses and had higher GPAs, compared to peers in the same grade. Two decades of research point in the same direction: Retention plus remediation improves academic outcomes, and exemptions prevent those gains.

Considering the state of American education, states should reverse this trend and restore the strength of their retention policies. Arkansas’s fourth-grade NAEP scores hit a 21-year low in 2024, for example, and the national trend isn’t much better. Third grade is when children stop learning to read and start reading to learn. A 2012 analysis of nearly 4,000 children found that 16 percent of students who aren’t reading proficiently by third grade fail to graduate high school on time. For proficient readers, it’s just 4 percent. And the gap widens for children living in poverty.

This is not an argument against exemptions themselves. Students who, for example, have significant disabilities or limited time in English instruction need a different bar. But as Arkansas’s education secretary, Jacob Oliva, said in September 2025: Low-scoring students who advance to fourth grade without real intervention will keep struggling regardless of the paperwork.

The fix is the same everywhere: Strengthen the rules. Most importantly, permit only good-cause exemptions. Second, require that those exemptions be paired with proven, documented, monitored supports. Arkansas, for example, already funds individualized reading plans, high-impact tutoring, literacy coaches, and a $1,500 family tutoring grant. Make these a condition of promotion for exempted students.

Mississippi requires this of every exempted student, and it is a large part of why Mississippi’s version of the reform has held up where others haven’t. Other states with retention policies should follow suit before exemptions leave their neediest students without the support these laws were designed to provide.

Policy Priority:
High Expectations
Topics:
Curriculum & Instruction
Governance
Teachers & School Leaders
Daniel Willingham
8.27.2026
Students writing with pencil and paper
Getty Images/Sumala Chidchoi
Listen to this article
Loading the Elevenlabs Text to Speech AudioNative Player...

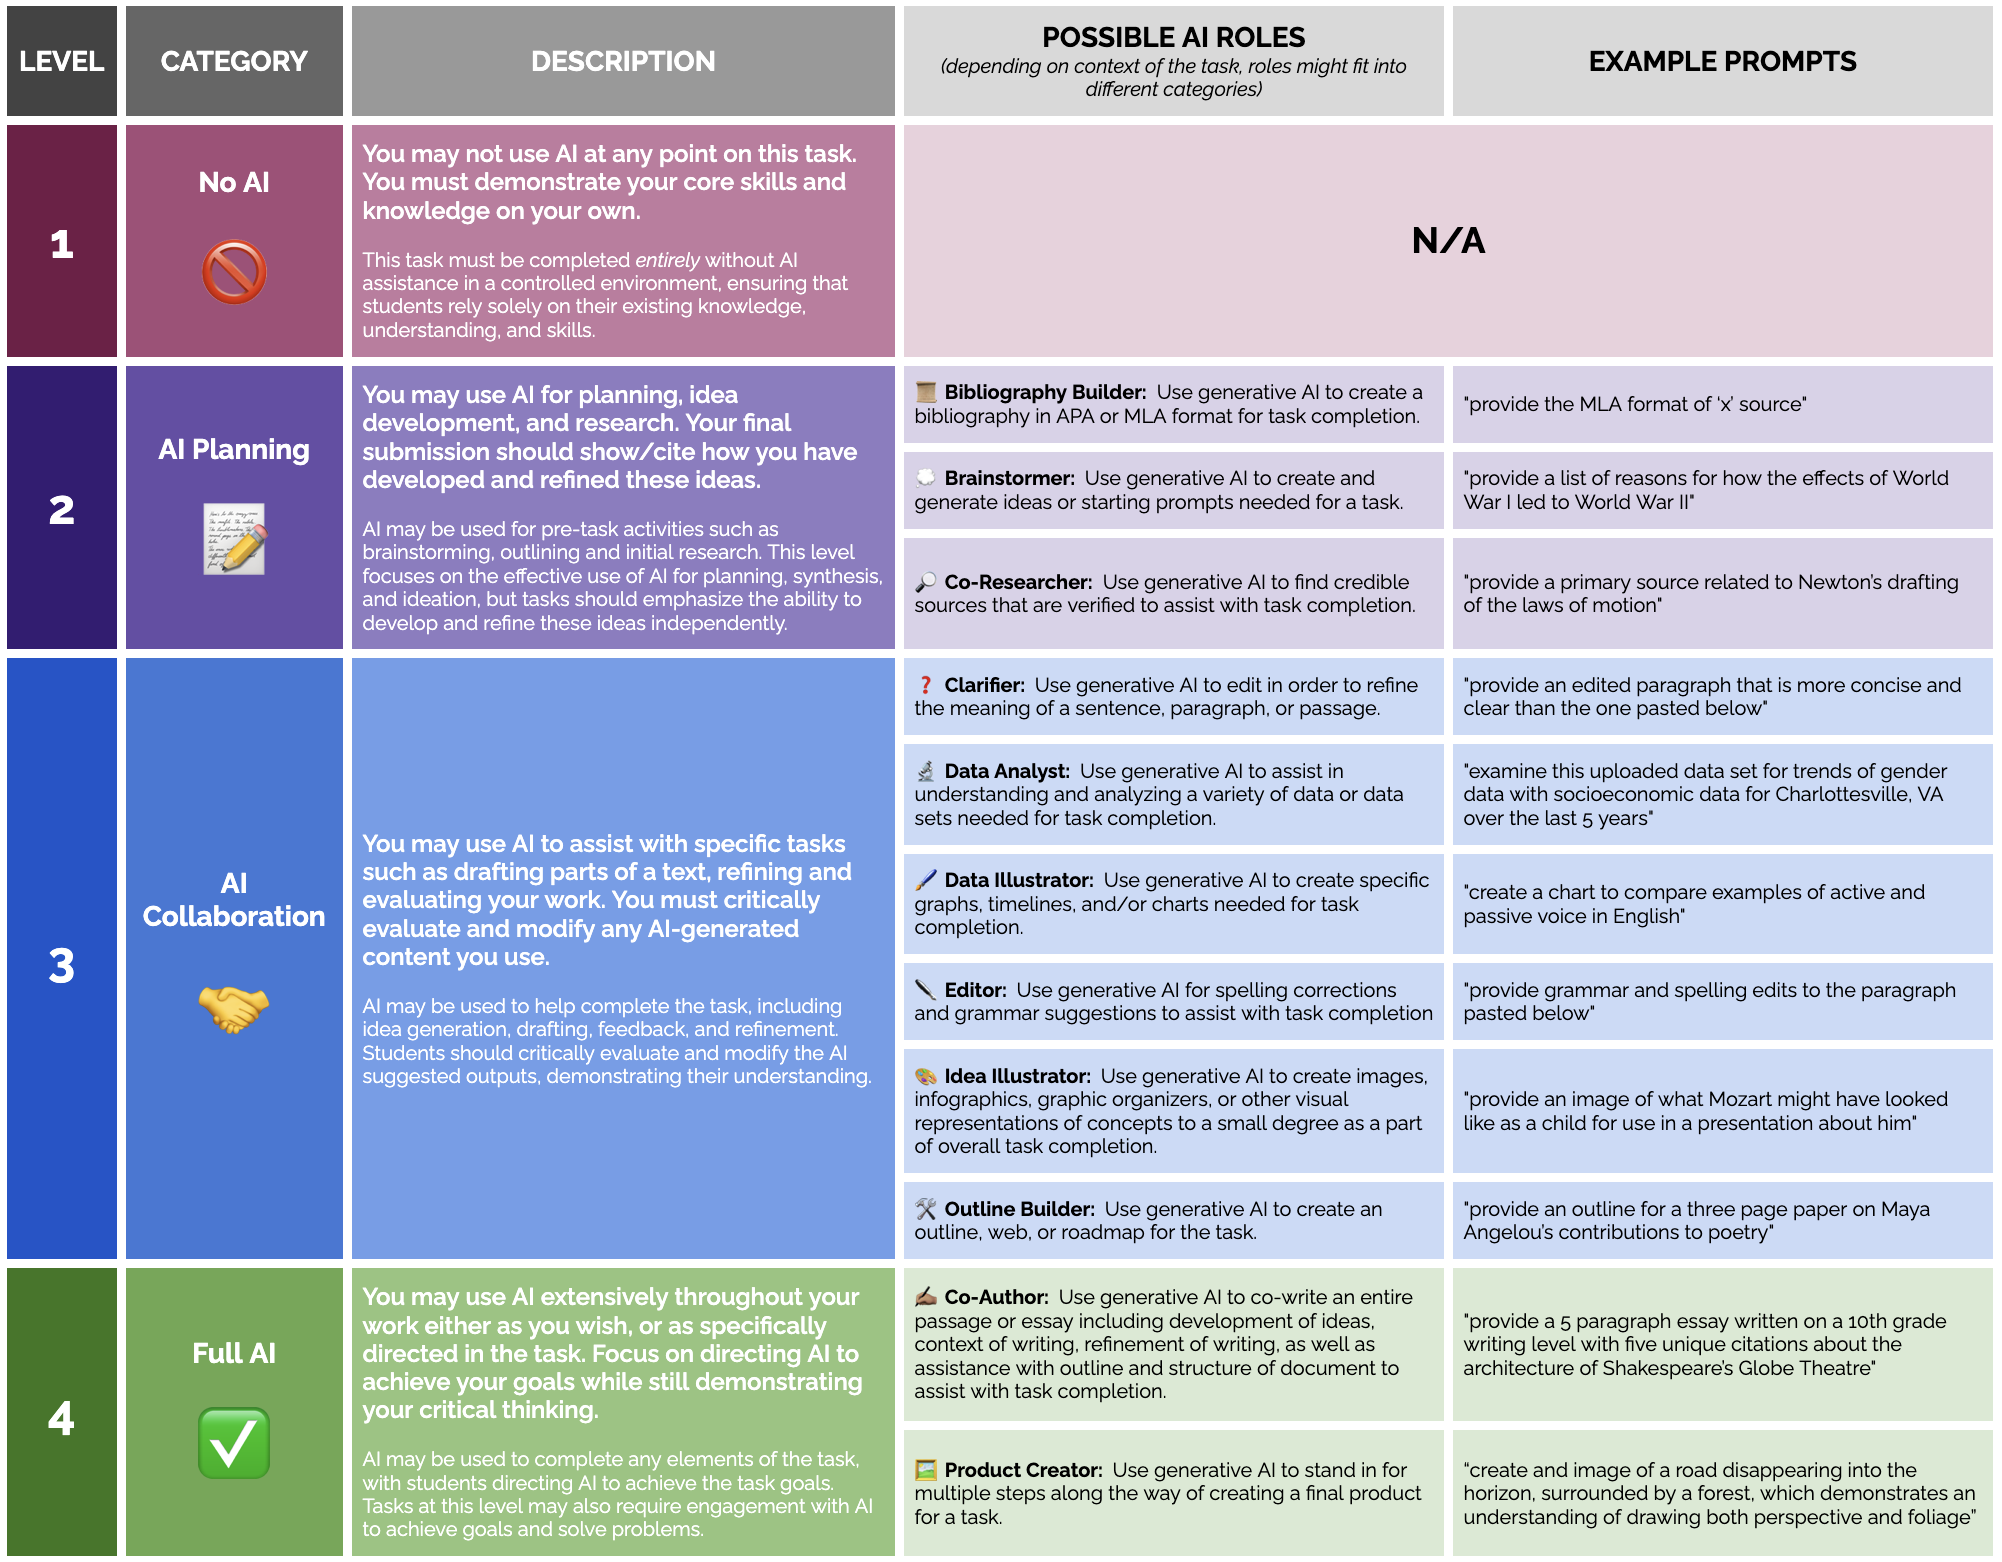
Most educators agree that there should be some guardrails regarding how students use AI in their independent work. Here, I argue for this guiding principle: Students should only use AI for things that they already know how to do well.

A story is told about Harold Alexander, British field marshal in command of the evacuation at Dunkirk. At the end of the workday he had the habit of taking any correspondence still in his “in” tray and simply putting it in the “out” tray. When his assistant once asked about it, he said, “You’d be surprised how little of it comes back.”

That sums up my approach to the winds of educational change. When a new technology appears and people are asking themselves “what about my teaching should change?” my instinct for my own teaching is “change nothing,” partly because I suspect that the excitement is overblown, and partly because I’m happy to let more venturesome people make a change first, and learn from their experiences.

But that strategy can’t be applied in the case of AI. In 2023 I, like every other educator, realized that I had to respond to student access to large language models.

Administrators have had a few years to think through how teachers should change classroom practice to meet the new reality, and many districts have posted guidelines. The policies I have seen have much in common, and I think they are wrongheaded.

(Throughout this post I’m referring to students’ independent use of AI, not to educational software nor to teachers using AI in their work.)

There seems to be widespread agreement that there’s a problem, and even on how to characterize it. Learning is a product of engaging in mental work, and students may use AI to replace that mental work and hence, not to learn. The question is what to do about it.

Almost no one advocates for “no restrictions on independent AI use” nor for “No independent AI use by students. Period.” The overwhelming majority have taken the position that students should use AI, but there should be limits.

Mashable recently ran an article summarizing the response of the U.S.’s largest school districts. Here are the one-sentence versions, as I read them:

New York City: Students are allowed to use AI for basic “research, exploration, and creative projects.” There must be educator oversight. Los Angeles: No AI use under age 13. Over 13, students can use AI to brainstorm and to edit their text, but students must produce text. Students must cite what AI contributed. Chicago: Students can use AI for tasks like brainstorming and summarizing. They are encouraged to use AI as a study partner.

The policy of my home county (Albemarle, Virginia) is similar. There are published categories of AI support from which teachers may choose.

1

In short, teachers are given a good amount of leeway to allow students to use AI or to forbid it. There is, however, little or no guidance about how that choice should best be made.

These policies share a vibe. The goal is that students use AI as an associate in their work, but the student is still very much the lead. The second goal is that students be honest about exactly what AI has contributed.

This lead/associate orientation makes sense for life after graduation. Once a student is in the workforce, they will use AI to produce products: new ideas, reports, and so on. A guiding principle of “Use AI, but let me see your work” makes sense.

This is not, however, an optimal guiding principle for students. Students produce products, but the product is seldom the point. No one wants to read the papers they write, and the math problems they solve have no practical value. Teachers have them do these tasks because they provide practice in cognitive abilities that we think matter.

Writing is an especially interesting example. Writing a substantial paper requires integrating what you know across multiple sources, formulating a detailed argument, articulating your thoughts precisely, anticipating what your reader knows and can understand, and more.

For many educators, writing papers was the only tool we had to ensure that students engage these cognitive processes. AI took that tool from us, and we don’t know of a good replacement.

This loss was unprecedented. The closest analog might be math problems and calculators or Google Translate for foreign language. But in those cases a teacher could still remind students that they would not have these tools available during in-class assessments. I can’t give my students an in-class assessment that is cognitively comparable to writing a ten-page paper.

So the point of assignments is the mental processes required to complete them, and the point of the mental processes is learning. That seems to suggest a simple litmus test for the use of AI. Artificial intelligence tools should not substitute for tasks wherein students would benefit from doing the mental work themselves.

So…do students learn when they brainstorm? Do they learn when they edit their work? Of course they do. This principle indicates that students should use AI only when doing the work themselves would yield little learning. This guideline echoes how most of us think about calculator use. Once you’ve mastered arithmetic operations, there’s no benefit to hand calculations when you’re solving an algebra problem. But if you’re still learning algebra, don’t use the algebraic functions. The slogan might be:

“Only use AI for what you already know how to do.”

I can see two objections.

First, can’t AI scaffold learning? Part of the learning process is doing things badly. Can’t AI offer pointers for improvement?

I see two problems with this idea. The first is that the novice is not going to be a very good partner to AI in learning. The novice doesn’t know enough to ask good questions. He will give the AI system a vague prompt about the goal of the exercise whereupon AI will sharpen it for the user. Essentially, it will chivvy the user toward the polished product, and the novice will simply accept the suggestions. (Remember, I’m talking about independent use of LLMs, not about a product custom-made to provide instruction. That’s a different matter.)

The second problem I see with AI-as-scaffold is motivational. Sure, students could learn from AI by asking it to critique their work, to generate counterarguments, and so on. And I’m sure some would, some of the time. But I think it’s asking a lot of students—or better, asking a lot of human nature—to expect them to take a much harder mental path for a project in a typical curriculum, even if it is in the interest of their own learning.

A second objection to the principle might be this: even after you reach competence, you still need practice; that will deepen and refine the skill and/or knowledge. For example, if a ninth-grader can write a good paragraph, is it now okay for AI to write paragraphs for the student?

If students are competent, a teacher should ask whether doing the task themselves is still part of what students are meant to learn or practice. When students are writing, editing, reasoning, problem solving, or brainstorming (for example), the mental process is usually the thing. You don’t want the help of AI because it replaces the mental work that contributes to learning.

The alternative is that AI is replacing a task that merely supports the actual mental work you want the student to do; the replaced task was soaking up the students’ time and energy and providing no benefit. That would be the college student hand-calculating long multiplication problems required for her engineering problem set.

For this reason I add the word “well” to the candidate principle: “Students should only use AI for things that they already know how to do well.”

Now of course there’s a judgment to be made here. A physics teacher might think “It’s great that AI will polish my students’ writing for their lab reports” whereas someone else might argue “your students need to learn to write in your class too.” But of course this problem is not new. We’re just seeing the issue in a new guise.

We’ve all heard “They’re going to have to learn to use AI.” But I think that slogan applies to how students will use AI at home and in the workforce, where the product is the thing. For students, learning is the thing. That’s how I come to the principle, “Students should only use AI for things that they already know how to do well.”

Editor’s note: This was first published on the author’s Substack.

Policy Priority:
High Expectations
Topics:
Curriculum & Instruction
Teachers & School Leaders
Mike McShane
8.27.2026
Students walking to school
Getty Images/Rawpixel
Listen to this article
Loading the Elevenlabs Text to Speech AudioNative Player...

“If you build it, they will come” makes a great tagline for a mythical baseball movie but a poor strategy for educational improvement. Markets are not magic and are shaped by external factors that encourage or discourage participation.

School choice programs are no exception. How they are structured, how much money they offer, what regulations they place on families and providers, and more will determine if schools choose to participate and the level to which they will choose to participate.

For researchers, the fact that some states have choice programs and some states don’t and some schools choose to participate and some schools don’t provides the variation necessary to understand the differences in participation rates.

A new paper by Matthew Lee, Benjamin Scafidi, Roger Tutterow, and Damian Kavanagh does just that. Using a brief survey of 473 private school leaders, they collected information on school characteristics, including ethos (Liberal arts, Montessori, Classical, etc.), methods (language immersion, boarding, single-gender, etc.), enrollment, tuition, and private school choice program participation.

They then used some fancy statistical modeling to examine what factors are correlated both with participation in choice programs as well as the timing of that participation.

Here are the key findings:

In our preferred specification, we find ceteris paribus that religious private schools are nine percentage points more likely to participate (p < .10); private schools in the northeastern US (Pennsylvania and Maine in our sample) are 23 points more likely to participate than schools in the southeast (p < .01); and private schools that are specialized to focus on special needs students are 39 points more likely to participate in choice programs (p < .001), where the reference category on school type is private schools that are neither religious nor designed to serve only or mostly special needs students. Private schools with tuitions above $20,000 are 33 points less likely to participate than schools with tuitions below $20,000 (p < .001). Finally, small private schools that serve less than 250 students are 14 points less likely to participate in choice programs than larger private schools (p < .01).

With respect to timing, they found:

Among private schools participating in choice programs at the time of our survey, 43% participated in choice program at launch, but 40% of participating schools “waited” an average of 7.35 years to participate (SD = 6.15, ranging from one to 28 years); and the remaining 17% of participating schools were unsure about the first year of program participation.

I think of these findings as falling into three buckets: ones I expected, ones I didn’t expect, and ones that I can’t really make heads or tails of.

Expected findings

That schools whose tuition far exceeds the scholarship value do not participate should not surprise us. Given the smaller dollar value of scholarships in many of the states studied, it also shouldn’t surprise us that smaller schools are less likely to participate, as larger schools can take advantage of economies of scale that stretch the scholarship dollar.

The special needs finding might seem surprising, but given the fact that many programs are specifically for students with special needs and others plus up the value of scholarships for students with special needs, the fact that those schools participate at higher rates makes perfect sense.

Unexpected findings

I was surprised at the mean time schools waited to participate in choice programs. I wasn’t surprised that a healthy chunk of schools chose to participate from the outset and another sizeable chunk decided to wait and see, but I would have thought that waiting and seeing would have happened for a shorter period of time than nearly seven and a half years. What became apparent in year seven that wasn’t clear in year six or year five? That one is worth thinking about and trying to unpack.

Not sure what to do with these

I don’t really know what to think about the regional differences in participation. Why Northeastern schools are more likely to participate than Southeastern ones is not clear to me. Perhaps digging into the specific states and the funding/regulatory combinations would explain that.

Takeaways

Matt Continetti wrote a wonderful piece for the Wall Street Journal at the end of July titled Milton Friedman was Right. When thinking about research like the paper above, I sometimes ask WWMT (What Would Milton Think)?

I imagine he would tell me that organizations respond to incentives. If they get enough money to cover their tuition costs, they’ll participate in the program. If they get additional funding for students with special needs, they will enroll them. If they don’t, they won’t.

This is why, for years, I’ve been a sliding scale guy. I think that the amount placed in a student’s ESA should vary based on his or her needs. John broke down how the Arizona ESA program has a series of plus-ups for students with different identified disabilities, and how that varied funding has ensured that the program serves children at all points on the spectrum of special needs.

The same could be true for student disadvantage or anything else that we think might cause a child’s education to cost more. More disadvantage, more money. It is how public school funding formulae work. What is good for the goose is good for the gander.

But regardless of my half-baked thoughts, this was an interesting and thought-provoking paper that everyone should check out.

Editor’s note: This was first published on the author’s Substack, Informed Choice.

Policy Priority:
Quality Choices
Topics:
Evidence-Based Learning
School Finance
Charter Schools
Governance
Private School Choice
Jeff Murray
8.26.2026
Gadfly Bites logo
Listen to this article
Loading the Elevenlabs Text to Speech AudioNative Player...

News stories featured in Gadfly Bites may require a paid subscription to read in full. You have been warned.

  1. As the new school year gets fully underway across Ohio, NBC 4 News is here to remind us that this is the first full year that all Ohio schools are subject to a bell-to-bell cellphone ban for students. (NBC 4 News, Columbus, 8/26/26) The first day for most Norton City Schools students was last Thursday. Which means that today is the first No-Tech Wednesday of the school year, a new rule requiring students (and teachers too) to put their devices aside for screen-free learning one day per week. District leaders are using the catchphrase “Teach Like It’s 1999” to boost the effort, which superintendent Bryan Farson explains: “This is not about turning back the clock. It is about recommitting ourselves to the instructional practices that have always been the foundation of great teaching.” Given the report card standing in Norton, it’s likely that whatever they’re doing is going to turn out just fine. (Akron Beacon Journal, 8/26/26)

  2. Meanwhile, here’s an interview with three students attending Franklinton High School, a dropout recovery charter school in Columbus. The reportorial focus is the amount of missed days they all racked up at previous schools and the reasons for it, but their candid answers reveal a lot more than that. They were all so disconnected from school for various reasons that even when they showed up, it doesn’t sound like they were learning too much…or caring about it one way or another. (ABC 6 News, Columbus, 8/24/26) Ditto for this companion piece which digs into the ways in which Franklinton High School has reduced its chronic absenteeism rate—by 30 percent—over the past three years. Their efforts include buying multiple small transit vans to pick up kids who might need a ride from time to time. But again—there’s more to it than that. “We have to build trust with them so that they trust us and know that we’re going to take care of them and help them,” principal Jennifer Griffith explained. “That hasn’t always been their experience.” Reading about the students’ new focus on education and their future plans in the previous piece, I believe her. (ABC 6 News, Columbus, 8/24/26)

Did you know you can have every edition of Gadfly Bites sent directly to your Inbox? Subscribe by clicking here.

Policy Priority:
School Funding
Topics:
Governance
Aaron Churchill
8.25.2026
20 mill floor blog image
Getty Images/rudall30
Listen to this article
Loading the Elevenlabs Text to Speech AudioNative Player...

Ohio’s school districts receive and spend more money than ever before. Hard to believe, given headlines about “starving” public schools, but it’s true.

In fiscal year 2025, public schools spent on average $16,976 per student, or 17 percent above spending in 2013 (adjusted for inflation). In urban districts such as Columbus and Cleveland, spending exceeded $25,000 per pupil—amounts that we’re more accustomed to seeing in high-tax coastal states like New Jersey and New York. Even in some rural areas of Ohio, spending has passed the $20,000 mark: $20,449 per pupil in Zanesville, $20,479 in Lima, and $23,609 in Mansfield.

But none of this has stopped the public school establishment from clamoring for more money—billions more. In their bid for more funding, they have pushed a narrative of state “disinvestment” in public education. In one press release, picked up by a major news outlet, district officials claimed that the “state’s share of K–12 school funding has fallen to a historic low near 32 percent.”

The statistic is pure deception. As discussed in an earlier piece, the 32 percent “state share” refers to an obscure mechanism inside the funding formula, not the actual percentage of funding provided by the State of Ohio versus the amounts raised locally. When accounting for all state funds for school districts, the true “state share” was 44 percent in 2024–25, which is in line with historic norms.

But even this percentage (44 percent) understates the true role of state government in financing public education. One policy that often goes unacknowledged by critics is the state-required minimum local property tax. While not officially “state revenue,” these dollars are guaranteed under state law and remain an essential element of districts’ foundation funding. But what exactly is this indirect form of state aid and how much does it generate for districts?

Under Ohio law, school districts must maintain a property tax rate of at least 20 mills (or 2 percent) to receive state formula funding. In essence, the provision guarantees that all Ohio districts receive baseline local tax support, as districts can remind voters they must approve this minimum tax rate, lest they forfeit millions in state aid. Furthermore, state law establishes a millage floor at 20 mills to protect districts from having their tax rates reduced below this mark due to tax reduction factors—longstanding state policies that shield citizens from tax hikes due to property inflation.  

Taken together, these state laws establish a minimum local tax effort. In practice, every district today levies at least 20 mills of property tax, with many districts taxing at rates above the floor with voter approval. Because districts generate widely varying sums based on their property base, Ohio’s progressive funding formula sends more “direct” state aid to property-poorer districts (and less to wealthier ones).[1] Public charter schools and private schools receive zero local tax revenues,[2] so the state itself shoulders full responsibility for funding these options.

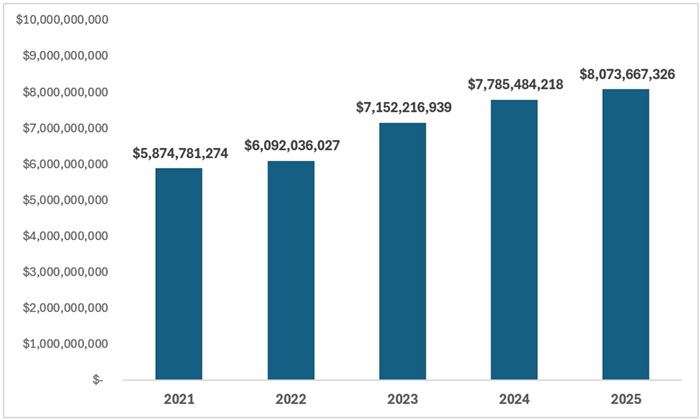
How do the 20 mills translate into dollars and cents? As Figure 1 shows, the minimum tax requirement generated $8.1 billion for school districts in 2025, or $5,514 per student. This is well above the $5.9 billion collected through the 20 mills in 2021—a reflection of rapidly increasing property values as well as property development.[3] In percentage terms, district revenues from the 20 mills rose by 37.4 percent from 2021 to 2025, more than doubling the general inflation rate (up 16.1 percent, as measured by CPI).

Figure 1: Funds received by Ohio school districts via state-required 20 mill property tax

20 mill floor blog figure 1
Source: Author calculations based on the Ohio Department of Taxation SD-1 reports for CY2021 to 2025. Notes: Dollars are not inflation-adjusted. Amounts include revenues generated on both class I (agricultural and residential) and class II (commercial, industrial, mineral, and railroad) property. Calculations exclude JVSD millage. The SD-1 files report “effective” property tax rates for current expenses (after tax reduction factors are applied).

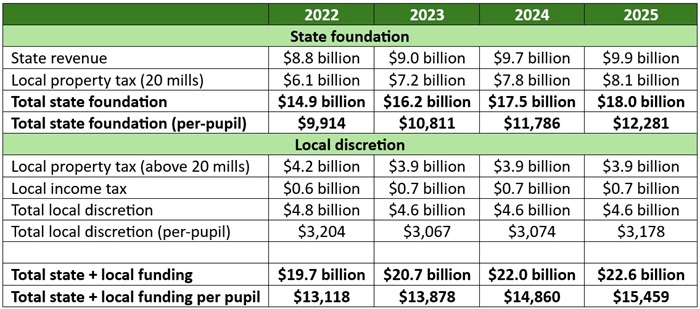
Direct state support combined with the 20 mill property tax provided Ohio school districts with $18.0 billion in total foundation funding in 2025—about $3.1 billion more than they received through these funding components in 2022. As noted earlier, districts can further supplement by asking voters to approve tax rates above the millage floor or a local income tax. During this period, these local “optional” dollars amounted to $4.6 billion to $4.8 billion dollars, boosting districts’ total state-and-local haul to $20 billion to $23 billion per year.

Table 1: Funding broken down by revenue source, Ohio traditional school districts

20 mill floor blog table 1
Source: State revenue, Ohio Department of Education and Workforce, Expenditure Rankings reports (FY2022 to FY2025); local income tax, Ohio Department of Taxation SD-2Q reports for FY2022 to FY2025; see note under Figure 1 for local property tax source. Notes: Dollars are not inflation-adjusted. Table excludes federal funds and non-tax revenues.

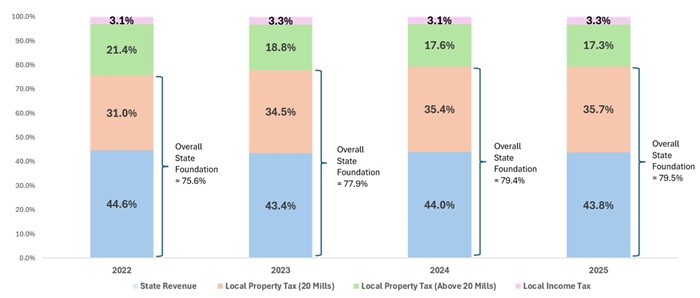
As Figure 2 indicates, the indirect state aid generated via 20 mills plus direct state revenues add up to 75 to 80 percent of district funding—a far cry from the 32 percent “state share” that critics have peddled. Only 20 to 25 percent of districts’ funding could be viewed as purely discretionary local funding.

Figure 2: Percentage of district funding generated by “direct” state revenue plus state-required local millage

20 mill floor blog figure 2

Claims that the State of Ohio “starves” or “underfunds” school districts unravel in light of a proper understanding of the overall funding system. State law effectively guarantees districts 20 mills of property taxes, a rate that generates billions to educate students. These dollars must not be forgotten or ignored in debates over the state’s overall investment in public education.


[1] As an example, Upper Arlington (wealthier) received $1,098 per pupil in state formula funding in 2026, while Whitehall (poorer) received $11,699 per pupil in state formula funding. Upper Arlington, however, generated $9,081 per pupil on the 20 mill property tax, while Whitehall generated $2,296 per pupil.

[2] The only exception is a handful of partnership charter schools located in Cleveland that receive a modest sum in local tax revenue.

[3] During this period, residential and agricultural values (class I property) rose from $233 to $331 billion statewide, while class II property (commercial, industrial, mineral, and railroad) values increased from $61 to 72 billion.

Policy Priority:
School Funding
Topics:
School Finance
Jeff Murray
8.25.2026
Teen survey data SR image
Listen to this article
Loading the Elevenlabs Text to Speech AudioNative Player...

How are today’s teenagers different from previous generations? Daniel Cox, a senior fellow at AEI and director of their Survey Center on American Life, dug into some new data to find out. The American Teenagers Survey project raises the specter of today’s young people eschewing traditional teen experiences—like eating regular family meals, reading for pleasure, and spending time with friends—in favor of whiling away hours a day on social media, playing video games, and trying to figure out the future.

Survey responses come from NORC at the University of Chicago’s AmeriSpeak, a probability-based panel designed to be representative of the U.S. household population, including all 50 states and the District of Columbia. Teenagers (13–17) were recruited to AmeriSpeak via parents/guardians who were already part of the panel. Cox’s sample consisted of 782 teens who completed the entire survey—self-administered online—in January and February of 2026. Three stages of weighting were conducted to align the final survey sample to specific population benchmarks drawn from the U.S. Census Bureau’s Current Population Survey as of March 2025.

Let’s start with a few data points on those traditional teen experiences. Only 37 percent of survey respondents said they share meals as a family every day, and 33 percent indicated this occurs no more than once a week. The older the teens, the lower the percentages. About one in three said they read a book for fun within the last week, roughly the same proportion who said they seldom or never do. Fifteen percent reported having a part-time job. Travel sports and music declined among older teens. And other traditional routines were also uneven, with one in four teens helping with household chores, and one in five seldom or never attending religious services.

How do today’s teens fill their time? Overall, 35 percent of respondents said they spent at least four hours a day on social media or playing video games. Short-form video platforms like YouTube and TikTok were the most-visited sites, and about 44 percent of teens spent at least an hour gaming every day. Thirty-five percent of teens said they seldom or never used AI chatbots; about one in five (21 percent) reported “irregular use,” a category that ranged from once or twice a month to a few times a year. There is, unfortunately, no differentiation as to whether any of this online time or device usage is required (schoolwork, college applications, job requirements, etc.) or voluntary.

Various aspects of family structure play strong roles in teens’ daily lives. Respondents with college-educated parents were more likely to participate in numerous extracurricular activities, including sports and school-sponsored clubs, than those whose parents did not have a four-year college degree. Just 37 percent of teenagers with divorced parents reported feeling very or completely satisfied with their lives, as compared with 55 percent of teens whose parents were married. Respondents with married parents also reported higher evaluations of their personal health and more satisfaction with their familial relationships than their peers with divorced parents.

One particularly bright spot concerns friendships. Sixty percent of teenagers reported they had four or more close friends, and another 34 percent said they had between one and three close friends. Only 2 percent of respondents said they had no close friends. And despite the long hours spent online, a majority of those with friends (55 percent) said they spent time with them—in person and outside school hours—at least once a week.

When it comes to their post-graduation options, approximately 48 percent of respondents planned on going to a four-year college after high school. Seventeen percent planned on enrolling in a two-year college or a vocational program, 10 percent were planning on a full-time job out of high school, and 3 percent planned on military enlistment. Eighteen percent of teens reported being uncertain about what they will do after high school graduation. Sixty percent of girls were planning on a four-year college, compared to 36 percent of boys. More boys than girls were planning for vocational school or getting a full-time job. More boys than girls also said they were unsure about their post-graduation plans.

What does the long-term future hold for today’s teens? In a word: traditional. Large majorities of respondents said they were very or extremely likely to find rewarding and good-paying jobs, to own their own home at some point in the future, and to marry someone “they really like.” Nearly 43 percent of teens said they are very or extremely likely to have children in the future, 30 percent said they are somewhat likely to have kids, and the rest said they are unlikely to or not interested at all in starting a family. Respondents from college-educated households were far more optimistic about their own college plans, ability to earn a living, and achieving the American dream of home and family than their peers whose parents did not have college degrees.

There’s lots more to unpack in these survey results, but the gist seems clear enough: Today’s teens may lead different, more-plugged-in lives from those of previous generations, but they still generally aspire toward traditional adult lives. Cox focuses heavily on reported technology use among teens in his conclusion, especially overuse among certain groups, noting that “it is their technology use that makes their formative experiences so distinctive” from their predecessors. But even in our rightful concern about the prominence of influencers both real and artificial in young Americans’ lives, we shouldn’t forget that some of those predecessors are their own parents and grandparents. Family ties and familial examples still serve to shape the lives and futures of young Americans today. The stronger and more connected our teenagers are to positive role models, mentors, and success stories, the better they can plan for—and reach—their own future goals.

SOURCE: Daniel A. Cox, “A Digital Divide in American Adolescence: Gender, Class, and the New Teenage Experience,” American Enterprise Institute (July 2026).

Policy Priority:
Standards & Accountability
Topics:
Personalized Learning
Jessica Poiner
8.24.2026
Teacher pipeline blog image
Getty Images/Jacob Wackerhausen
Listen to this article
Loading the Elevenlabs Text to Speech AudioNative Player...

A few years ago, teacher shortages were a hot topic in Ohio. In the wake of the pandemic, a perfect storm of issues—too few students enrolling in or graduating from teacher preparation programs, too many veteran educators retiring, teacher burnout, and low pay—coalesced to elevate a familiar, consistent concern into somewhat of a public panic. Seeking solutions, policymakers established two statewide initiatives aimed at strengthening Ohio’s teacher pipeline.

First, as part of the state budget in 2023, lawmakers established the Grow Your Own Teacher Scholarship Program. Grow Your Own (GYO) programs are so named because they focus teacher recruitment efforts on people living in local communities: paraprofessionals and substitute teachers who already work in schools, professionals who are looking to change careers, and high school students who are interested in education as a future career. As part of Ohio’s program, eligible high school seniors and school employees who committed to teaching in a qualifying school for at least four years after graduating from a teacher training program were awarded scholarships of up to $7,500 for up to four years.

Second, just a few weeks after Governor DeWine signed the aforementioned state budget into law, he unveiled a teacher apprenticeship initiative that added K–12 teaching to the state’s list of registered apprenticeship occupations. Apprenticeship programs offer workers job-related classroom training, on-the-job learning experience under the supervision of an experienced mentor, and pay for their work. Ohio’s teacher-based model allows postsecondary educator preparation programs to work alongside K–12 districts to establish apprenticeships for employees already working in schools—staff like teachers’ aides, librarians, and bus drivers. The goal is to provide a pathway into the classroom that’s flexible for those with various levels of experience and schooling and offers credit for prior experiences.

Together, these initiatives could boost the overall number of teachers in Ohio. They could also be used to target persistent shortage areas. GYO programs, for example, can be specifically designed to recruit and train educators in hard-to-staff subjects, grade levels, or communities (like rural areas). Apprenticeship programs, meanwhile, can make teaching a more financially accessible option, as apprentices are paid for their time and often avoid student debt.

Unfortunately, after establishing these options, state policymakers took their eye off the ball. Now, neither program is living up to its potential.

Ohio’s GYO scholarship program proved to be hugely popular. Two hundred applications were completed during the 2024–25 cycle. A whopping 639 were completed for 2025–26. Clearly, there was an appetite for this kind of opportunity. But lawmakers opted not to allocate additional funding in the state budget for FY 2026 and 2027. Without money to fund new scholarships, the program is no longer accepting new applications. If lawmakers continue to withhold funding in future budgets, the program will basically cease to exist once current scholarship recipients earn their degrees. If Ohio really is facing a teacher shortage, it’s a shame that an innovative program like this—one that could open doors for non-traditional teachers—has fallen by the wayside.

Teacher apprenticeships, meanwhile, are still technically an option. But just like with GYO programs, lawmakers opted not to set aside any dedicated funds to support them. Rumor has it that plenty of districts and higher education institutions were interested in collaborating to establish apprenticeship pathways. But without state funding to help cover the costs, very few opted to participate. As of this writing, the Ohio Department of Higher Education website directs prospective teachers to the Apprentice Ohio Dashboard, where it says they can find a current sponsor. But clicking the “Find an Apprenticeship Here!” button and using the drop-down menu to search for opportunities for “teachers and instructors” reveals only five sponsors.[1] Huge swaths of the state—especially the northern half—appear to have no opportunities available. 

To be clear, lawmakers didn’t maliciously abandon either of these initiatives. There doesn’t seem to have been any political pushback or concerns about quality or feasibility. It just came down to dollars and cents. Money doesn’t grow on trees, which means state budgets are all about tradeoffs. These two programs aren’t the only ones with considerable potential that ended up on the cutting room floor.

It’s also worth noting that part of the reason why these efforts fizzled is because Ohio has been flying blind. State and local leaders don’t have access to detailed and consistent data on teacher vacancies. Without this information, it’s hard to make the case that state investment is needed. If lawmakers had hard data clearly demonstrating that teacher shortages were an urgent problem in need of decisive action, they might be more likely to direct state dollars toward these programs.

We’ll soon find out if that’s the case. Starting in the fall of 2027, Ohio leaders will have access to detailed information about teacher vacancies. These data will allow them to identify the regions, districts, schools, subjects, and grade levels where shortages exist. The Department of Education and Workforce will also begin reporting enrollment and completion rates at the state’s educator preparation programs, which should give leaders a much clearer picture of the teacher pipeline.

It’s impossible to predict what these data will show. How lawmakers will respond to potential shortages is also an open question. But Ohio has already done the work to establish two statewide initiatives that could bolster the teacher pipeline. GYO programs and teacher apprenticeships both have a ton of potential. But to capitalize on that potential, policymakers will need to invest.


[1] There are additional options for preschool teachers, education administrators, and teaching assistants.

Policy Priority:
School Funding
Topics:
Teachers & School Leaders

Pagination

  • First page « First
  • Previous page ‹ Previous
  • Page 11
  • Page 12
  • Page 13
  • Page 14
  • Current page 15
  • Page 16
  • Page 17
  • Page 18
  • Page 19
  • Next page Next ›
  • Last page Last »
Fordham Logo

© 2026 The Thomas B. Fordham Institute
Privacy Policy
Usage Agreement

National

P.O. Box 110
Burke, VA 22009

202.223.5452

[email protected]

Ohio

P.O. Box 82291
Columbus, OH 43202

614.223.1580

[email protected]

Sponsorship

130 West Second Street, Suite 410
Dayton, Ohio 45402

937.227.3368

[email protected]