Mobile Navigation

  • National
    • Policy
      • High Expectations
      • Quality Choices
      • Personalized Pathways
    • Research
    • Commentary
      • Gadfly Newsletter
      • Flypaper Blog
    • Events
    • Scholars Program
  • Ohio
    • Policy
      • Priorities
      • Media & Testimony
    • Research
    • Commentary
      • Ohio Education Gadfly Biweekly
      • Ohio Gadfly Daily
  • Charter Authorizing
    • Application
    • Sponsored Schools
    • Resources
  • About
    • Mission
    • Board
    • Staff
    • Career
Home
Home
Advancing Educational Excellence

Main Navigation

  • National
  • Ohio
  • Charter Authorizing
  • About

National Menu

  • Topics
    • Accountability & Testing
    • Advanced Education
    • Career & Technical Education
    • Charter Schools
    • Curriculum & Instruction
    • ESSA
    • Evidence-Based Learning
    • Facilities
    • Governance
    • Personalized Learning
    • Private School Choice
    • School Finance
    • Standards
    • Teachers & School Leaders
    • Think Again
  • Research
  • Commentary
    • Gadfly Newsletter
    • Flypaper Blog
    • Gadfly Podcast
  • Events
  • Scholars Program

The Education Gadfly Weekly

Sign Up to Receive Fordham Updates

We'll send you quality research, commentary, analysis, and news on the education issues you care about.
Thank you for signing up!
Please check your email to confirm the subscription.

The Education Gadfly Weekly: Education policy helped these states beat the socioeconomic curve

Volume 19, Number 29
7.24.2019
7.24.2019

The Education Gadfly Weekly: Education policy helped these states beat the socioeconomic curve

Volume 19, Number 29
view

Education policy helped these states beat the socioeconomic curve

Rapidly improving economic conditions among the country’s poorest families during the 1990s may have been responsible for much of the progress in student achievement we saw in the 2000s. It’s a provocative and compelling national picture. But what about at the state level? Were those where child poverty declined the most the same states where the “below basic” rate dropped the most? In a word, no. There’s a clear reformy slant to the list of high-fliers from that era, and from more recent history, too.

Michael J. Petrilli 7.24.2019
NationalFlypaper

Education policy helped these states beat the socioeconomic curve

Michael J. Petrilli
7.24.2019
Flypaper

Causes and consequences of America’s broken gifted education system

7.24.2019
Flypaper

No apologies for “no excuses” charter schools

Robert Pondiscio
7.24.2019
Flypaper

Widening excellence gap

Chester E. Finn, Jr.
7.24.2019
Flypaper

A debate about unschooling

Robert Pondiscio
7.24.2019
Flypaper

The Education Gadfly Show: What rural Americans think about charter schools

7.24.2019
Podcast
view

Causes and consequences of America’s broken gifted education system

Susan Miller, Tom Coyne 7.24.2019
Flypaper
view

No apologies for “no excuses” charter schools

Robert Pondiscio 7.24.2019
Flypaper
view

Widening excellence gap

Chester E. Finn, Jr. 7.24.2019
Flypaper
view

A debate about unschooling

Robert Pondiscio 7.24.2019
Flypaper
view

The Education Gadfly Show: What rural Americans think about charter schools

Michael J. Petrilli, David Griffith, Ph.D., Amber M. Northern, Ph.D., Danish Shakeel 7.24.2019
Podcast
view

Education policy helped these states beat the socioeconomic curve

Michael J. Petrilli
7.24.2019
Flypaper

Editor’s note: This is the sixth in a series of posts looking at whether the nation’s schools have improved over the past quarter-century or so. The first two demonstrated that student outcomes rose significantly for the lowest-performing students and children of color from the late-1990s until the Great Recession—especially in reading and math, but in other academic subjects, too. The third post argued that this educational progress coincided with dramatically improving conditions for our poorest families. In particular, the “supplemental poverty rate” plummeted for children of color in the 1990s and into the 2000s. The fourth post looked at the potential relationship between poverty rates and academic achievement trends. Finally, the fifth installment argued that standards-based reform and a surge in school spending also deserve credit for rising achievement in the late 1990s into the 2000s.

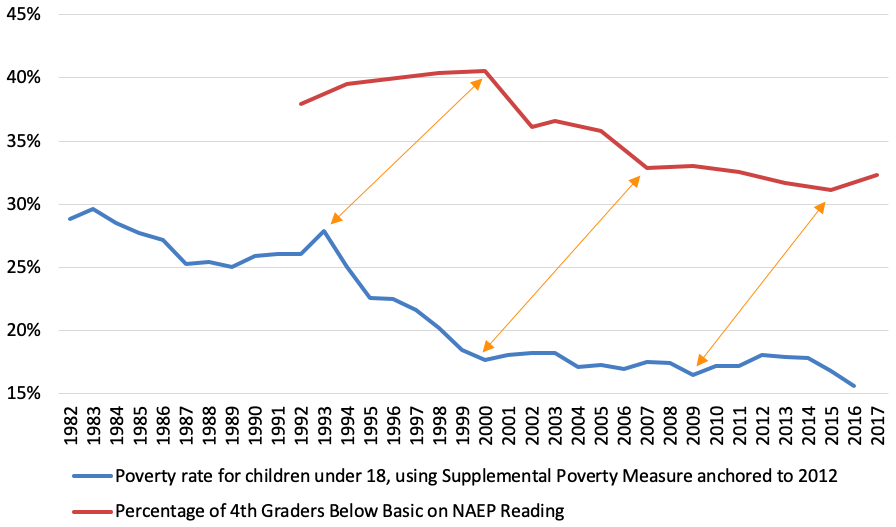
A few weeks ago I presented a hypothesis: that the rapidly improving economic conditions for the country’s poorest families during the 1990s may have been responsible for much of the progress in student achievement we saw in the 2000s. As you can glimpse in the figure below, it appears that significant economic downturns, and upticks, were followed by similar movements on the National Assessment of Educational Progress—about seven years later for fourth grade scores and thirteen years later for eighth grade.

Figure 1. The “below basic in fourth grade reading rate” versus the supplemental child poverty rate
mp1

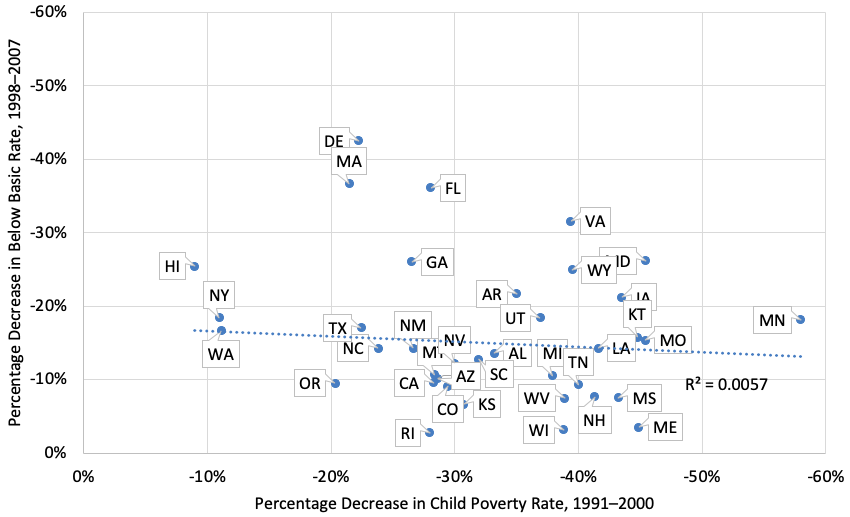
I find that national picture provocative and compelling. Still, I wondered if we’d see a similar pattern at the state level. Were the states where child poverty declined the most the same states where the “below basic” rate dropped the most?

In a word, no.

Figure 2: Percentage change in the supplemental poverty rate (1991–2000) vs. percentage change in the below basic rate in fourth grade reading (1998–2007)
mp2

As is evident, there’s no clear relationship between the change in poverty rates and the change in below-basic rates. One explanation is that my hypothesis doesn’t hold water. Another is that other factors were at work that led to very different results for various states—that the declining poverty rate pushed down the below-basic rate everywhere, but some states went farther faster than we’d predict based on their poverty rates alone.

Let’s see which states went farther and try to understand what else might explain their impressive results.

We’ll start by looking at the change in supplemental child poverty rates in the 1990s versus the change in below-basic NAEP rates in the late 90s into the early 2000s. Think of this as the core of the No Child Left Behind era. Here are the states that did the best.

Table 1. Top ten states for percentage change over time in the child poverty/below basic ratio, fourth grade reading, 1998–2007[1]

State

Children in Poverty, 1991 (%)

Children in Poverty, 2000 (%)

Below Basic, 1998 (%)

Below Basic, 2007 (%)

Change in child poverty/below basic ratio (%)

DE

18.9

14.7

47

27

35.4

MA

24.7

19.4

30

19

24.0

HI

25.6

23.3

55

41

22.1

FL

30.3

21.8

47

30

12.7

NY

30.1

26.8

38

31

9.1

WA

16.2

14.4

36

30

6.7

GA

27.5

20.2

46

34

-0.6

TX

28.5

22.1

41

34

-6.5

NC

23.5

17.9

42

36

-11.1

VA

19.3

11.7

38

26

-11.4

The names on this list should look familiar, given that most of them were the poster children of the early education reform movement. Delaware would later win one of the first Race to the Top grants; Massachusetts is famously the highest achieving state in the nation thanks to the “Massachusetts Miracle” reforms of the 1990s and 2000s; Jeb Bush’s Florida policies have become a model for states nationwide; North Carolina and Texas in many ways inspired the early standards-based reform era. Several of these states also led on scientifically-based reading instruction—notable given these results are for fourth grade reading.

Now let’s see how it looks for other grades and subjects.

Table 2. Fourth grade math, 2000–2007

State

Children in Poverty, 1993 (%)

Children in Poverty, 2000 (%)

Below Basic, 2000 (%)

Below Basic, 2007 (%)

Change in child poverty/below basic ratio (%)

MA

24.3

19.4

23

7

162.3

ND

15.2

12.0

27

9

136.8

MT

20.7

17.7

28

12

99.5

BY

31.5

26.8

34

15

92.8

HI

24.2

23.3

45

23

88.4

AR

25.2

19.5

45

19

83.3

GA

24.5

20.2

43

21

68.8

ID

21.8

17.2

32

15

68.3

KA

18.2

13.3

24

11

59.4

WY

15.7

10.1

29

12

55.5

Table 3. Eighth grade reading, 2003–2011

State

Children in Poverty, 1991 (%)

Children in Poverty, 1999 (%)

Below Basic, 2003 (%)

Below Basic, 2011 (%)

Change in child poverty/below basic ratio (%)

HI

25.6

25.7

39

32

22.4

CT

15.6

13.8

23

17

19.7

NJ

20.7

17.6

21

16

11.6

MA

24.7

20.8

19

16

0.0

WA

16.2

15.1

24

23

-2.7

RI

21.1

16.8

29

24

-3.8

NY

30.1

27.8

25

24

-3.8

MT

24.7

18.0

18

14

-6.3

GA

27.5

21.6

31

26

-6.3

NM

31.9

24.6

38

32

-8.4

Table 4. Eighth grade math, 2003–2011

State

Children in Poverty, 1991 (%)

Children in Poverty, 1999 (%)

Below Basic, 2003 (%)

Below Basic, 2011 (%)

Change in child poverty/below basic ratio (%)

MA

24.7

20.8

24

14

44.4

HI

25.6

25.7

44

32

38.0

NJ

20.7

17.6

28

18

32.3

TX

28.5

22.7

31

19

30.0

WA

16.2

15.1

28

23

13.5

RI

21.1

16.8

37

27

9.1

NM

31.9

24.6

48

36

2.8

GA

27.5

21.6

41

32

0.6

DE

18.9

15.1

32

26

-1.7

CT

15.6

13.8

27

25

-4.5

Some states did well across the board or close to it—namely Delaware, Massachusetts, New York, Texas, Georgia, Hawaii, and Washington. Several of these states displayed impressive reform credentials during that time period. A few of the other states that did well too leave me scratching my head, given that they aren’t known for reform-minded policies, or really much of anything: Montana, North Dakota, and New Mexico (in the pre-Hanna Skandera era) to be exact.

That all feels a bit like ancient history, however. Now let’s look at the more recent results—during a time period when the Great Recession created challenging economic conditions and most states struggled to keep their teachers paid and their achievement scores from declining.

Table 5. Fourth grade reading, 2009–2017

State

Children in Poverty, 2000 (%)

Children in Poverty, 2007 (%)

Below Basic, 2009 (%)

Below Basic, 2017 (%)

Change in child poverty/below basic ratio (%)

IN

10.4

15.6

30

27

66.7

MN

9.0

10.5

30

29

20.7

CA

25.1

25.5

46

39

19.8

MD

11.3

13.7

30

31

17.3

MS

19.3

20.1

45

40

17.2

VA

11.7

13.6

26

26

16.2

RI

15.2

16.6

31

31

9.2

UT

11.8

10.8

33

28

7.9

SD

9.6

10.7

30

31

7.9

AZ

21.7

20.7

44

39

7.6

Table 6. Fourth grade math, 2009–2017

State

Children in Poverty, 2000 (%)

Children in Poverty, 2007 (%)

Below Basic, 2009 (%)

Below Basic, 2017 (%)

Change over time, child poverty/below basic ratio (%)

MS

19.3

20.1

31

23

40.4

IN

10.4

15.6

13

14

39.3

VA

11.7

13.6

15

13

34.1

AZ

21.7

20.7

29

27

2.5

AL

18.1

16.6

30

27

1.9

TN

16.8

14.8

26

23

-0.4

RI

15.2

16.6

19

21

-1.2

NE

11.6

9.5

18

15

-1.7

CA

25.1

25.5

28

29

-1.9

FL

21.8

18.3

14

12

-2.1

Table 7. Eighth grade reading, 2009–2017

State

Children in Poverty, 2000 (%)

Children in Poverty, 2007 (%)

Below Basic, 2009 (%)

Below Basic, 2017 (%)

Change over time, child poverty/below basic ratio (%)

IN

10.4

15.6

21

18

75.0

CA

25.1

25.5

36

28

30.6

RI

15.2

16.6

28

25

22.3

AZ

21.7

20.7

32

25

22.1

MI

14.9

15.0

28

24

17.4

MS

19.3

20.1

38

34

16.4

NV

16.1

15.4

35

29

15.4

VA

11.7

13.6

22

23

11.2

MD

11.3

13.7

23

26

7.2

GA

20.2

18.0

28

24

4.0

Table 8. Eighth grade math, 2009–2017

State

Children in Poverty, 2000 (%)

Children in Poverty, 2007 (%)

Below Basic, 2009 (%)

Below Basic, 2017 (%)

Change over time, child poverty/below basic ratio (%)

IN

10.4

15.6

22

25

32.0

VA

11.7

13.6

24

23

21.3

MS

19.3

20.1

46

41

16.8

CA

25.1

25.5

41

38

9.6

AZ

21.7

20.7

33

29

8.5

RI

15.2

16.6

32

34

2.8

MN

9.0

10.5

17

20

-0.8

MI

14.9

15.0

32

33

-2.4

TN

16.8

14.8

35

32

-3.6

NV

16.1

15.4

37

38

-6.9

Now we have a new set of states in the winner’s circle. Knocking it out of the park is Indiana, winner of our Ed Reform Idol contest, which faced brutal economic conditions after the Great Recession but made progress in some grade levels nonetheless. California also placed on all four lists—intriguing evidence that the Jerry Brown/Mike Kirst effort to boost funding while driving decisions to the local level may be paying off. Rhode Island hit a grand slam, too—way to go, Deb Gist. Arizona crushed it as well—someone tell Matt Ladner—perhaps because of its combination of widespread choice and thoughtful standards-based reform. Race to the Top favorite Tennessee scored in two categories. Florida is back on the list, this time for math instead of reading. And don’t overlook Mississippi, which has been making sure and steady progress even as its neighbor to the west, Louisiana, gets all of the national attention.

Several of these states are the same ones that look impressive according to “America’s Gradebook,” an analysis from Matt Chingos and his team at the Urban Institute—even though theirs is a snapshot in time, and mine examines progress over almost a decade.

To be sure, some states present a puzzle—they haven’t been particularly bold on reform, or generous on spending, yet got impressive results over the past decade. Virginia is at the top of that list. Michigan (yes, Michigan!), too.

Still, during both the NCLB era and more recent years, the lists have a clear reformy slant.

—

As I’ve written before in this series, I understand that the simple analyses I’ve presented here don’t count as rigorous evidence. I would love to see proper methodologists dig into these questions, too, and try to “decompose” the national and state-level NAEP results to determine what might explain them, and how much credit (or blame) goes to socioeconomic conditions, reform efforts, additional spending, or other factors.

From what I’ve seen, though, I’m ready to offer this tentative conclusion: Big national trends, such as we see on the National Assessment of Educational Progress, or high school graduation or college completion rates, are driven mostly, though not entirely, by big national socioeconomic trends. The booming 1990s had a bigger impact on NCLB-era gains than we understood at the time, and the Great Recession created a fiercer headwind than we understood, as well. Given that we’re now experiencing another historic boom—one that is finally lifting the wages of the lowest-income workers—we should expect child poverty rates to continue to fall and student achievement—after some delay—to start to rise. That is, if past is prologue.

Yet demography is not destiny. As we know for individual children, as well as individual schools, great effort can allow people or institutions to beat the odds. So it is with states. All jurisdictions should benefit from today’s economic conditions, but some will see their students go further faster depending on the policies their leaders put in place.

Which states are ready to lead during the next phase of education reform?


[1] We found the ratio between the supplemental child poverty rate at the time of a cohort's birth and the NAEP below-basic rate when the cohort was assessed—the poverty/below basic ratio—for the 1991 and 1998 birth cohorts. We then found the percentage change in the poverty/below basic ratio between the 1991 cohort and 1998 cohorts, as displayed in the last column in the table. States with larger percentage changes were able to narrow the gap between the child poverty rate and the NAEP below-basic rate over time. States with positive percentage changes saw improvements in student test scores at a rate that outpaced the state’s decrease in childhood poverty.

view

Causes and consequences of America’s broken gifted education system

7.24.2019
Flypaper

We read Chester Finn’s recent Flypaper column, “Public attitudes toward gifted education: Supportive, complacent, incomplete,” with great interest and painful recognition. We’re business executives and parents who have been involved with gifted education for more than a decade, at the school, district, and state levels. We’d like to elaborate on some causes and consequences of the issues he highlighted.

Our introduction to gifted education came in Alberta, Canada, where gifted programs were limited to the top 5 percent of students based on their IQ test results. Our children pursued an accelerated course of study that was facilitated by the common provincial curriculum that all schools followed. Additional funding was provided for social and emotional services for gifted students—for example, to address their sometimes debilitating perfectionism, difficulty in forming authentic peer relationships, and challenges working in cognitively diverse groups.

While there is always room for improvement, Alberta’s gifted education program has produced impressive results. For example, on the 2015 PISA science assessment, 2.8 percent of Alberta fifteen-year-olds scored at the highest level, compared to 1.2 percent in the United States.

When we moved to Colorado and were considering where to live, the gifted education program in Jefferson County, the nation’s thirty-sixth largest school district, initially seemed quite promising. Jeffco had implemented universal gifted screening for second graders before the state mandated it, offered gifted center “school within a school” programs that were housed within seventeen of the district’s 137 schools and featured academic acceleration, and generally seemed supportive of gifted education.

Sadly, we soon learned that the district’s reality fell well short of its rhetoric.

Based on the different ways that students can be qualified as gifted under Colorado’s “Exceptional Children’s Educational Act,” our analysis found that at least 17 percent were potentially eligible based on the “general intellectual ability” or “specific academic aptitude” criteria—before even including the percentages considered gifted in the leadership and creativity categories. While in Alberta “gifted” was a special-ed designation, in Colorado it has too often seemed to be just another competitive parenting prize.

Given the large number of students deemed gifted, we weren’t surprised to find an incoherent mix of academic approaches to serving their needs, even at the “gifted center” schools, including many strategies that research has not shown to be effective (e.g., cluster grouping, assigning extra work, and having kids serve as teaching assistants for their peers).

In contrast to Alberta, acceleration, which researchers have found to be very effective, was inconsistently implemented and produced far weaker results than the research evidence shows is possible. There appear to be many reasons for this, including the lack of a common state, or even district, curriculum, the belief among a surprising number of educators that gifted education is an affront to equity, concerns that acceleration would result in students “running out of classes to take in high school,” and complaints from some parents that acceleration was too challenging for their kids (unsurprising, given the high percentage of students categorized as gifted).

We later discovered that Colorado school districts are only required to pay for dual enrollment in two-year community college courses, and often refuse to pay for courses at four-year universities, which are better aligned with many gifted students’ needs and college plans.

In another contrast to Alberta, special education services that systematically target gifted students’ social and emotional needs were essentially AWOL, except for those gifted students with an IEP or 504 plan. Unfortunately, failure to address these needs early on can have serious consequences when gifted students become adults.

Finn pointedly noted that the existence of shortcomings like those we have encountered reflects an issue that few want to confront: “The problem of leadership in gifted education.”

From what we’ve seen, an important source of this leadership vacuum has been the organizational choices that the gifted community has made (at the national, state, and district levels) to include parents, teachers, and administrators in the same advocacy associations. As a result, most of these organizations are dominated by educators, not parents. But time and again we have seen that this doesn’t work very well in practice. There are limits on how far district employees will go in “advocacy” on gifted education issues—and most of the time those limits fall far short of what is needed to meet the challenges at hand.

Sadly, we’ve also seen that parents rarely push back because too many of them are already intimidated by the challenges of raising a gifted child and don’t want to risk being deemed “uncollaborative” and losing whatever scraps the district is throwing their way. Needless to say, most districts prefer parents to be cheerleaders for those scraps.

There is also an enormous gulf between the way K–12 treats gifted students and the way the business world sees them.

CEOs know from experience what researchers have found in the data: Talent follows a power law, not a normal distribution (see, e.g., “The Best and the Rest” by O’Boyle and Aguinis). Today, CEOs are more obsessed than ever with hiring and retaining top talent. Why? Because in our era of “cognitive capitalism,” top talent has a disproportionate impact on companies’ ability to absorb and apply rapidly improving automation and artificial intelligence technologies, and thus their chances of survival in a world of winner-takes-all competition.

Unfortunately, we’ve learned that a sizable source of America’s failure to fully develop the talents of its most cognitively gifted students lies deep in the structures, processes, and cultures of many school districts and gifted advocacy organizations. After a decade in the trenches, we hold little hope that gifted education will substantially improve on the scale that is required. This is not uplifting news for employers or for parents of gifted children. But it is the hard reality today in far too many school districts.

We also know this: As technological and economic change continues to accelerate, the consequences of failing to meet gifted students’ cognitive, social, and emotional needs are going to be far larger and more severe than many of today’s K–12 leaders understand.

view

No apologies for “no excuses” charter schools

Robert Pondiscio
7.24.2019
Flypaper

When The New York Times ran an article earlier this month on the “growing backlash” against urban charter schools, Greg Richmond, President of the National Association of Charter School Authorizers (NACSA), offered an oddly tepid response. “Most charter schools are not part of networks, most are not No Excuses,” he tweeted. “You wouldn't know that from media coverage.”

In fact, while “no excuses” schools operated by networks may not be the most common form of charters, they are by far the most successful. Perversely, they are also the ones that charter advocates, authorizers, and operators seem most eager to distance themselves from. NACSA cheerily notes a “notable and significant decline” in approvals by authorizers of no excuses schools. 

It’s a strange and dangerous moment in the charter-school movement. Democratic presidential candidates are falling over themselves to distance themselves from charters and attack “privatizers.” But the greatest victory of anti-charter activists has not been souring the public or even the Democrats on charter schools. It’s been turning the charter school sector against its own most successful model.

The phrase “no excuses” was coined twenty years ago to describe an optimistic movement and mindset that insisted there must be no excuses for adult failure. This coincided with the charter movement’s highest level of moral authority and public prestige, but that was no coincidence. When it first gained traction as a brand, a school model, and a rallying cry, “no excuses” signaled the non-negotiable belief that the root cause of educational failure and black-white achievement gaps was not poverty, not parents, not children, and above all not race. It was the belief that failing schools were the source of the problem and that great schools could be the solution—provided, of course, that everyone associated with them refused to tolerate or excuse failure.

Schools that embraced the “no excuses” mantra and mindset shared standard features such as longer instructional days, data-driven instruction, school uniforms, insistence on proper classroom behavior, an embrace of testing and accountability, and an unshakable commitment to get all students to and through college—features that remain in place in many charters (and other successful schools) today.

But you'd be hard-pressed to find a single charter leader who now uses the term to describe their school model. In an interview in The Atlantic two years ago, Success Academy founder Eva Moskowitz responded almost viscerally to it. “We’re not a no-excuses school. We're just not. I don't really know how to respond to that nomenclature.” But as I note in my forthcoming book, How the Other Half Learns, based on a year of fly-on-the-wall observations at Success, Moskowitz’s schools are not merely no excuses schools, they’re the most no excuses. Whether one cares for her brand of education or not, its defining feature is a demanding and unflinching culture that reflexively (often uncomfortably) asks what adults—including parents—need to do differently when things go awry.

If we’re clear-eyed and candid, we have to concede that nearly three decades of ed reform has been a mixed blessing—lots of disruption in return for less than stellar results. But there have been two clear and unambiguous victories. The first was the moral authority of calling out the “soft bigotry of low expectations” making it unacceptable to hold poor and minority kids to lower standards. The second is urban charter schools, mostly CMO-run, that have come the closest to honoring that ideal while providing a critical lifeboat to families otherwise stuck in lousy schools.

A 2017 report from Stanford University’s Center for Research on Educational Outcomes (CREDO) found that urban charter schools “provide significantly higher levels of annual growth in both math and reading compared to their traditional public school peers.” CREDO estimated that students in CMO-run schools received the equivalent of ninety-seven additional days of school in math over traditional district-run schools and an extra forty-six days of instruction in reading. The standouts among this group were KIPP, Achievement First, Uncommon Schools, YES Prep, and other “no excuses” pioneers. The comparatively lackluster results of other charters make ed reform and charter advocates’ reluctance to embrace and defend the high-fliers doubly odd.

As I note in my book, no single event, policy directive, or study marked the moment when “no excuses” went from a rallying cry to a curse. The broken-windows theory of community policing on which no excuses school culture was loosely based (e.g., sweat the small stuff; order is essential; learning can't occur in chaos) became closely associated with aggressive “stop and frisk” policing, much as no excuses became conflated with thoughtless zero tolerance policies and exclusionary discipline.

The sight of black and brown children required to “track the speaker” in class, or passing through hallways in straight lines, routinely brings complaints from both progressive educators and political progressives that high-performing schools teach only compliance and perpetuate the “school-to-prison pipeline”—a critique that deserves the strongest rebuke. Students in high-performing charters are not on their way to prison. They’re on their way to college. If all you see is teachers imposing their will on children, compliance for compliance sake, rather than a determined effort to create the school culture and classroom conditions—attention, focus, and affirmation—that make learning possible, you’ve missed the point entirely. 

The reluctance to defend the no excuses culture validates the common criticism that these schools are harsh and militaristic. Yet caring support for students is essential to the success of no excuses schools. “One thing I consistently found was that no-excuses discipline failed if it was not combined with the sure knowledge on a student's part that teachers cared deeply about them and their education,’ said David Whitman, who wrote a seminal book in 2008 on no excuses schools, Sweating the Small Stuff: Inner-City Schools and the New Paternalism. “There had to be a caring connection between teacher and student for strict discipline to work, or what I described as a kind of benign paternalism,” he told me. SEL enthusiasts take note: Tough love is not an oxymoron. 

Wonks may love research and data, but narrative wins hearts and minds. The general impulse—that a safe, well-run, and orderly school is a precondition to academic excellence—has not changed in a generation and remains very popular with parents who continue to swell urban charter waitlists. The mindset that it is (or ought to be) morally unacceptable to allow low-income kids and children of color to be failed by adults and the institutions we build for their ostensible benefit is no less valid or resonant today than it was two decades ago. What “no excuses” got right—and it’s still right—is that learning cannot occur in chaos. High expectations are essential and non-negotiable. “No excuses” meant exactly that: If kids are failing, we are failing. These are ideals that don't need an apology. They need a revival.

Editor’s note: This article was first published on Education Week’s blog Rick Hess Straight Up.

view

Widening excellence gap

Chester E. Finn, Jr.
7.24.2019
Flypaper

The ever-vigilant Jack Kent Cooke Foundation has issued a short (two-page!), trenchant issue brief—closer, really, to an infogram—showing how the “excellence gap” in American schools has actually worsened over the past two decades.

In case you haven’t been paying attention, or getting confused by all the gaps we are supposed to be closing, the excellence gap (as defined by the Foundation and by scholars such as Jonathan Plucker) is “the discrepancy between the percentage of lower-income versus higher-income students who reach advanced levels of academic performance.”

This analysis employed National Assessment (NAEP) data and examines, at the national level, the percentage of U.S. students in grades four, eight, and twelve who score at NAEP’s “advanced” level in reading and math. This time, they examine the (always woefully small) high-scoring population according to which students were and weren’t eligible for federally subsidized meals, deeming the former “low-income” and the latter “other” (but also referring to them as “more affluent”).

That’s about all one can do with NAEP data, and it isn’t perfect, for subsidized-meal eligibility has changed over the years—about half of all public-school pupils now qualify—and it’s gradually vanishing as a usable proxy for student disadvantage. Still, the Foundation’s central point is indisputable: Most of the increase in the share of U.S. students reaching “advanced” on NAEP—and it’s certainly good that there’s been an increase, however modest—has occurred among the pupil population that is not having lunch in school with Uncle Sam’s help. The achievement boat occupied by those who do receive such help has risen a bit, but not nearly as much as that in which their “more affluent” peers sit in presumably greater comfort.

A few years ago, Brandon Wright and I examined the excellence gap with the help of PISA data. (You’ll find that on pages 34–39 of Failing Our Brightest Kids.) We looked—country by country, including the United States—at the populations of fifteen-year-olds who scored 5 or 6 (top of the scale) on PISA in 2012, and subdivided those populations into the four quartiles that OECD data-maestros call the Index of Economic, Social and Cultural Status (ESCS). We looked at the ratio of high scorers within the top quartile to high scorers in the bottom and (for the U.S.) found them to range from eight to one at best (that was in math) to eleven to one at worst (reading.) This placed the United States very low among kindred countries when we ranked them according to such ratios. The best-off countries (such as Singapore, Finland, and Japan) had ratios around three to one—still big excellence gaps but not nearly as wide as our own.

Then we did the same thing with PISA data but used parental education rather than ESCS. Here, again, the U.S racked up ratios from six to one to twelve to one between high scoring students with highly educated parents and those with poorly educated parents, and here, once again, other nations did far better (also around three to one).

America is supposed to be a land of opportunity and upward mobility. But it’s painfully clear, whether we use NAEP or PISA as our reference, that at the high end of student achievement, as at the levels NAEP terms “basic” and “proficient,” the circumstances of students’ births still matter far more than they should. And the Jack Kent Cooke Foundation says it’s getting worse, not better.

view

A debate about unschooling

Robert Pondiscio
7.24.2019
Flypaper

“How can you tell if someone’s a vegan?” goes the common joke.

“Don’t worry. They’ll tell you.”

You can change the joke to unschoolers and it works almost as well, at least among libertarians. “Let me ask you something,” a libertarian will say when he finds out you work in education. “Have you ever heard of John Holt?” Or John Taylor Gatto.

Cato Unbound describes itself as “a virtual trading floor in the intellectual marketplace.” A product of the big brains at the Cato Institute, the current issue is all about unschooling, which as the lead essay by Kerry McDonald makes clear is not the same as homeschooling. Dwelling on the “central tension” between “the coercion that undergirds most American education and the values of liberty and responsibility from which freedom spreads,” McDonald notes that homeschooling mostly recreates the coercive nature of education and transfers it into the home, “importing forced schooling’s authoritarian tactics and similarly dulling a child’s free will.” Libertarians, of course, don’t much cotton to forcing anything on anyone. Unschooling thus separates education from schooling, offering children the “opportunity of self-determination” and letting them follow their curiosity where it leads. Unschooling principles may be “applied in many ways by a diverse set of individuals and organizations,” McDonald writes, but what they all have in common is “the fundamental belief that children should not be forced to learn. Autonomy and individuality are paramount.” She cites Alexander Sutherland Neill, the founder of England’s Summerhill school and another revered figure among unschoolers. “The function of the child is to live his own life,” he wrote, “not the life that his anxious parents think he should live, nor a life according to the purpose of the educator who thinks he knows what is best. All this interference and guidance on the part of adults only produces a generation of robots.” This is a key point: McDonald’s essay suggests that unschooling is not merely good for kids but correct. Whoso would be a libertarian, must be an unschooler, (or unschooled) as it were.

Not so, argues the next essay in the volume, by Kevin Currie-Knight, an Associate Professor of Education at East Carolina University. He, too, is a political libertarian and a “champion of unschooling” (which must make for lively faculty meetings at his ed school), but he rejects the idea that it’s “any sort of logical extension of a politically libertarian position.” The best reason to support unschooling is “not that it is most consistent with a libertarian framework or stands the best chance of raising little libertarians. It is that unschooling seems to be an impressive way to equip students for adult life, especially in a post-industrial age.”

A third essay in the virtual volume, by Corey DeAngelis, the Director of School Choice at the Reason Foundation, makes what should be the obvious point, at least outside of the (small, very small) libertarian bubble. The evidence in favor of educating children at home is limited by selection bias. “Advantaged families are more likely to have the resources needed to opt their children out of the ‘free’ government schools to educate them at home,” he writes. “In other words, the improved outcomes experienced by homeschooled students may be the result of family background rather than educational setting.” Moreover, expanded school choice generally leads to less home-based education, he notes, “presumably because many families switch to the ‘free’ alternative when given the option.”

I suspect I’m far more comfortable with libertarian ideas, both politically and educationally, than either the average educator or policy wonk. But unschooling makes me nervous, chiefly because of the fad-prone nature of education and Dewey’s maxim that “what the best and wisest parent wants for his child, that must we want for all the children of the community.” McDonald and Currie-Knight are among those best and wisest parents. Surely their diligence and attentiveness matters as much as the freedom afforded their children. In its absence, the potential for disaster seems significant. “Freedom, not license” is the key, as Neill suggested, and which McDonald cites, to her credit.

There were a lot of things that were forced upon me as a child that I only came to appreciate as an adult, like Shakespeare, working with my hands, and Johnny Cash records. Some passions that I developed on my own, like the New York Mets, have brought me mostly sorrow and misery. It simply does not follow that the things that capture our imagination as children are fruitful and enriching, and that the things we are led to by “coercion” are lacking in value. Coercion does not taint the thing that is coerced. If I make my child eat her peas, that does not make peas bad (or make me a bad parent, I hope). There will always be a role for adults and, forgive me, authority figures to guide us toward the valuable, the beautiful, and the enduring. Our lives are often grounded and enriched by exposure to relationships with institutions in civil society from schools and churches to clubs and charities. That our relationships to these community pillars might be forced upon us initially in childhood does not make them any less meaningful to us as adults. To insist on the superiority of that which is chosen merely because it is chosen seems a non-libertarian argument.

Reading and re-reading the thoughtful essays in this volume have given me an appreciation of the potential value of uschooling, which candidly I have been mostly dismissive of in the past. But I remain unpersuaded. I have some well-honed views about the schooling that I want for my own child, and (if you insist on asking me for advice) about what you might seek out for yours. But critically, I have no particular interest in convincing you that my preferences ought to be yours. Does that make me more libertarian than some libertarians?

SOURCE: “Unschooling and the Rights of Children,” Cato Unbound (July 2019).

view

The Education Gadfly Show: What rural Americans think about charter schools

7.24.2019
Podcast
 

On this week’s podcast, Danish Shakeel, a postdoctoral research fellow at Harvard University, joins Mike Petrilli and David Griffith to discuss how information affects attitudes toward charters in rural America. On the Research Minute, Amber Northern examines the impact of Boston’s charter schools on students with disabilities and English language learners.

Amber’s Research Minute

Elizabeth Setren, “The Impact of Targeted vs. General Education Investments: Evidence from Special Education and English Language Learners in Boston Charter Schools,” retrieved from Annenberg Institute at Brown University (June 2019).

Fordham Logo

© 2026 The Thomas B. Fordham Institute
Privacy Policy
Usage Agreement

National

P.O. Box 110
Burke, VA 22009

202.223.5452

[email protected]

Ohio

P.O. Box 82291
Columbus, OH 43202

614.223.1580

[email protected]

Sponsorship

130 West Second Street, Suite 410
Dayton, Ohio 45402

937.227.3368

[email protected]