This post is the second in a series of articles leading up to the release of new NAEP results on April 10. See the first post here. Future posts will examine state and local trends and identify the key questions that new NAEP scores will potentially answer.
The 2017 NAEP results will be released in April and will provide policymakers and analysts important data with which to track America’s academic progress or lack thereof.
To help us prepare, here’s a look at recent national trends, sliced and diced several different ways. In our view, the most helpful analyses:
- Look at subgroup performance. If we examine national trends alone, we conflate changes in educational progress with fluctuations in the student population. As our schools serve greater numbers of Hispanic students and fewer whites, for example, we should expect achievement to decline somewhat because Hispanic students, who are more likely to live in poverty, tend to perform at lower levels, on average, than whites. Splitting out the trends for the major racial subgroups helps to overcome this problem.
- Follow trends over a long period of time. Obsessing about gains or declines over a two-year period doesn’t tell us much. Long-term changes are more compelling and important.
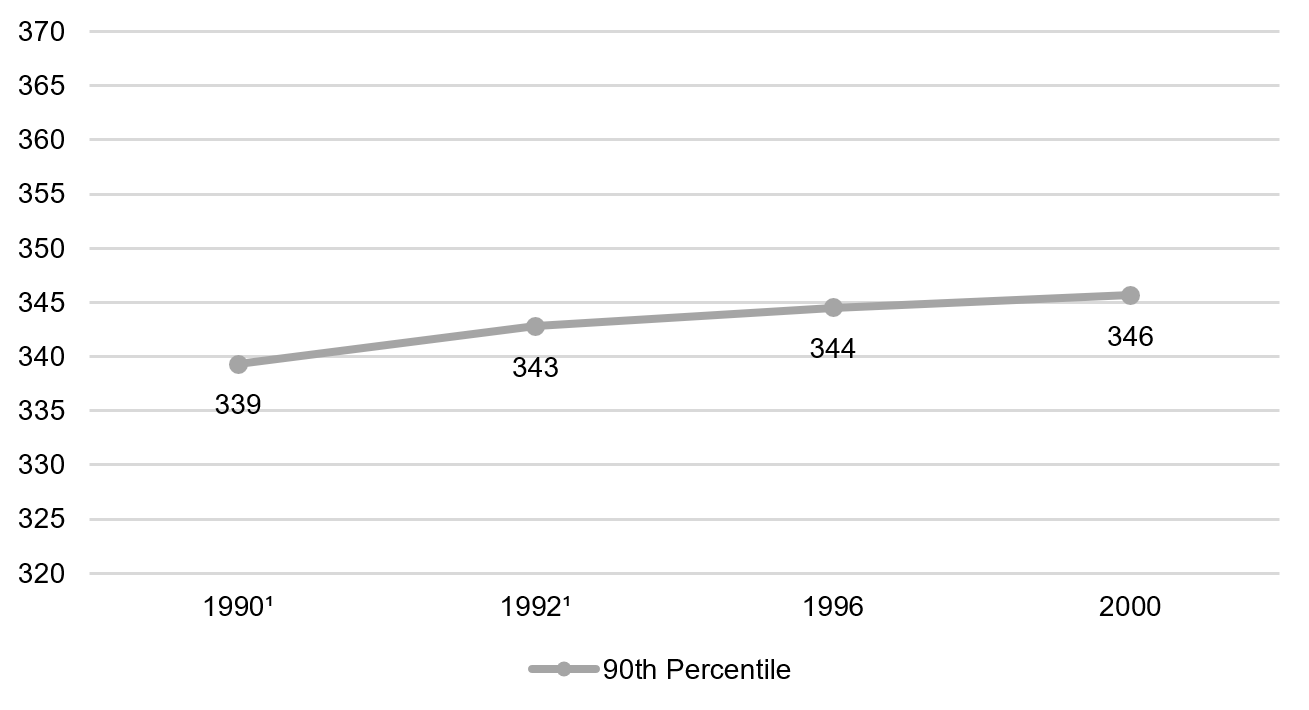
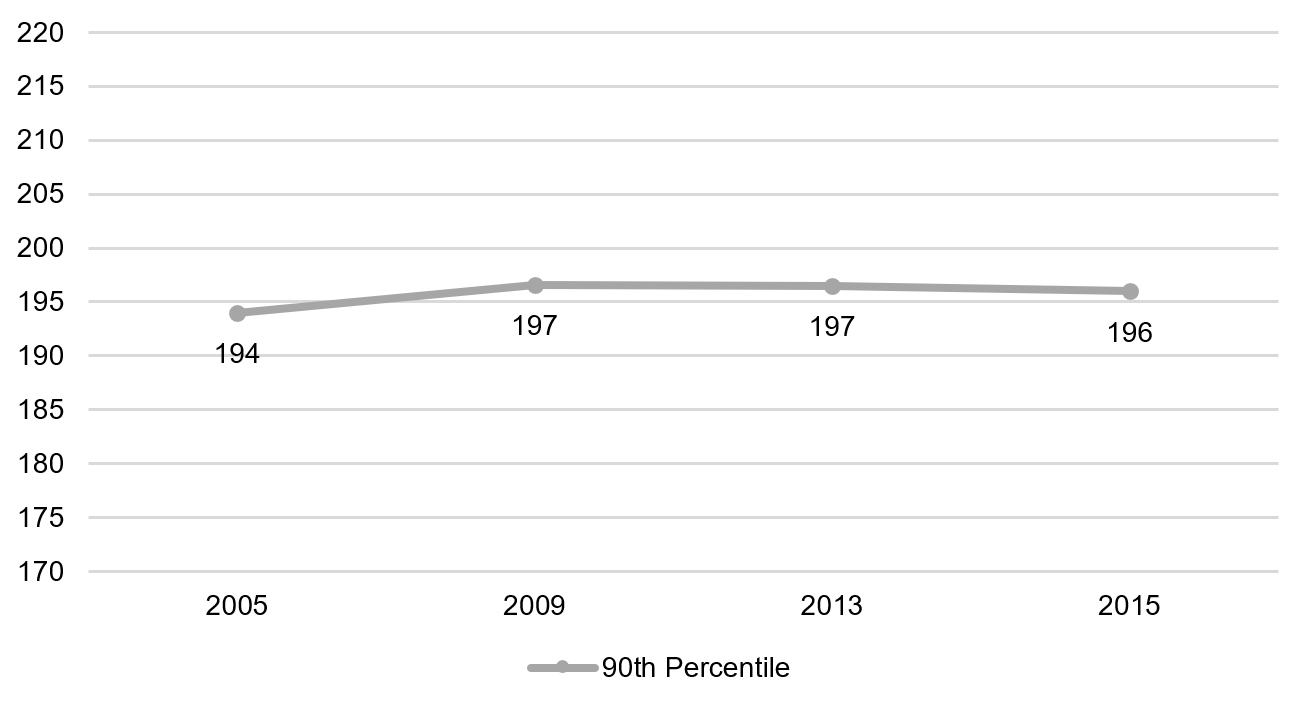
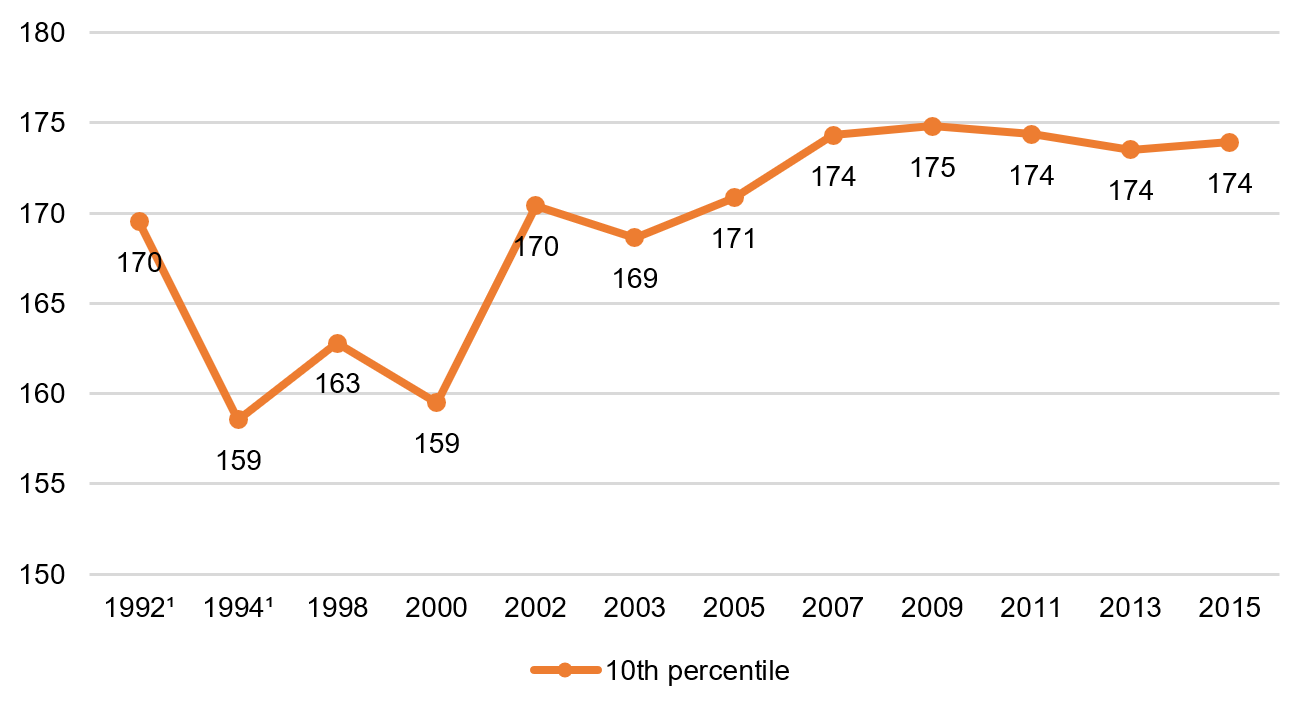
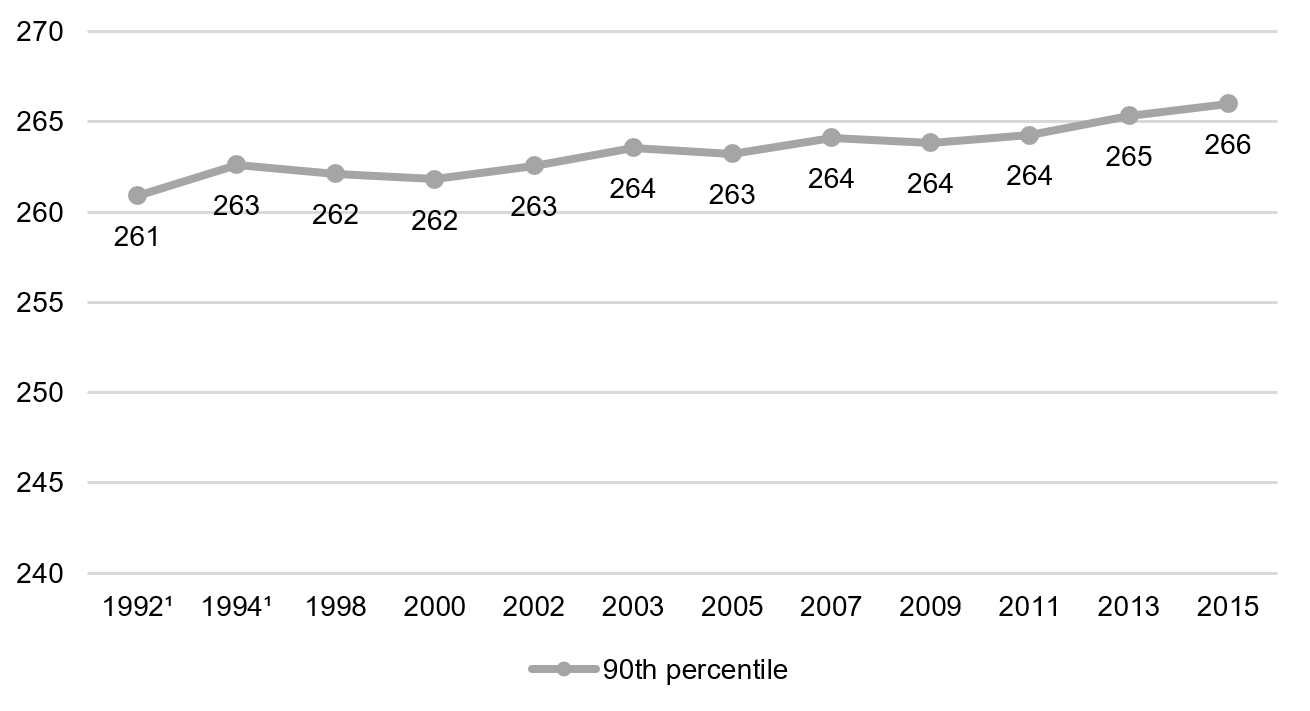
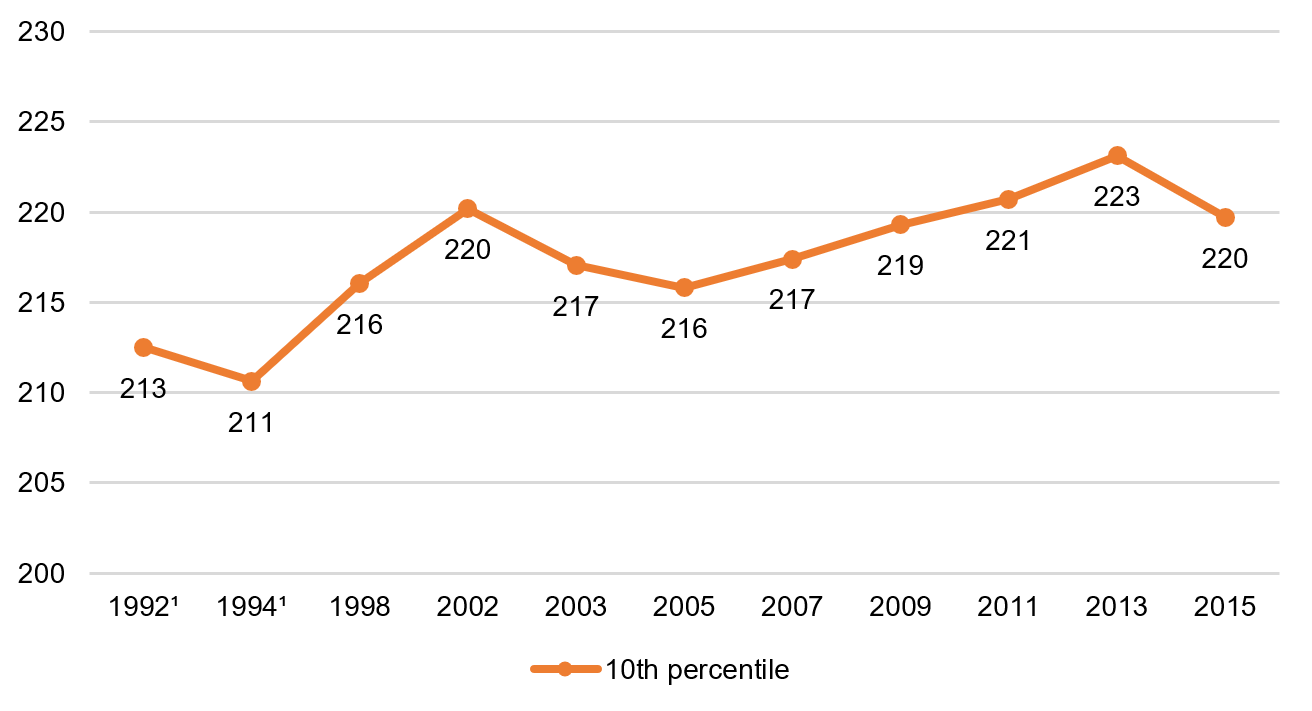
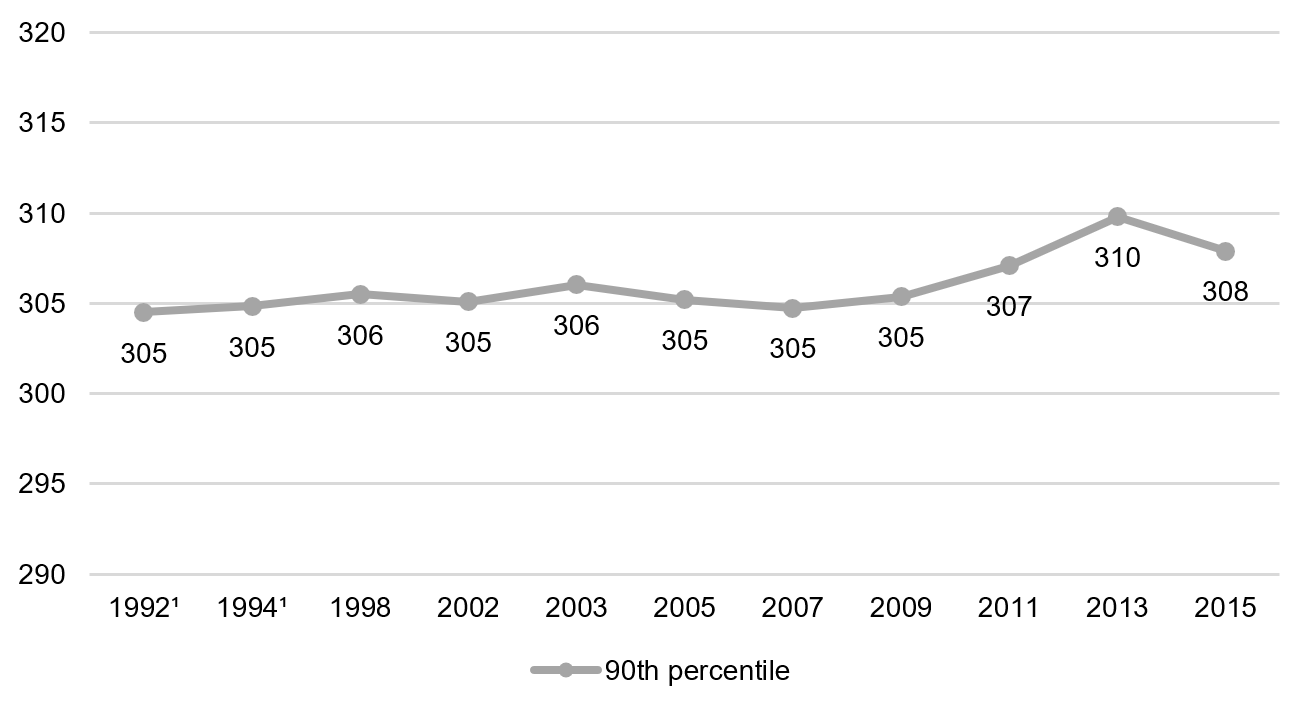
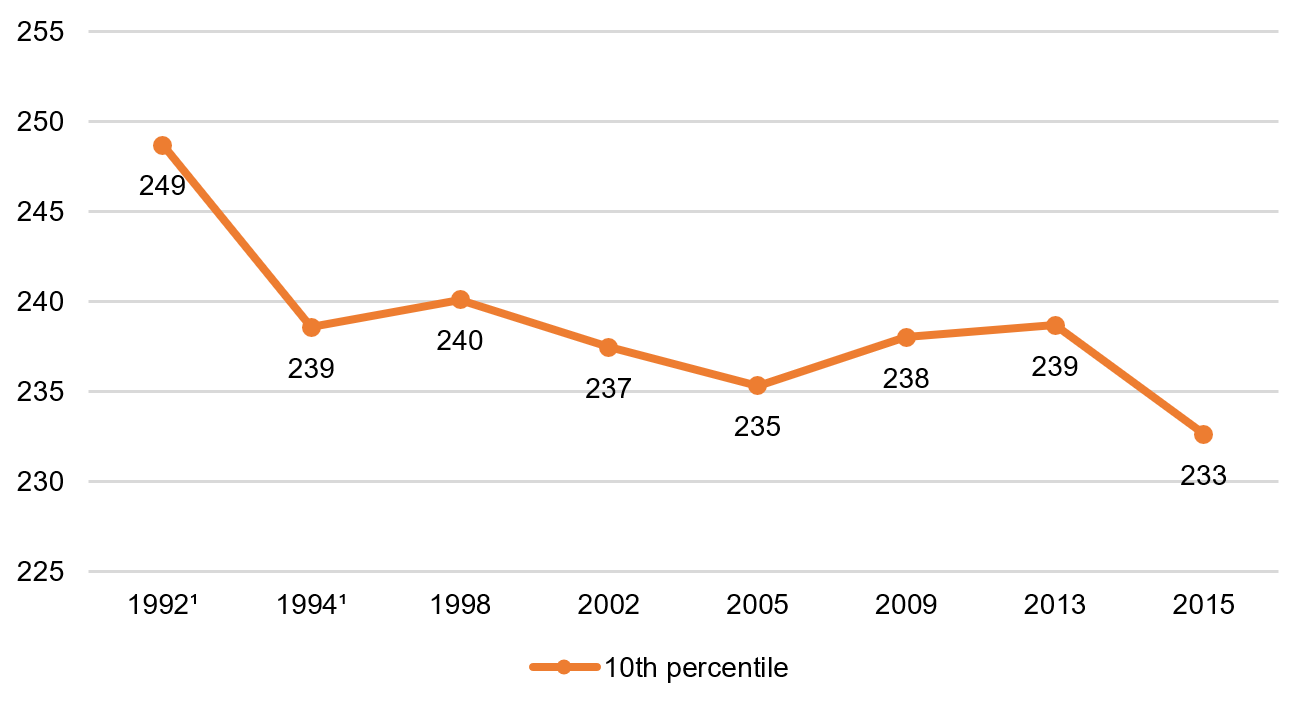
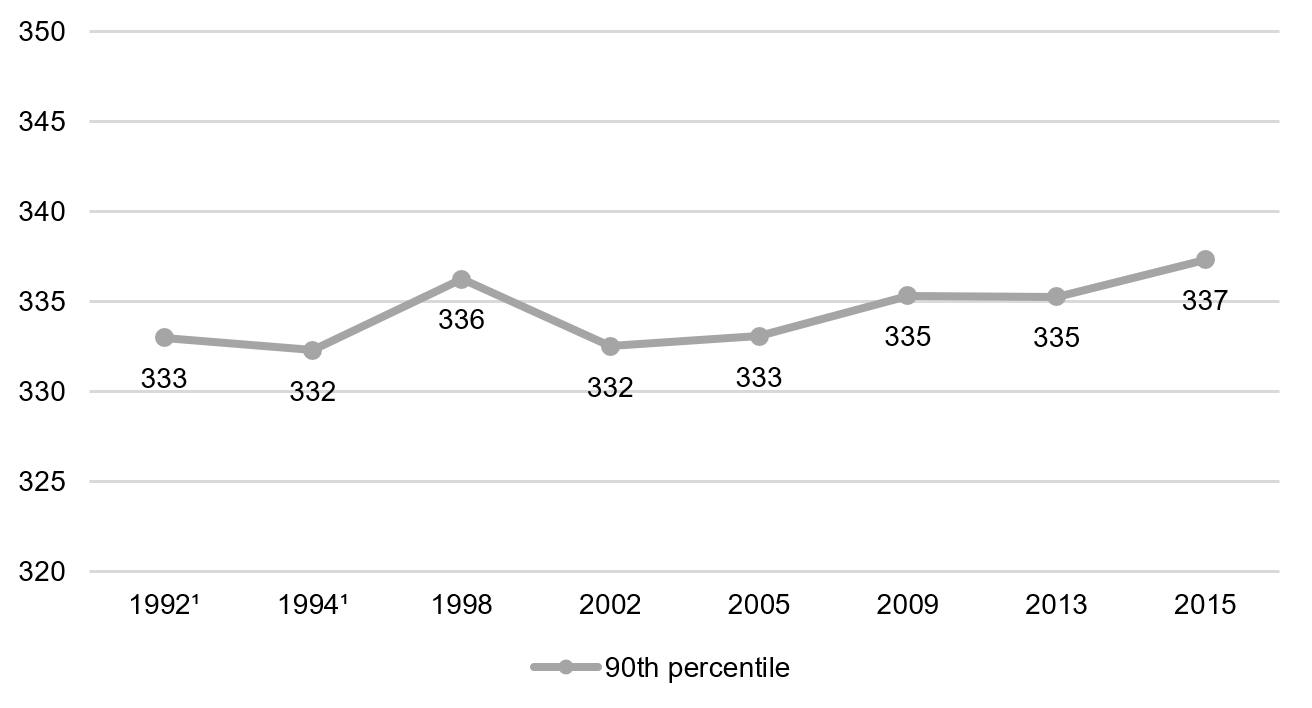
- Get beyond the averages. Average scale scores are important, no doubt, but we also need to pay attention to high and low achievers and how they are faring over time. We can do so by looking at trends at the 10th and 90th percentiles.
With these principles in mind, let’s see how U.S. students have performed over the past twenty-five years on the “regular” (versus “long term”) NAEP. That’s the one that will soon be updated with 2017 scores.
We relied on the NAEP Data Explorer to generate our charts, and we used NAEP’s national sample, which includes public and private schools. For subgroup data, we used NAEP’s “major reporting group” which, prior to 2002, was based on student-reported information. Since then, however, the Education Department uses school-reported data supplemented with student-reported data. And all of the trend lines are unbroken except for twelfth grade math, which introduced a new framework in 2005 that analyses found made comparisons with earlier results impossible.
Key findings:
- There have been gains almost across the board since the 1990s. But progress is generally much larger in math than in reading; in fourth grade than in eighth grade; in eighth grade than in twelfth grade; for African American and Hispanic students than for whites; and for low performers than for high performers.
- Most of the gains happened in the 1990s and early 2000s. The exception is reading, for which the 1990s were often flat, or even down. And progress in most categories has been very meager since the mid-2000s. Somewhere around 2007 or 2009, promising momentum petered out.
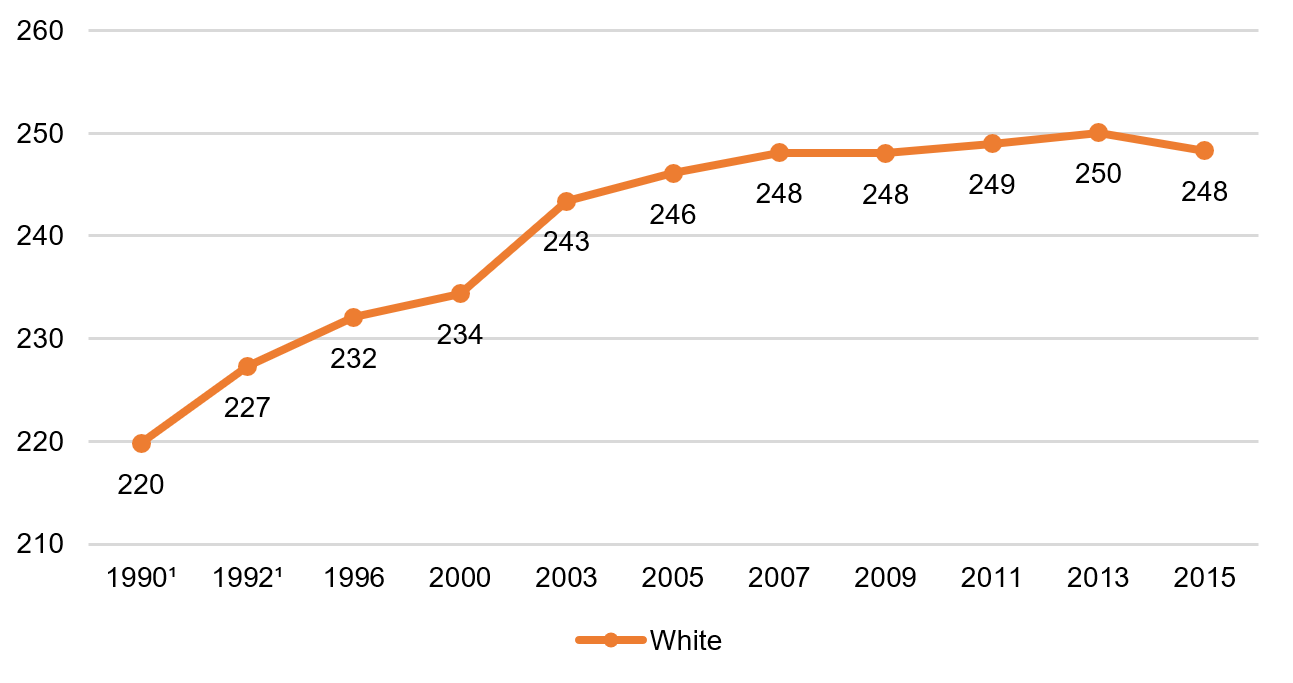
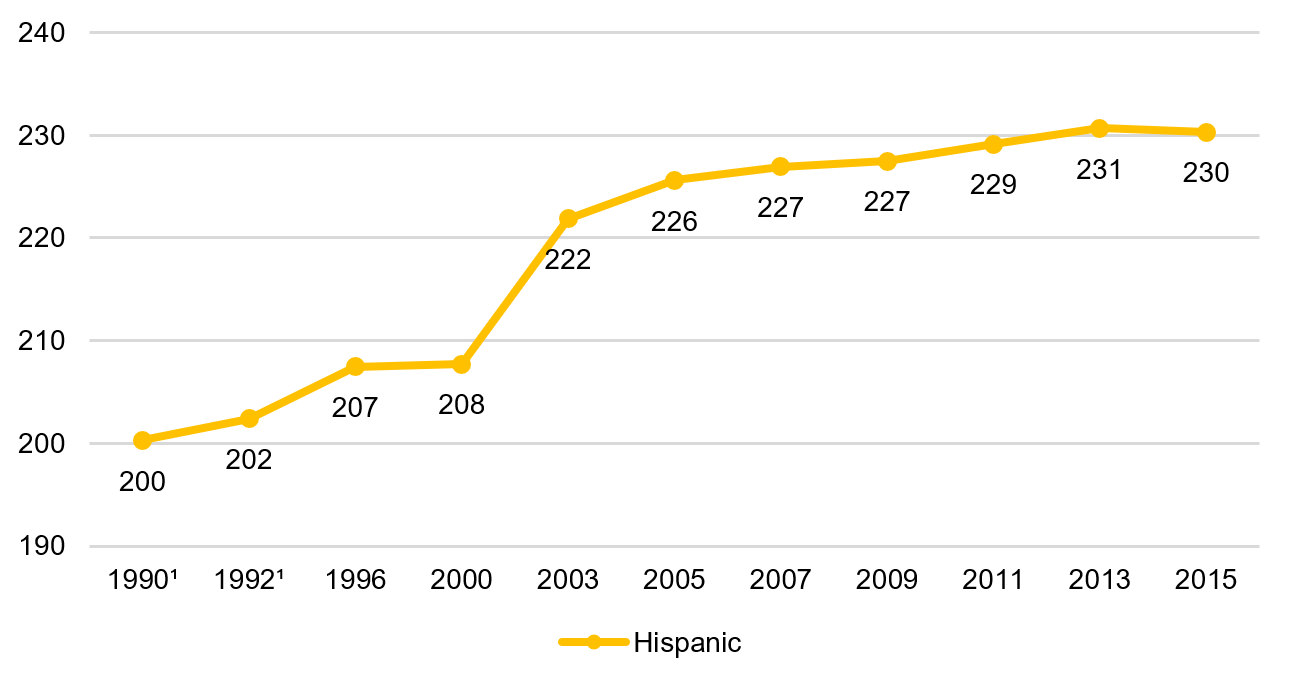
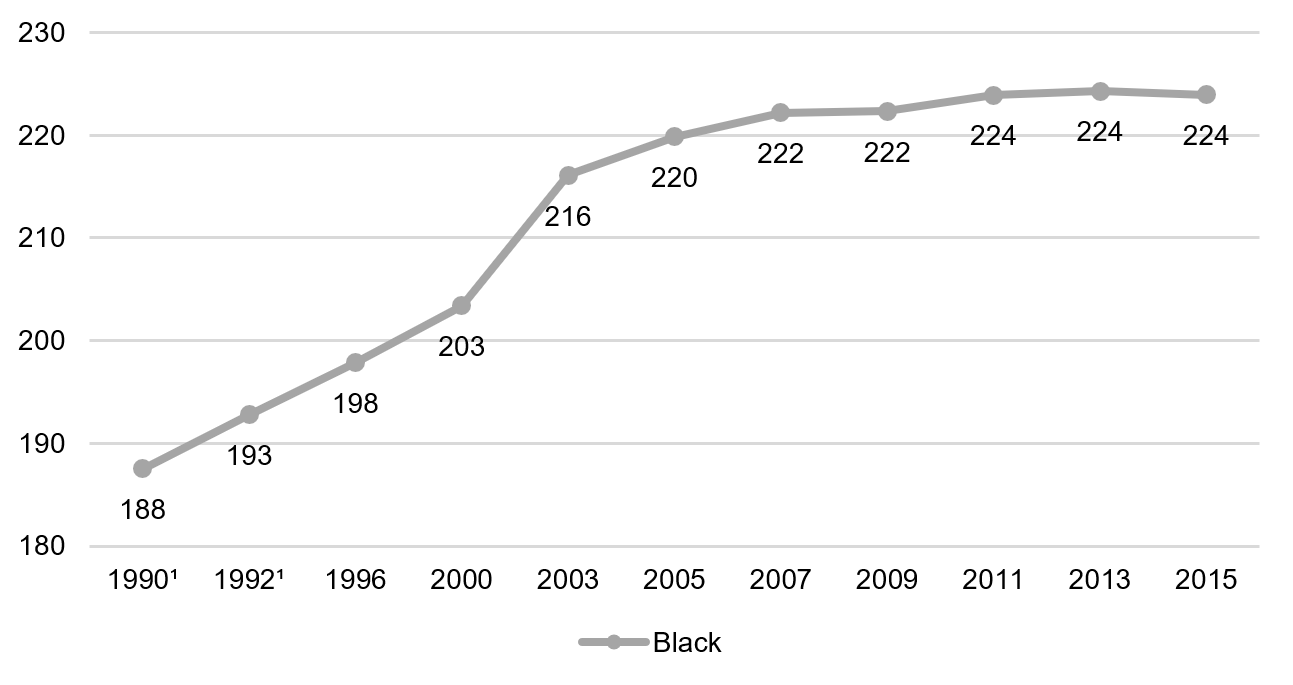
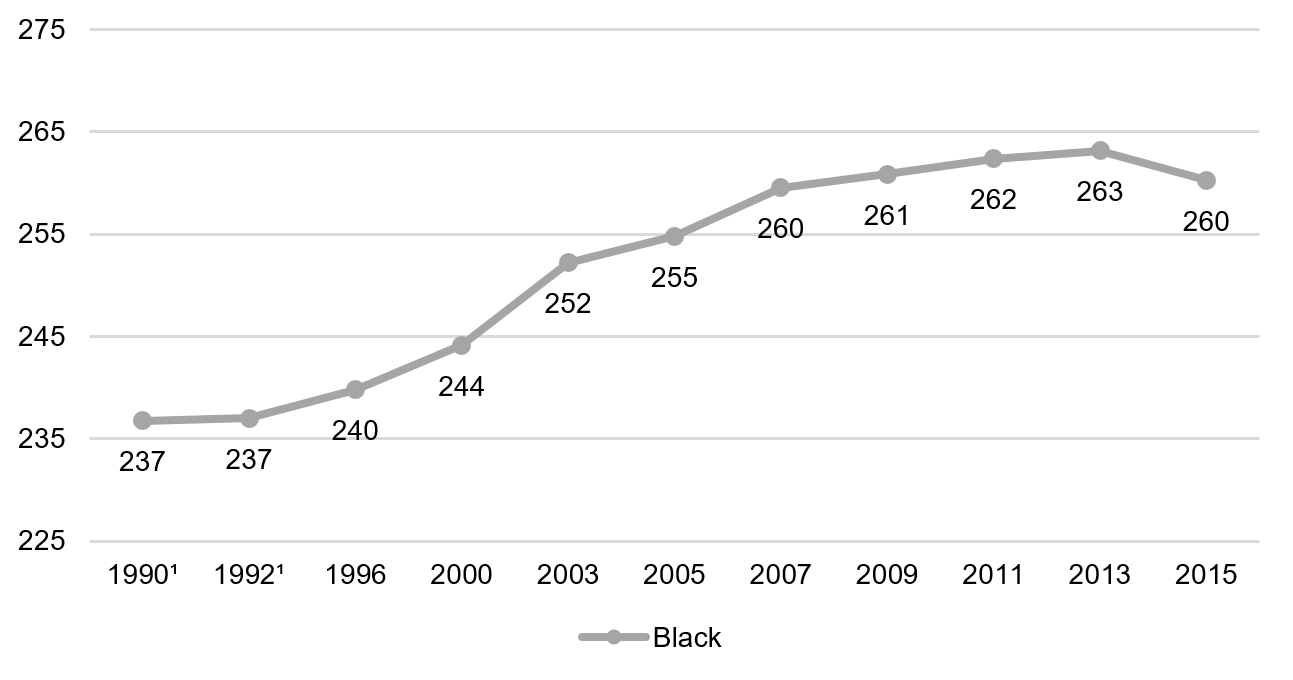
- Progress in math has been especially remarkable. Black eighth graders gained twenty-three points from 1990 to 2015, Hispanic students gained twenty-four, and white students gained twenty-two. That’s roughly equivalent to two grade levels, and means that students are coming into high school much better prepared than they were two decades ago. That may help to explain at least some of the increase in America’s graduation rate, though it hasn’t yet translated into much progress in twelfth grade math achievement.
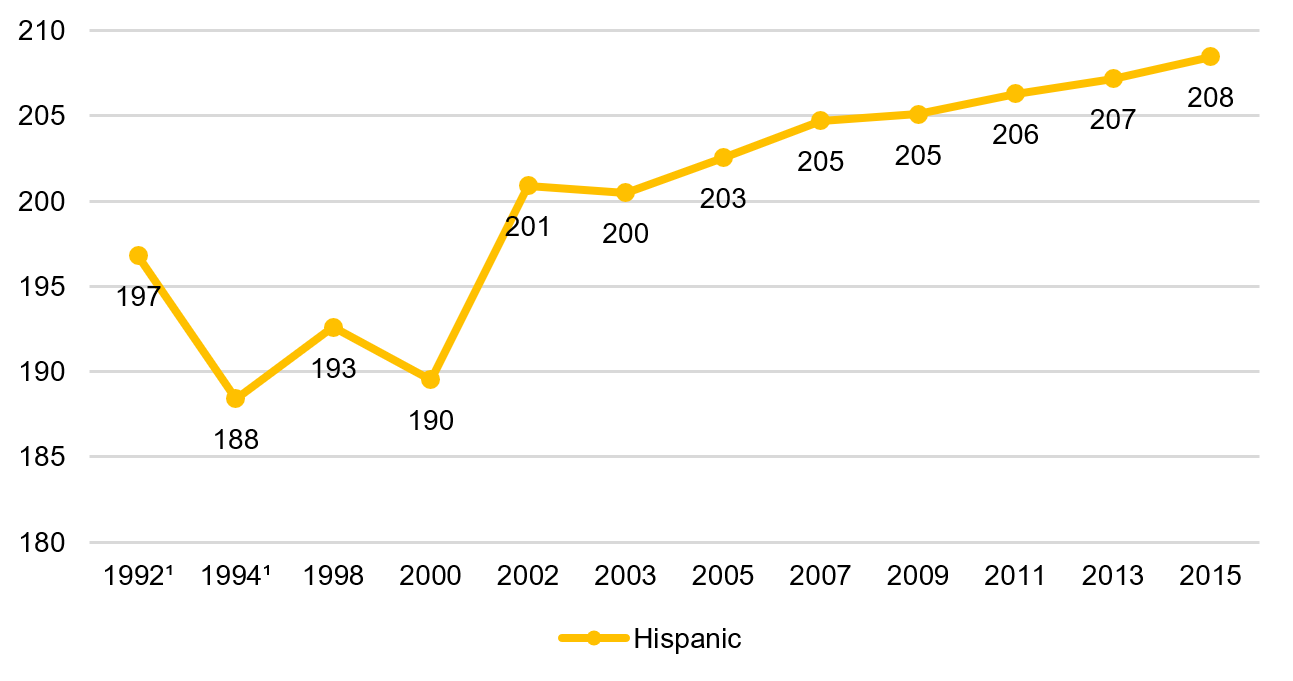
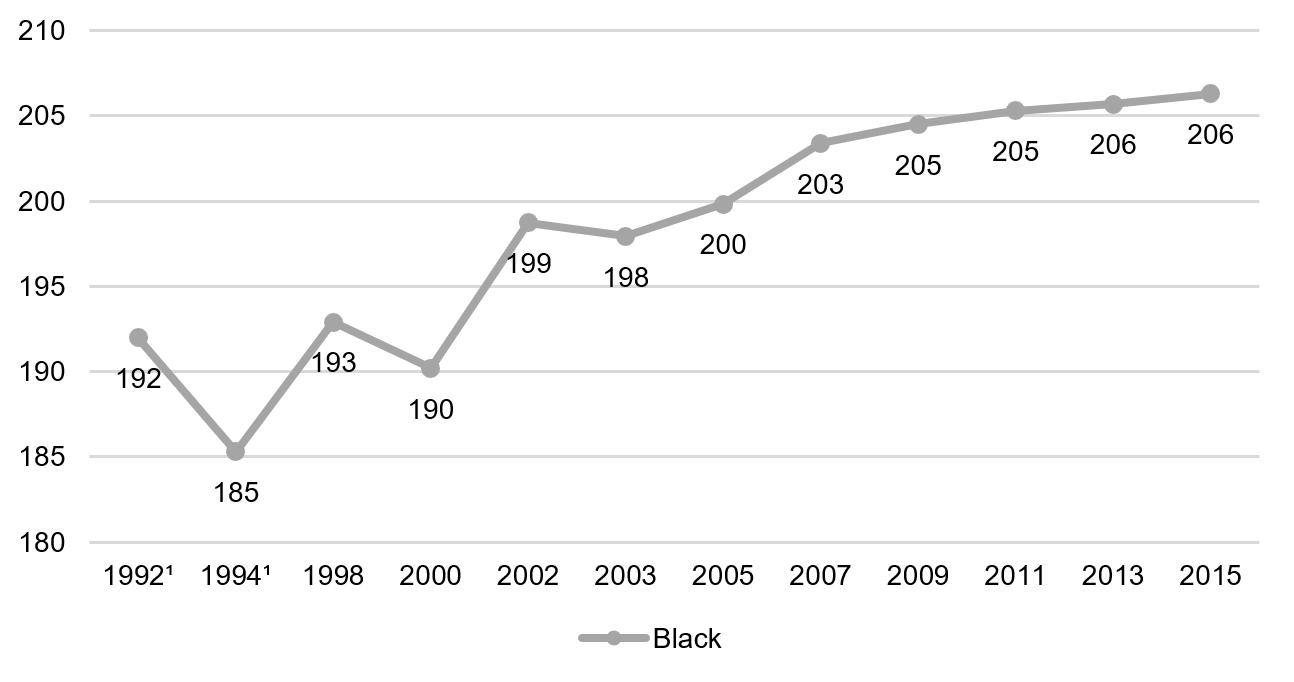
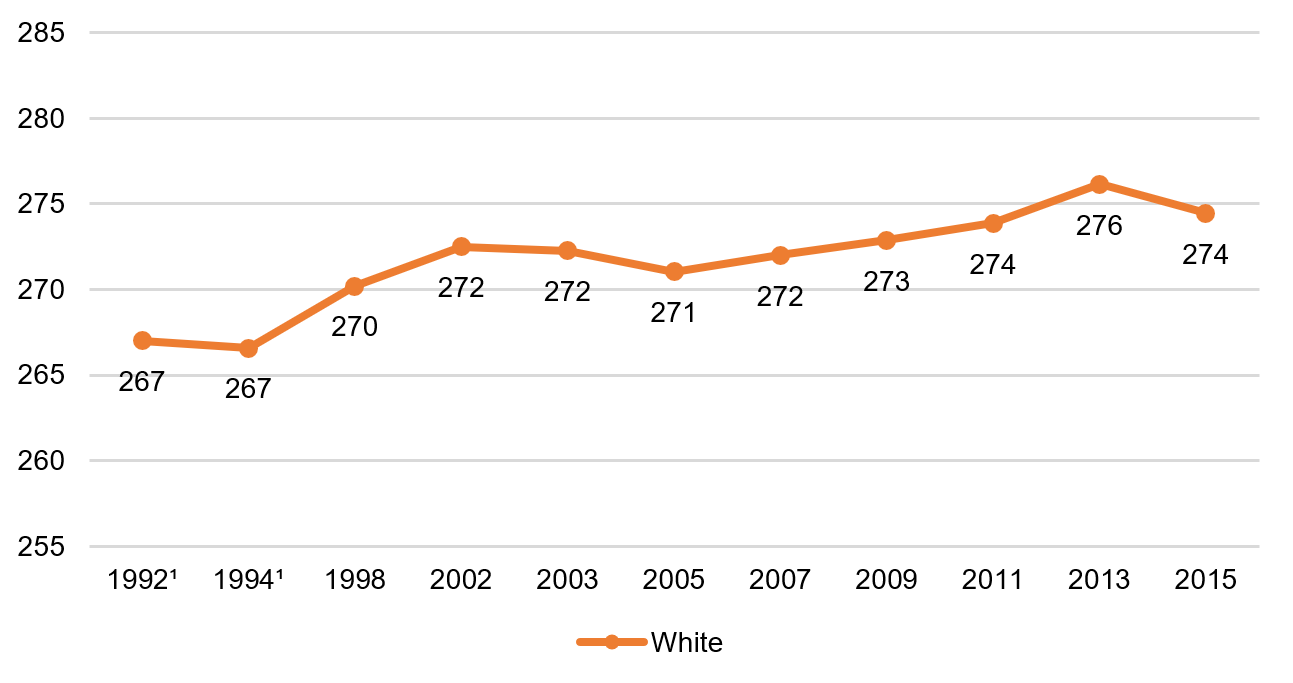
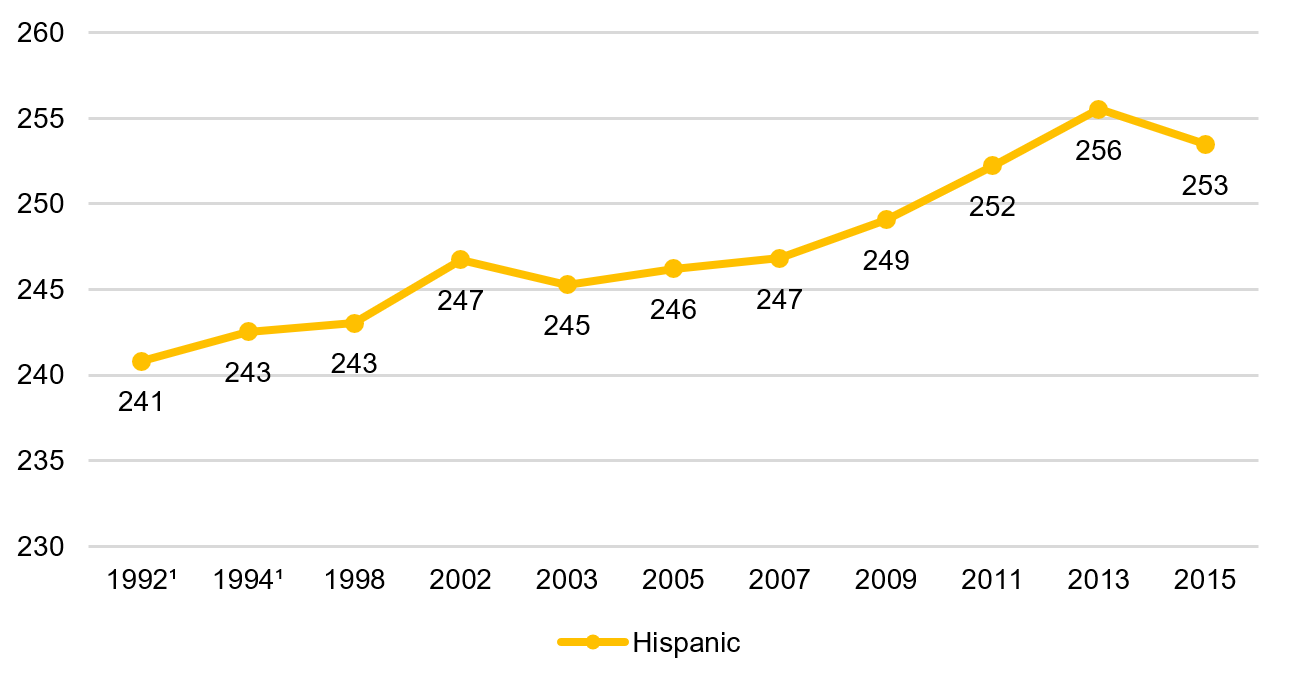
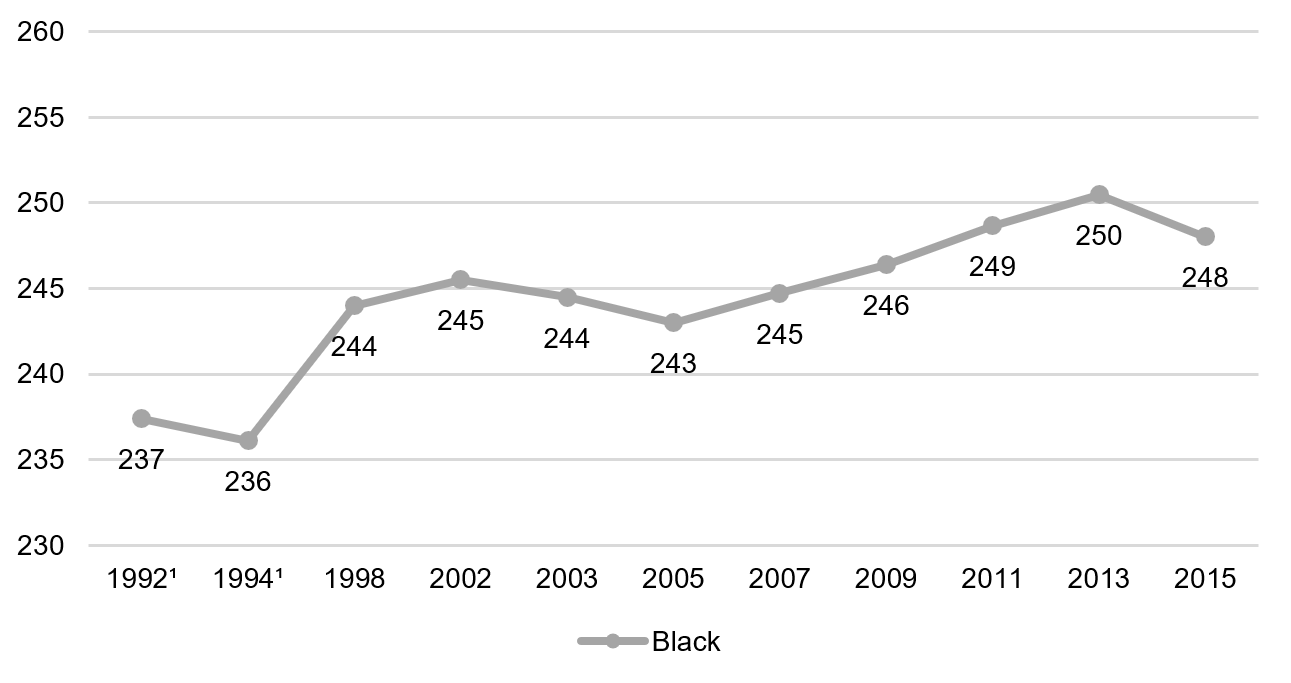
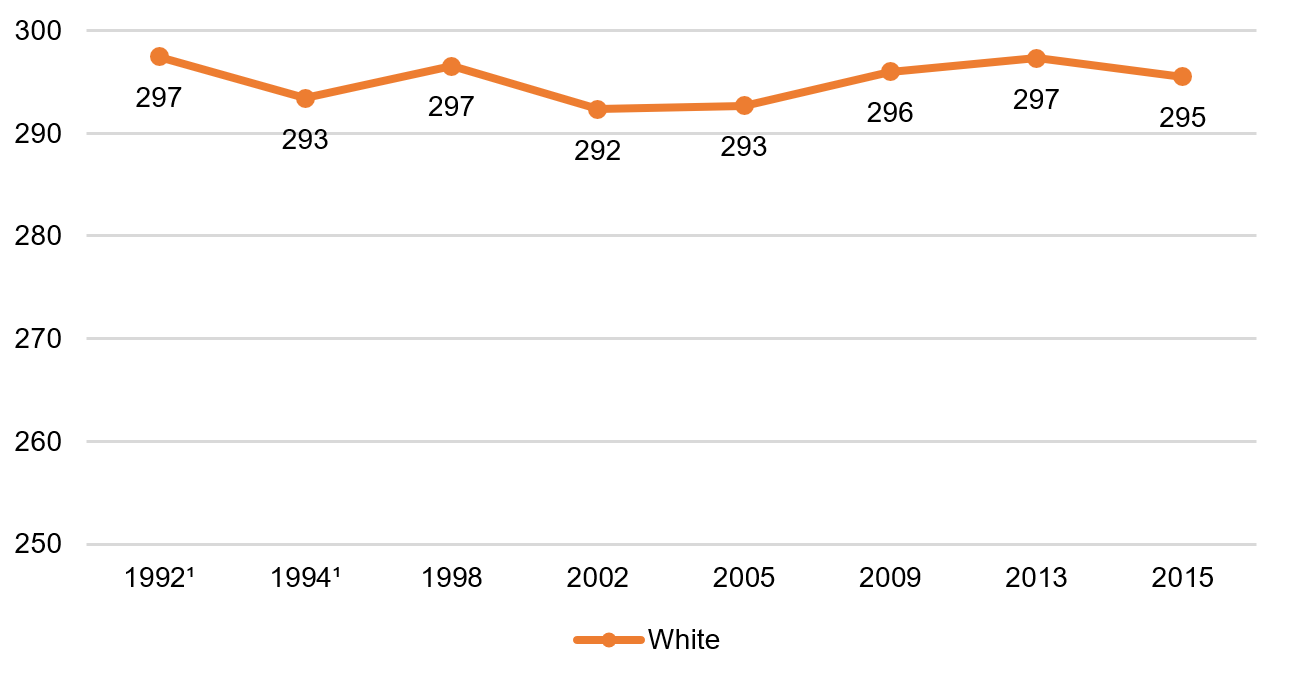
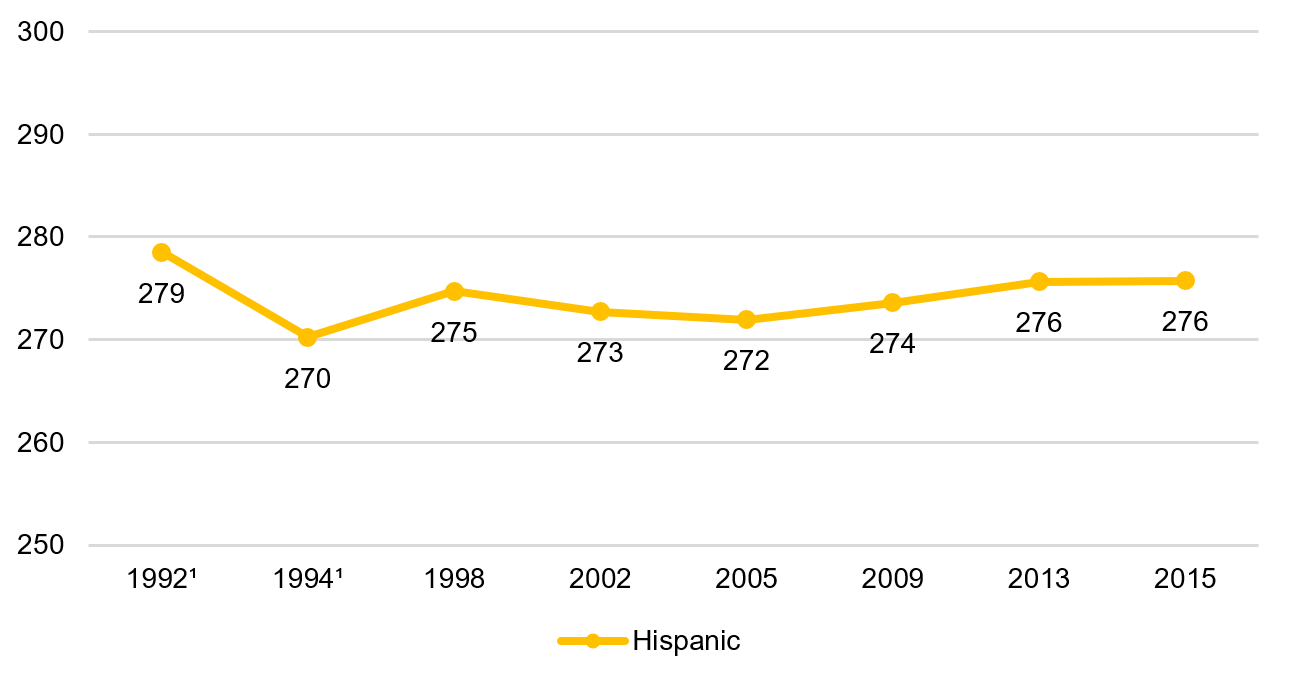
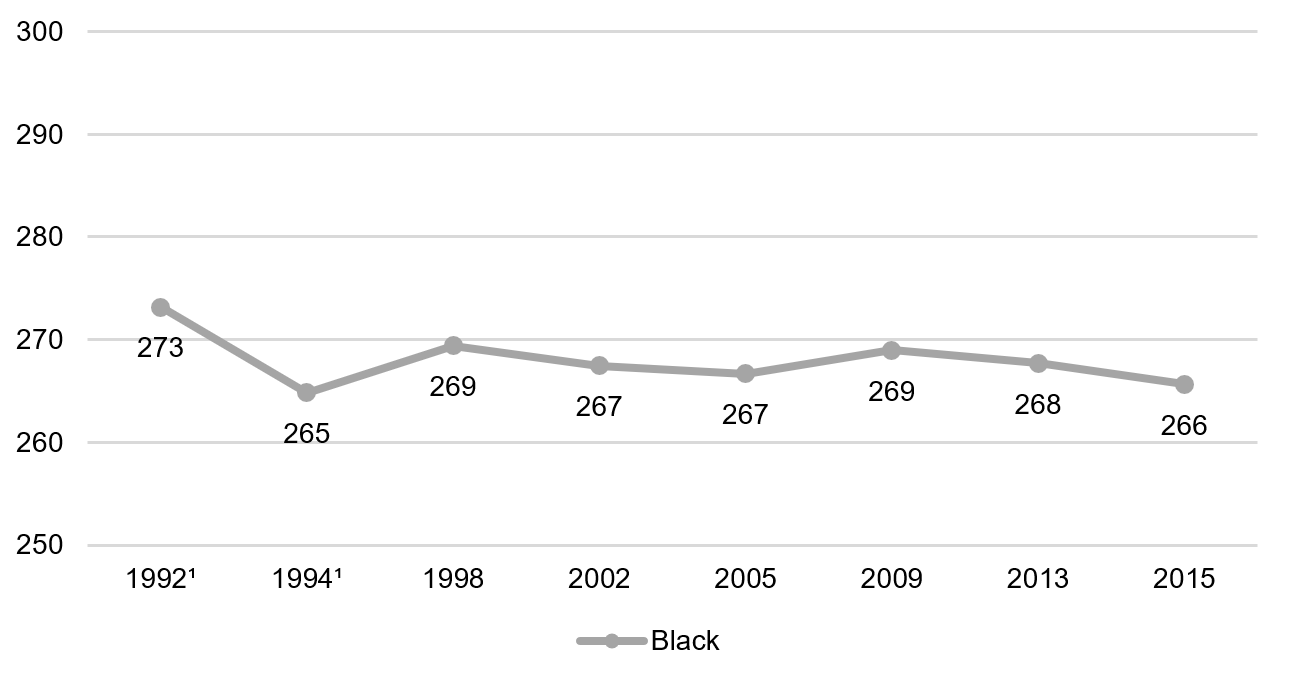
- Children of color are reading much better in the early grades than before. Hispanic and black fourth graders students respectively gained twenty and twenty-one points from 1994 to 2015, while their white peers gained eight. As with the other trends, the most progress came in the late 1990s and early 2000s. Maybe it was because of improved reading instruction in the phonics/Reading First era, or maybe it reflected improved socioeconomic conditions for children of color in the 1990s. Either way, the gains for eighth graders were only half as large, and they all but evaporated by twelfth grade. In fact, there were marked declines for twelfth graders in the 10th percentile, perhaps because more low achievers were staying in school rather than dropping out.
Those are our takeaways. Scroll through the pictures below and see if you agree. And keep in mind that not every bump up or down is statistically significant.
Reading
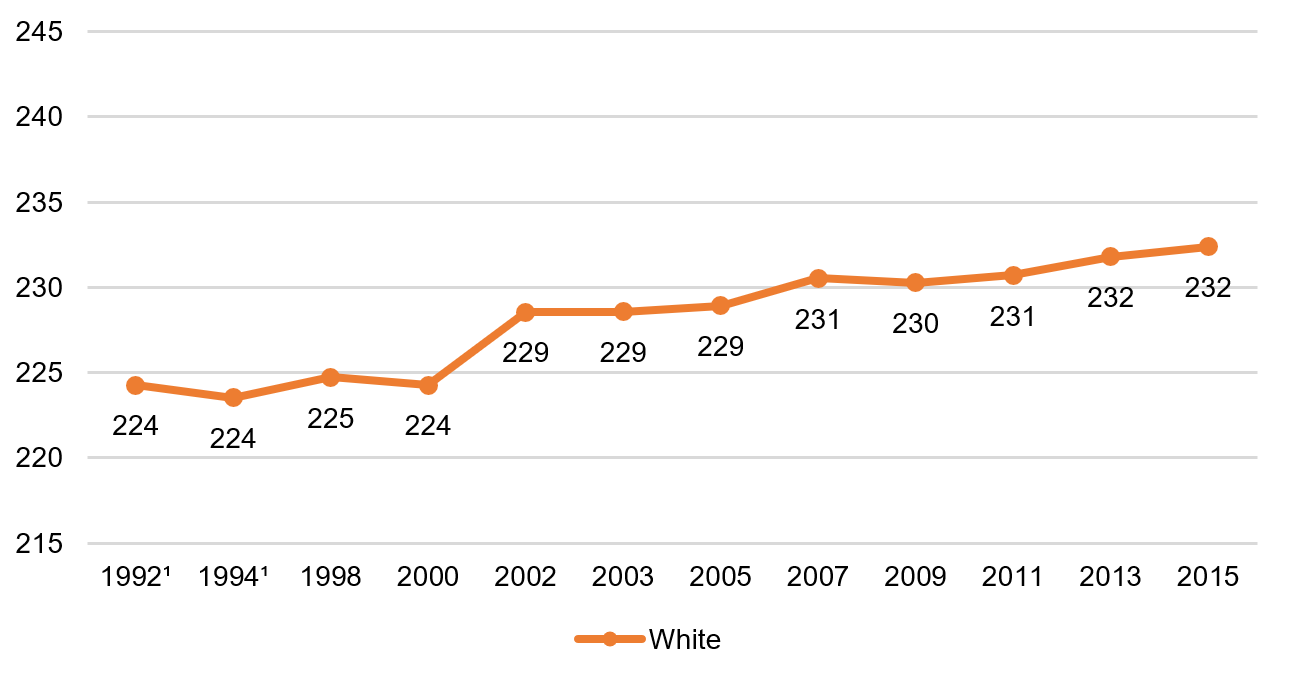
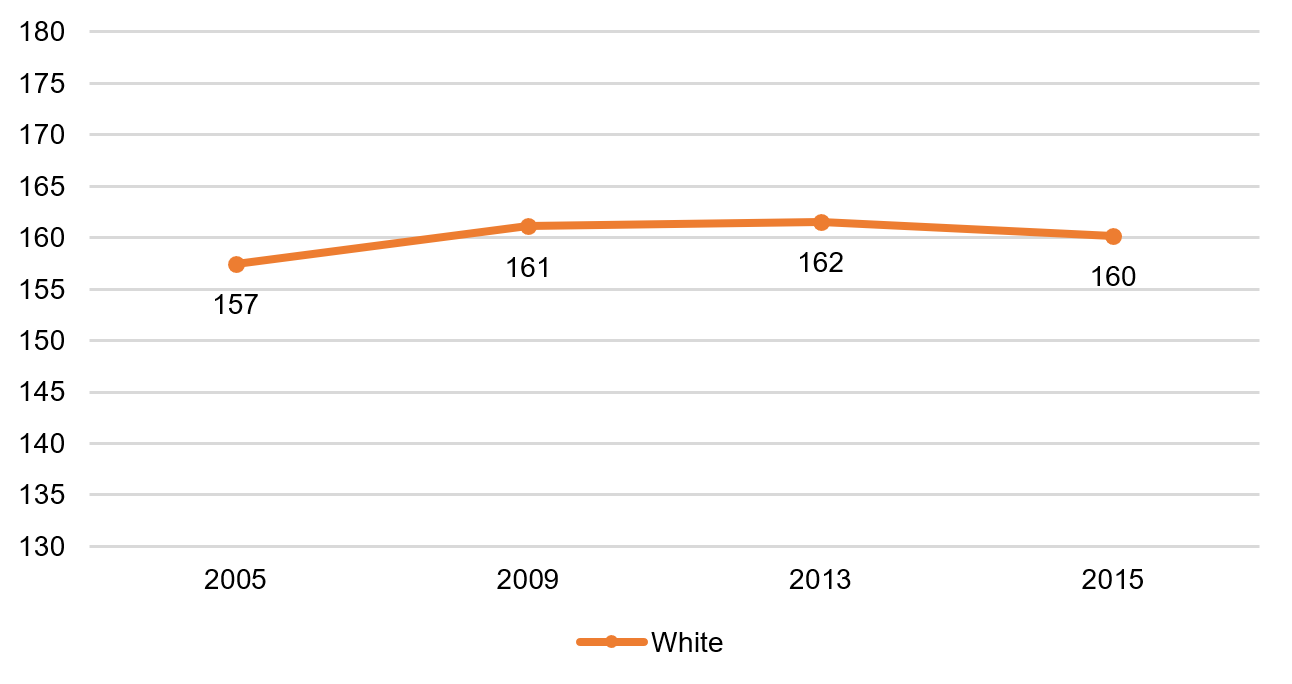
- Fourth grade reading, white students, 1992–2015
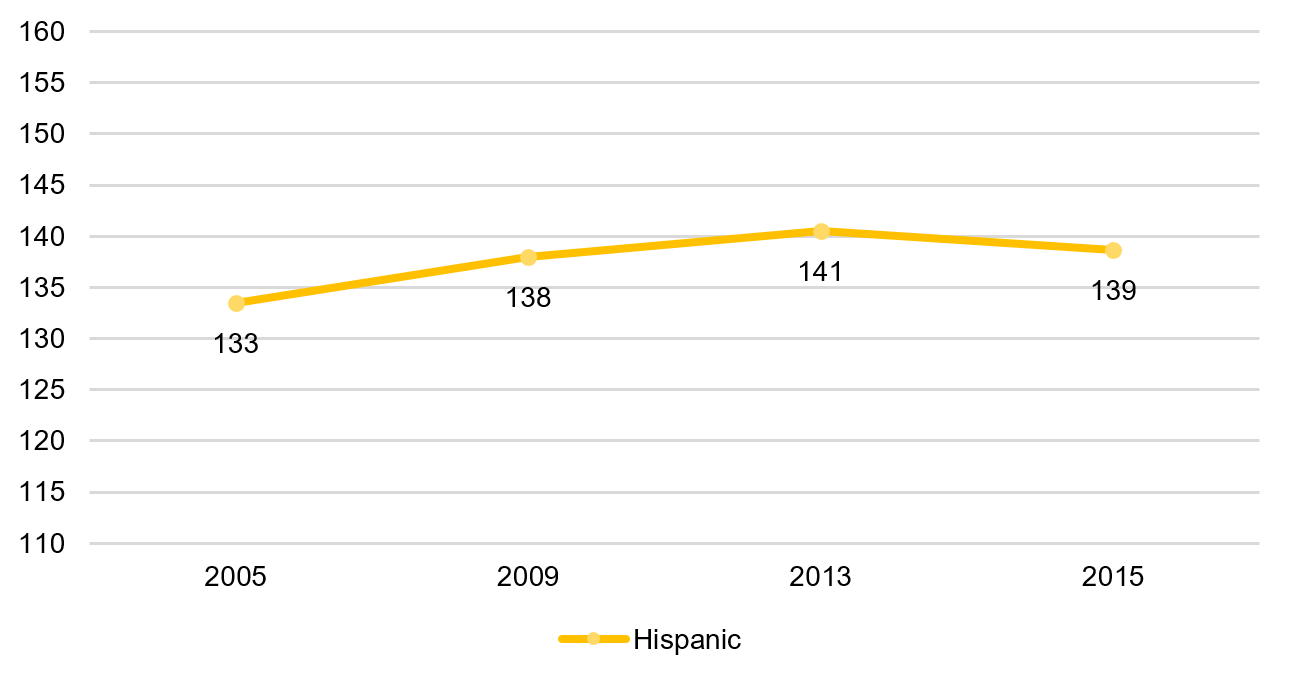
- Fourth grade reading, Hispanic students, 1992–2015
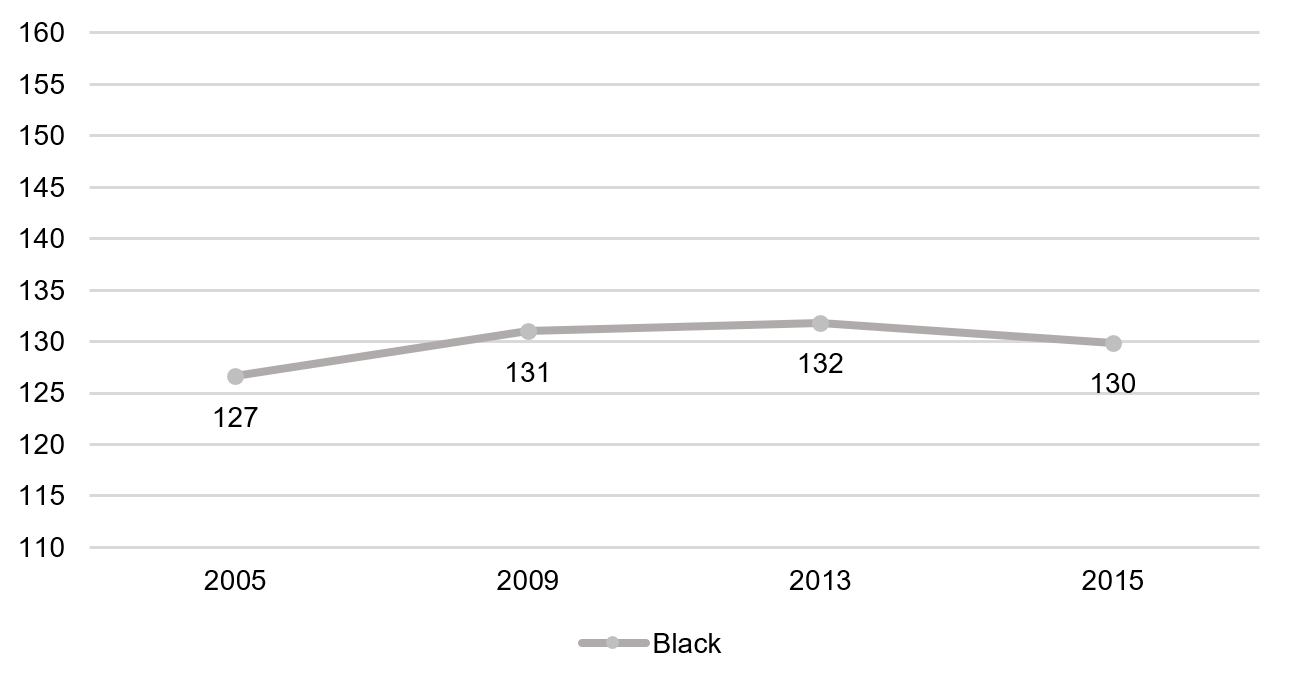
- Fourth grade reading, black students, 1992–2015
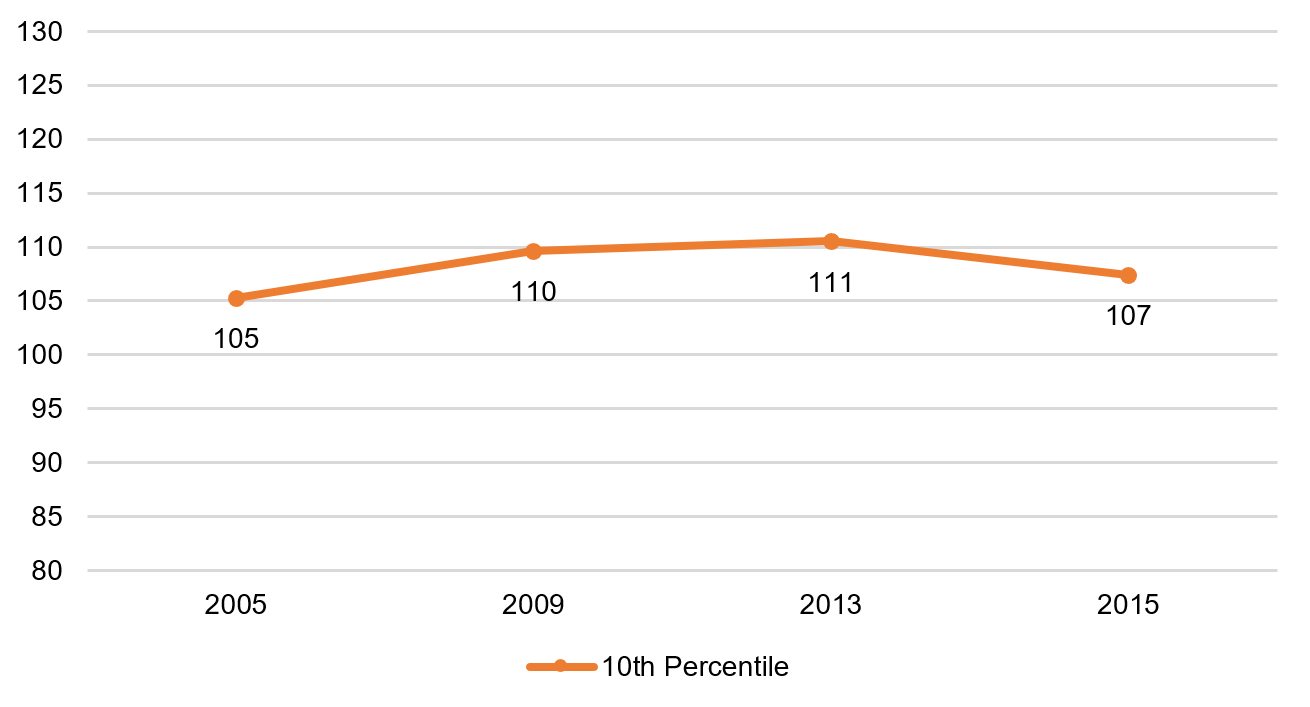
- Fourth grade reading, 10th percentile, 1992–2015
- Fourth grade reading, 90th percentile, 1992–2015
- Eighth grade reading, white students, 1992–2015
- Eighth grade reading, Hispanic students, 1992–2015
- Eighth grade reading, black students, 1992–2015
- Eighth grade reading, 10th percentile, 1992–2015
- Eighth grade reading, 90th percentile, 1992–2015
- Twelfth grade reading, white students, 1992–2015
- Twelfth grade reading, Hispanic students, 1992–2015
- Twelfth grade reading, black students, 1992–2015
- Twelfth grade reading, 10th percentile, 1992–2015
- Twelfth grade reading, 90th percentile, 1992–2015
Math
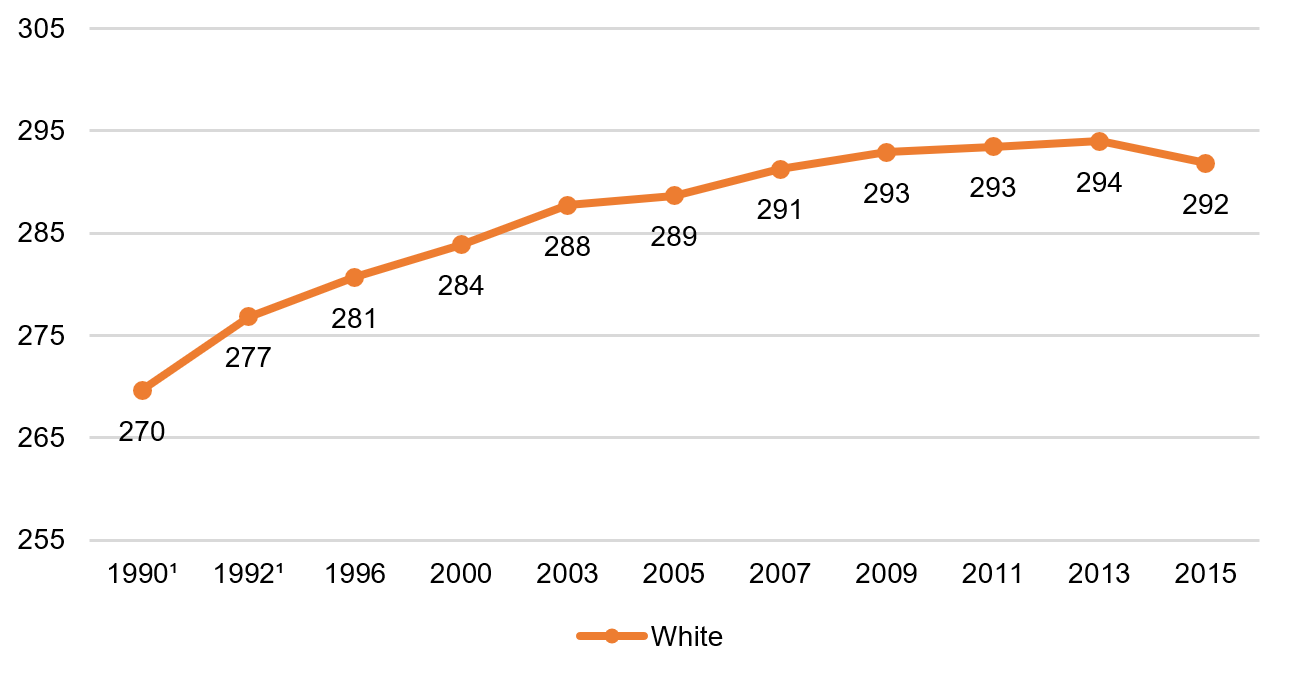
- Fourth grade math, white students, 1990–2015
- Fourth grade math, black students, 1990–2015
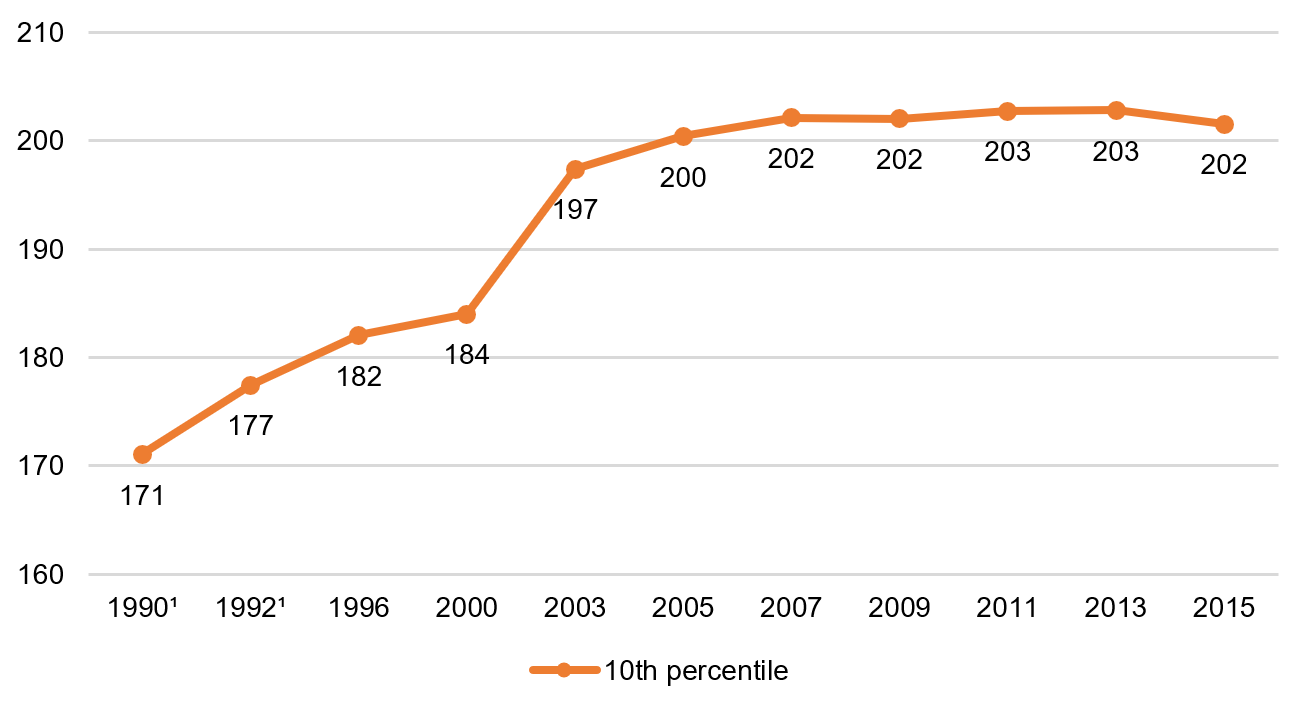
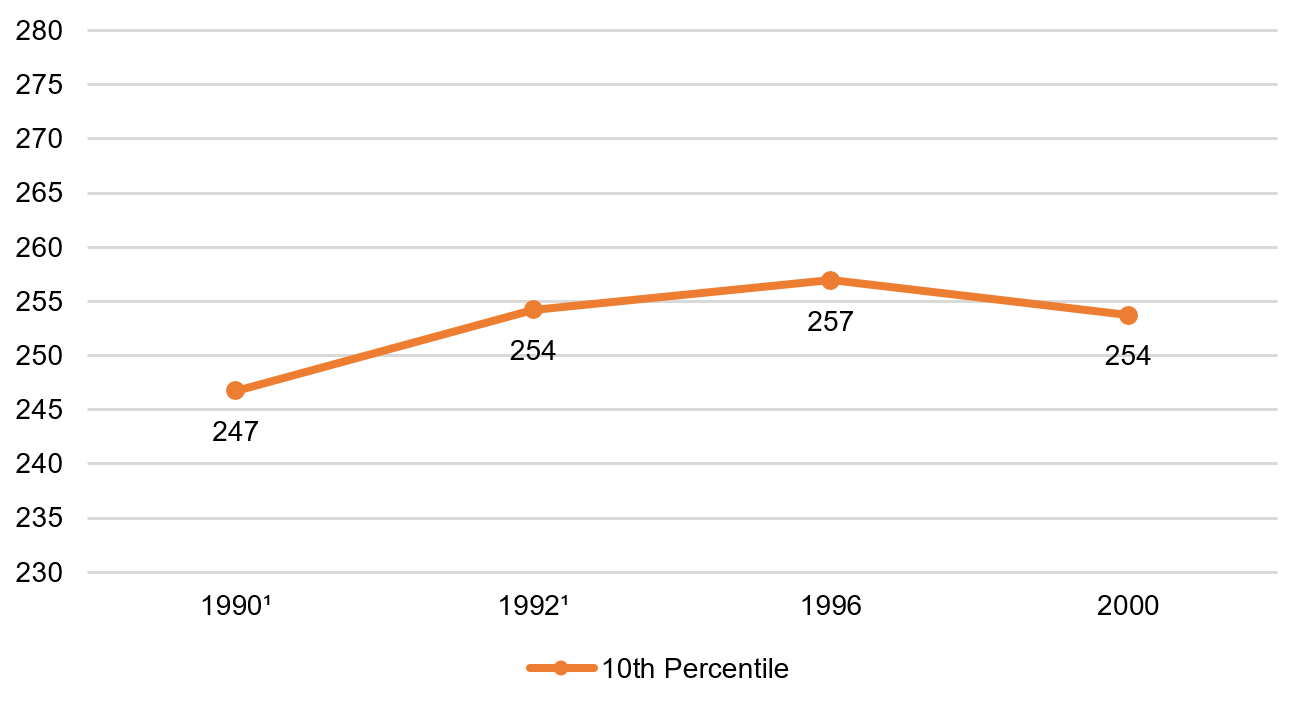
- Fourth grade math, 10th percentile, 1990–2015
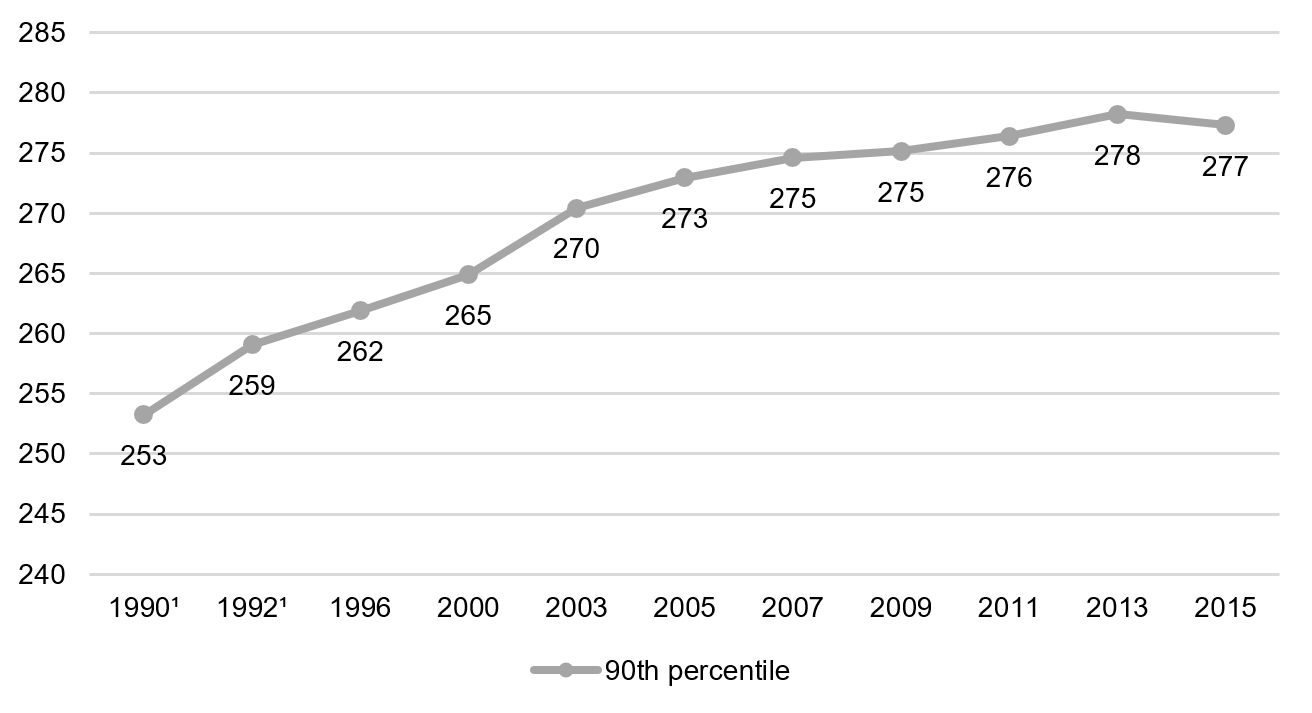
- Fourth grade math, 90th percentile, 1990–2015
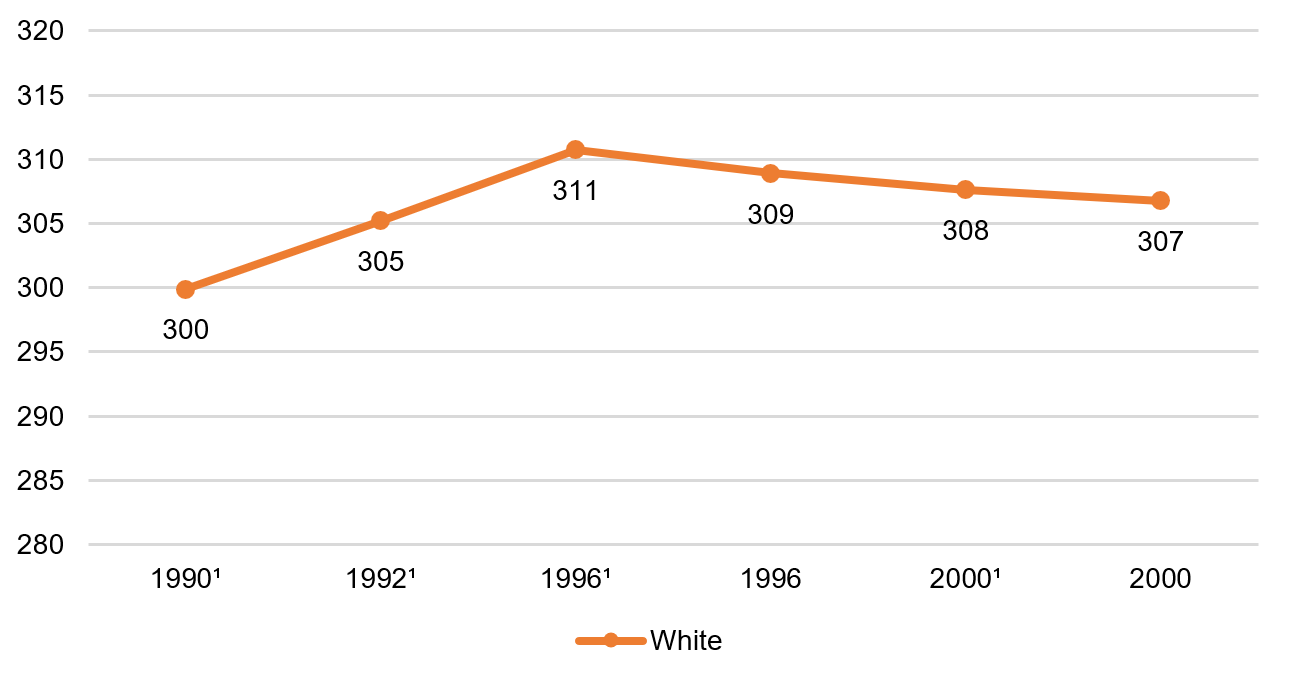
- Eighth grade math, white students, 1990–2015
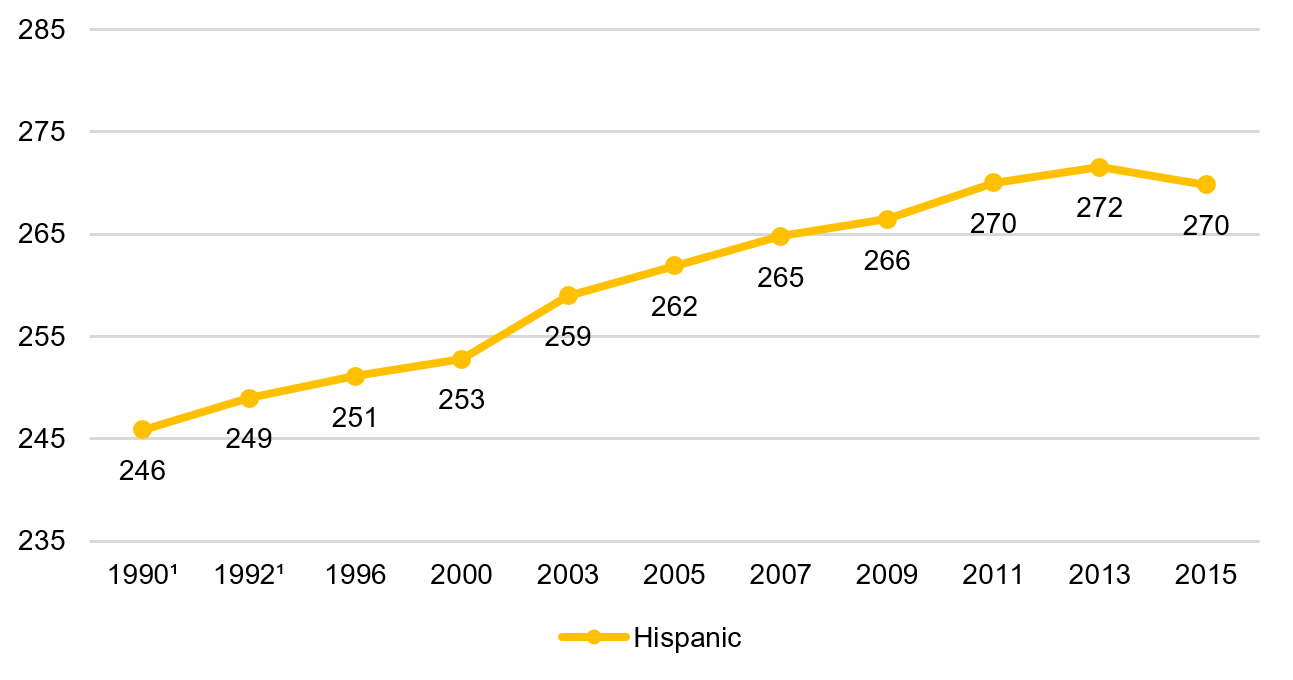
- Eighth grade math, Hispanic students, 1990–2015
- Eighth grade math, black students, 1990–2015
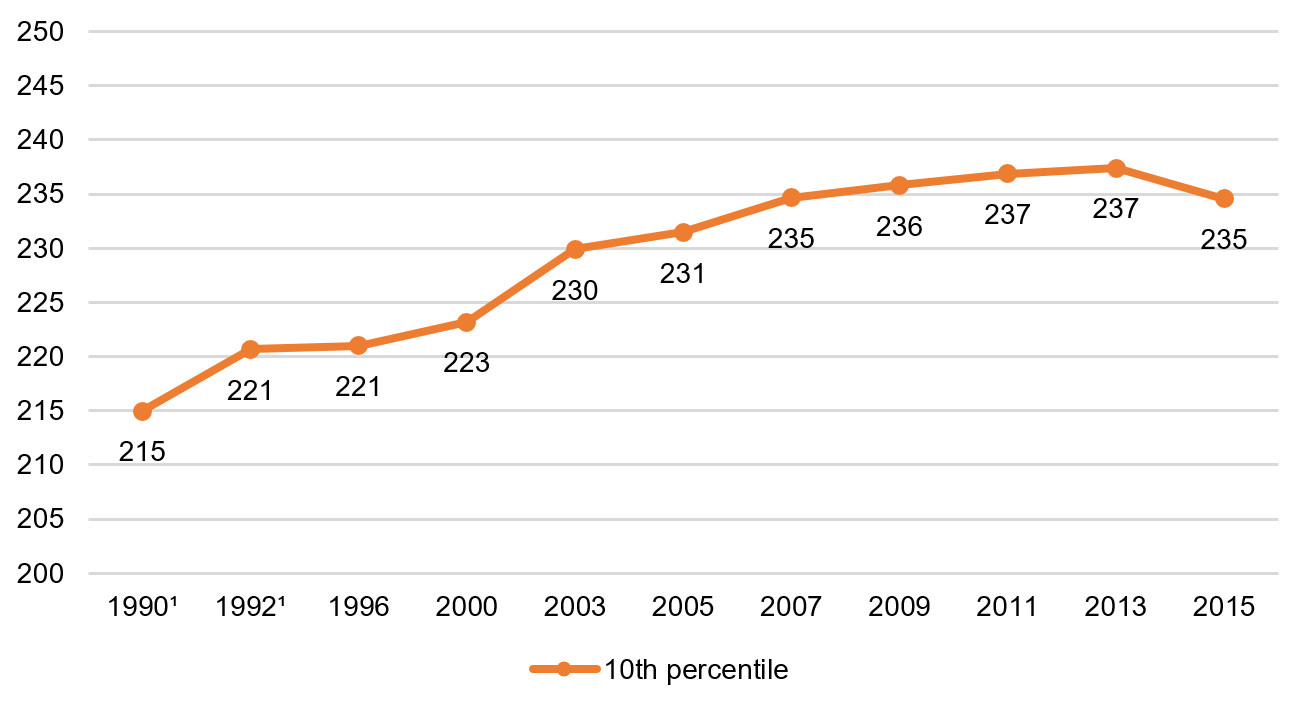
- Eighth grade math, 10th percentile, 1990–2015
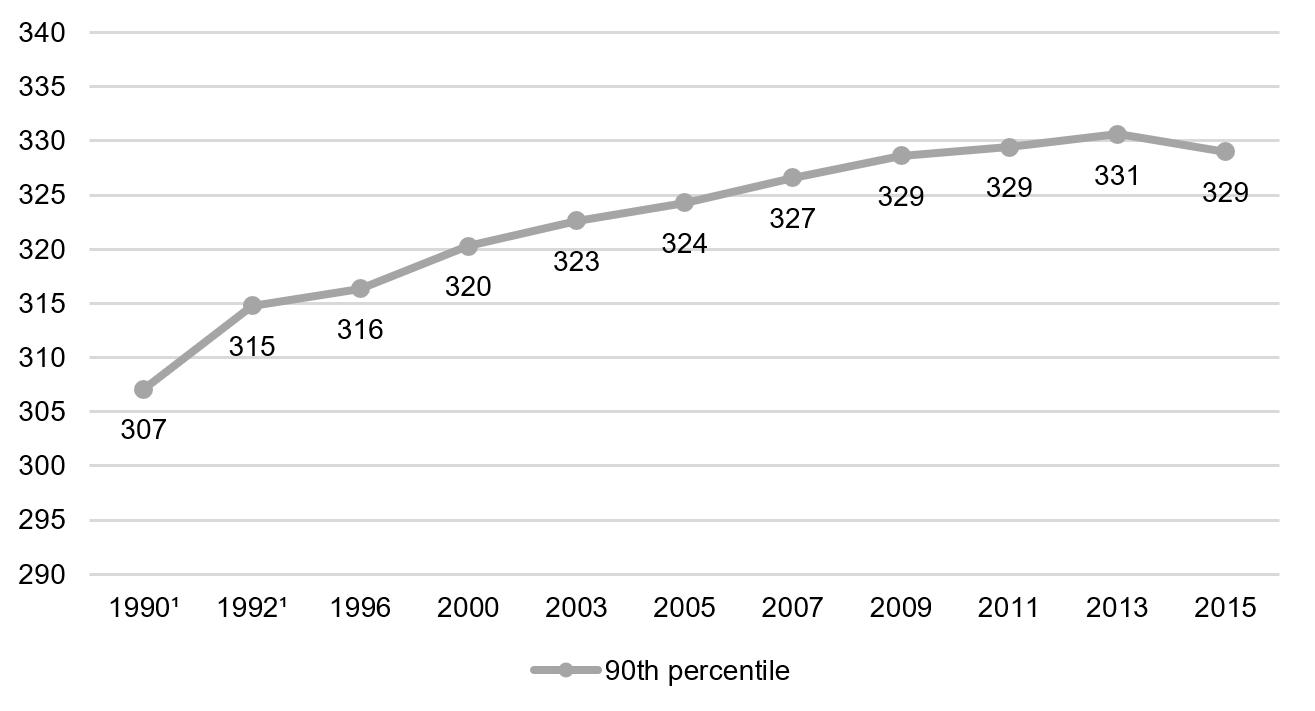
- Eighth grade math, 90th percentile, 1990–2015
- Twelfth grade math, white students, 1990–2015
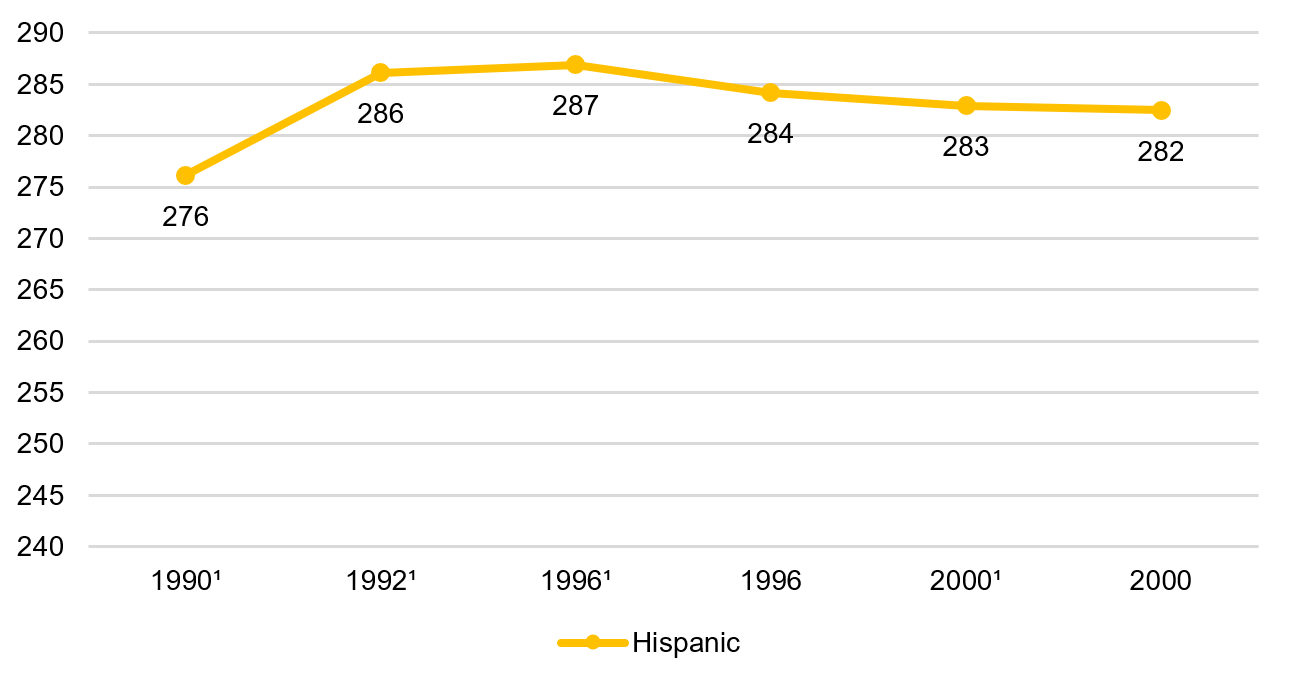
- Twelfth grade math, Hispanic students, 1990–2015
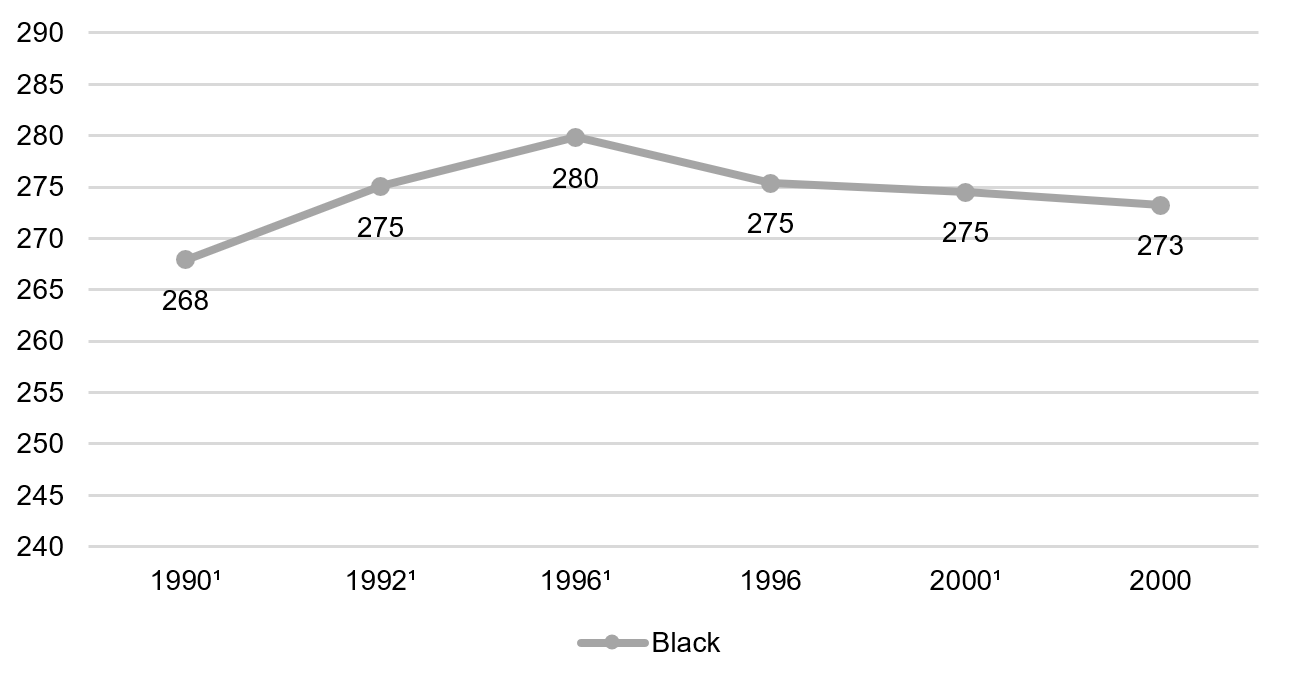
- Twelfth grade math, black students, 1990–2015
- Twelfth grade math, 10th percentile, 1990–2015
- Twelfth grade math, 90th percentile, 1990-2015