Mobile Navigation

  • National
    • Policy
      • High Expectations
      • Quality Choices
      • Personalized Pathways
    • Research
    • Commentary
      • Gadfly Newsletter
      • Flypaper Blog
    • Events
    • Scholars Program
  • Ohio
    • Policy
      • Priorities
      • Media & Testimony
    • Research
    • Commentary
      • Ohio Education Gadfly Biweekly
      • Ohio Gadfly Daily
  • Charter Authorizing
    • Application
    • Sponsored Schools
    • Resources
  • About
    • Mission
    • Board
    • Staff
    • Career
Home
Home
Advancing Educational Excellence

Main Navigation

  • National
  • Ohio
  • Charter Authorizing
  • About

Ohio Menu

  • Topics
    • Accountability & Testing
    • Advanced Education
    • Career & Technical Education
    • Charter Schools
    • Curriculum & Instruction
    • ESSA
    • Evidence-Based Learning
    • Governance
    • Personalized Learning
    • Private School Choice
    • School Finance
    • Standards
    • Teachers & School Leaders
  • Research
  • Policy
  • Commentary
    • Ohio Gadfly Newsletter
    • Ohio Gadfly Blog
    • Events

The Education Gadfly Weekly

Sign Up to Receive Fordham Updates

We'll send you quality research, commentary, analysis, and news on the education issues you care about.
Thank you for signing up!
Please check your email to confirm the subscription.

Ohio Gadfly—How Columbus City Schools went broke

Volume 20, Number 8
4.9.2026
4.9.2026

Ohio Gadfly—How Columbus City Schools went broke

Volume 20, Number 8
view
Vlad Kogan blog on CCS finances blog image
School Funding

How Columbus went broke—and lessons for other districts

Twice each year, Ohio school districts must submit medium-term financial forecasts to the state, and the most recent updates released in early March paint a bleak picture.

Vladimir Kogan 4.9.2026
OhioOhio Gadfly Daily

How Columbus went broke—and lessons for other districts

Vladimir Kogan
4.9.2026
Ohio Gadfly Daily

No, Ohio should not do an abrupt U-turn on state testing

Aaron Churchill
4.14.2026
Ohio Gadfly Daily

Teacher professional development around reading science is greatly improved. Here’s what Ohio must do next.

Jessica Poiner
4.8.2026
Ohio Gadfly Daily

Grade inflation has infected Ohio’s school report cards. Here’s how to address it.

Aaron Churchill
4.10.2026
Ohio Gadfly Daily

Stormy weather for college application decisions?

Jeff Murray
4.14.2026
Ohio Gadfly Daily

Another deep dive into estimates of economic returns to education

Jeff Murray
4.9.2026
Flypaper
view
State testing NRT SB 19 blog image

No, Ohio should not do an abrupt U-turn on state testing

Aaron Churchill 4.14.2026
Ohio Gadfly Daily
view
Next frontier SoR blog image

Teacher professional development around reading science is greatly improved. Here’s what Ohio must do next.

Jessica Poiner 4.8.2026
Ohio Gadfly Daily
view
Grade inflation report card blog image

Grade inflation has infected Ohio’s school report cards. Here’s how to address it.

Aaron Churchill 4.10.2026
Ohio Gadfly Daily
view
Weather and college choices SR image

Stormy weather for college application decisions?

Jeff Murray 4.14.2026
Ohio Gadfly Daily
view
Chalkboard arrow

Another deep dive into estimates of economic returns to education

Jeff Murray 4.9.2026
Flypaper
view
Vlad Kogan blog on CCS finances blog image

How Columbus went broke—and lessons for other districts

Vladimir Kogan
4.9.2026
Ohio Gadfly Daily

Twice each year, Ohio school districts must submit medium-term financial forecasts to the state, and the most recent updates released in early March paint a bleak picture.

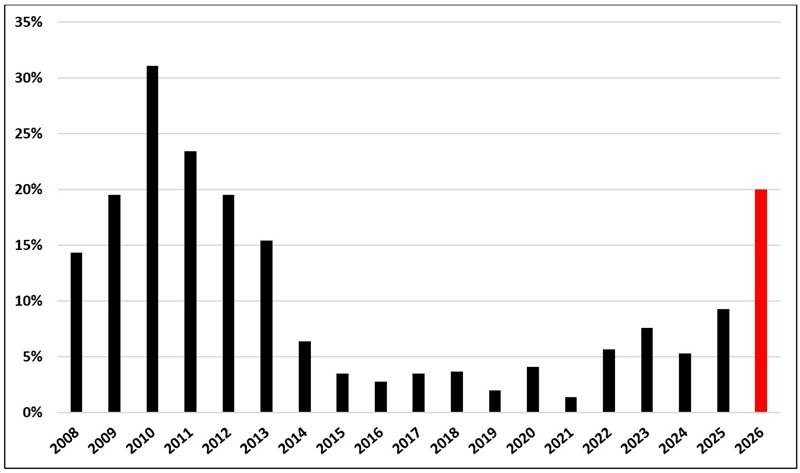
Four out of ten districts expect their expenditures to exceed revenues at the end of this fiscal year. By 2029, 85 percent project operating in the red. Absent revenue increases or spending cuts, one in five school districts could end that year with a negative cash balance—effectively bankrupt.

This represents a sharp deterioration from last year, and indeed the worst financial stress to confront Ohio school districts since the depths of the Great Recession (see Figure 1).

Figure 1. Percent of Ohio districts projecting negative cash balance in three years
Vlad Kogan blog on CCS finances figure 1 revised

Columbus City Schools, the largest district in the state, is among those currently on a course for insolvency. The district serves as a cautionary tale for many of the governance challenges facing public education in Ohio. It illustrates both how political pressures can push districts to make irresponsible, short-term hiring and spending decisions and the extent to which their leaders will go to pass the buck when the bill eventually comes due.

This is the story about how Columbus went broke, and what others should learn from it.

No, state “underfunding” is not to blame

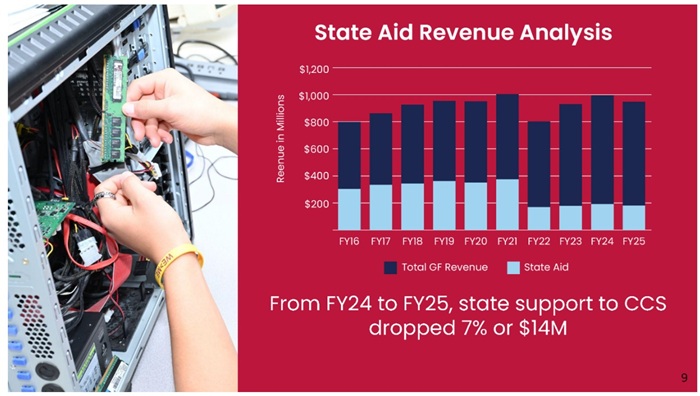
At a special board meeting called to deal with the district’s projected $100 million budget crisis last November, Columbus Superintendent Angela Chapman’s presentation included a shocking graph. A slide titled “State Aid Revenue Analysis” (reproduced in Figure 2 below) appeared to show a sharp reduction in state funding, from nearly $400 million in 2021 to below $200 million in recent years.

Figure 2. Slide from Columbus superintendent board presentation on November 13, 2025
Vlad Kogan blog on CCS finances figure 2

“The state used to be a big player in education,” Chapman explained to the board. “In 2022, they provided more than 30 percent of our budget in CCS [Columbus City Schools]. Today, that is closer to 15 percent. And it will be 10 percent in 2027.”[1]

“We know right now we’re in this budget situation not because we did this, but because our state house did this, because our federal government is doing this,” board member Jen Adair emphasized later in the meeting, lest anyone miss the implication.

Adair would go on to include the same figure in a social media post a few days later. Structured as a Q & A, the post asked why the district faced a massive budget deficit and went on to answer with this: “Great question! The main reason is because the State has not fully funded public education for the next two years.”

The slide and comments are misleading, to say the least. They misrepresent what was a purely accounting change—one that actually benefited Columbus financially—and create the false impression that the state has reduced its financial support for the district.

Some background: Before 2022, Ohio utilized a “pass-through” funding model that sent dollars ultimately destined for charter schools and to pay for EdChoice vouchers through students’ district of residence. In Columbus, millions of state dollars were recorded as revenue, but then immediately left the door as payments to charter schools and parents using private school vouchers.

Due to a quirk in the school funding formula at the time, which capped state payments to the district, Columbus officials blamed the “pass-through” approach for “bleeding” the district. They complained, quite reasonably, that payments Columbus was required to make to charter and private schools exceeded the amount of state funding provided for these students.

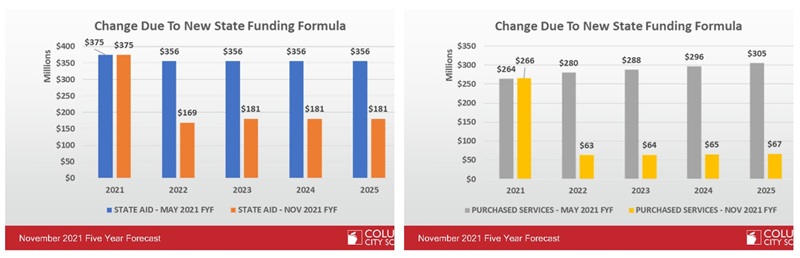
The district lobbied lawmakers to replace this flawed pass-through approach with a “direct” funding model, in which the state would write checks to charter schools and for vouchers itself, without funneling the dollars through Columbus’s bank accounts. As noted in a presentation to the Columbus school board in November 2021, this reform had the effect of reducing state revenue by nearly $200 million (left panel of Figure 3), although this represented a paper loss because it was money the district never expected to keep. The same accounting change reduced expenditures even more (right panel of Figure 3), with the district ultimately coming out at least $30 million ahead each year.[2]

Figure 3. Slides from November 2021 Columbus board presentation, showing that shift from “pass-through” to “direct” state funding of charter and voucher students caused the district to come out at least $30 million ahead per year
Vlad Kogan blog on CCS finances figure 3

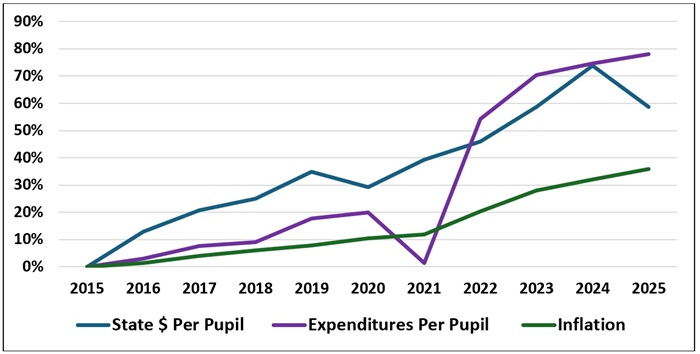
To be sure, the state legislature delayed phasing in a new funding formula adopted the same year and hasn’t regularly updated it to reflect higher costs, the complaints implied in Adair’s statement. However, as Figure 4 shows, net per-pupil state funding after accounting for the charter and scholarship deductions in Columbus has increased by nearly 60 percent over the past ten years, far outpacing inflation.[3] Since the transition to the new state formula in 2022, state dollars have continued to grow faster than inflation. In recent years, some of this increase has been offset by a state penalty Columbus has had to pay for its failure to meet its legal obligation to transport charter and non-public school students, a mess of its own making.

The bottom line is that Adair is wrong. State funding—or lack of it—is clearly not the underlying cause of the district’s fiscal stress.

Figure 4. Change in state funding and expenditures in Columbus City Schools since 2015
Vlad Kogan blog on CCS finances figure 4

Declining enrollment, increased hiring

If lack of revenue is not responsible for Columbus’s budget crisis, the problem must be on the other side of ledger—excessive expenditures. Figure 4 confirms that this is the case, with spending per pupil far outpacing the rate of inflation.[4] Before the pandemic, expenditures grew somewhat slower than state funding. Spending dipped during the pandemic year, as schools remained closed, but have exploded since then.

No doubt the $450 million in federal pandemic aid that Columbus received contributed to this recent spending spree, but the district seems to have committed the cardinal sin of using one-time dollars to pay for permanent, ongoing expenses. The former Columbus treasurer, Stan Bahorek, explicitly counseled district leaders that this was a bad idea in the early days of the pandemic, reminding them of the “fiscal cliff” that came when the post–Great Recession federal aid ran out a decade ago.

In 2023, district disclosures noted that temporary federal dollars were covering the cost of 430 district staffing positions. “This represents a significant risk … and will impact the scope and magnitude of budget reductions needed to offset the cost of these positions,” the document warned ominously.

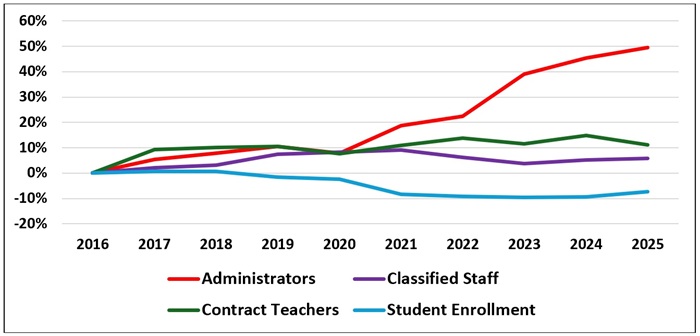
As Figure 5 shows, some of spending splurge has indeed paid for increased staffing levels, despite declining student enrollment.[5] The district has lost 7 percent of its students over the past decade. During the same period, the number of teachers increased by more than 10 percent and classified staff went up 6 percent. The number of administrators has jumped by nearly half.

The timing of these changes is important. Most of the enrollment losses came after the pandemic, in part due to the district’s prolonged closures. Like the transportation penalty, this is a self-inflicted wound.

Columbus public health officials insisted that schools could and should reopen as early as October 2020, yet the district stayed remote for months longer due to intransigence from the district’s teachers union. It would take the threat of Governor Mike DeWine not putting teachers at the front of the Covid-19 vaccine line for in-person instruction to resume, in spring 2021. But by then, the damage had already been done.

Most of the increase in teacher and classified hiring took place before the pandemic, while the sharp increase in the ranks of administrators occurred after 2021.

Figure 5. Changes in enrollment and staffing in Columbus over time
Vlad Kogan blog on CCS finances figure 5

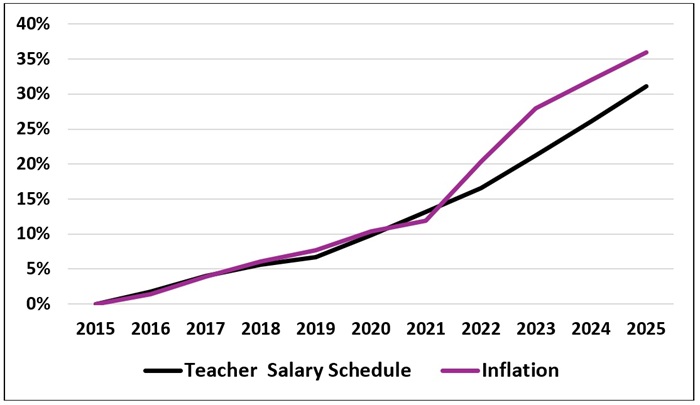
Importantly, increased hiring has not come at the expense of compensation. Until the pandemic, teacher salaries at each level of education and experience in the Columbus pay schedule rose roughly in line with inflation (see Figure 6). Salaries fell somewhat behind in subsequent years—increasing by a total of 31 percent over the course of the decade, about 5 percentage points slower than cumulative inflation over the same period. But the pay of individual teachers rose even more than the salary schedules indicate, as they gained experience and moved to higher “steps” in the salary schedule.

Figure 6. Change in Columbus teacher salary schedule
Vlad Kogan blog on CCS finances figure 6

Academic outcomes have declined

District leaders have claimed that increased hiring reflects a strategic effort to move the needle on student achievement and warned that pending layoffs required to close the deficit will undo some of those gains. But on this point, the district is again distorting the evidence.

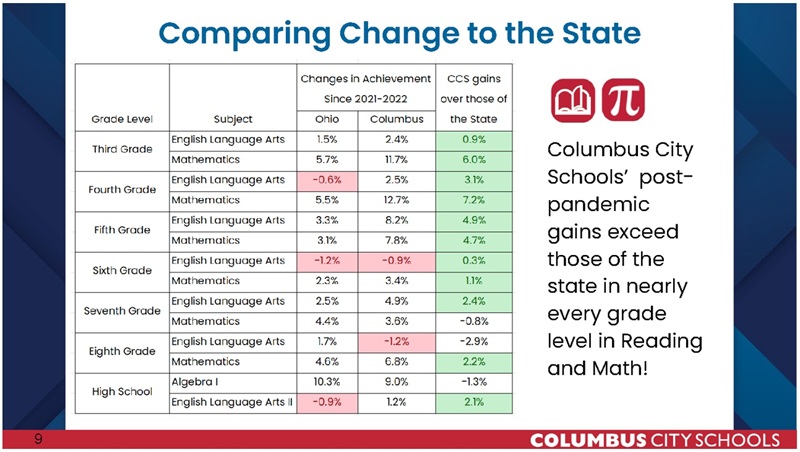
A presentation to the school board last fall (Figure 7), shortly after the release of the annual state report cards, triumphantly claimed that “Columbus City Schools’ post-pandemic gains exceed those of the state in nearly every grade level in Reading and Math!”

Figure 7. Slide from Columbus school board presentation on September 16, 2025
Vlad Kogan blog on CCS finances figure 7

But this comparison intentionally focused only on the post-pandemic period—starting at the nadir, after Columbus suffered some of the largest academic declines in Ohio least in part due to its extended closures. And the recovery in the years since also reflects changes in student composition, with gains concentrated in the youngest grades, where performance of incoming cohorts unaffected by pandemic disruptions is compared to students who were enrolled when schools were closed.

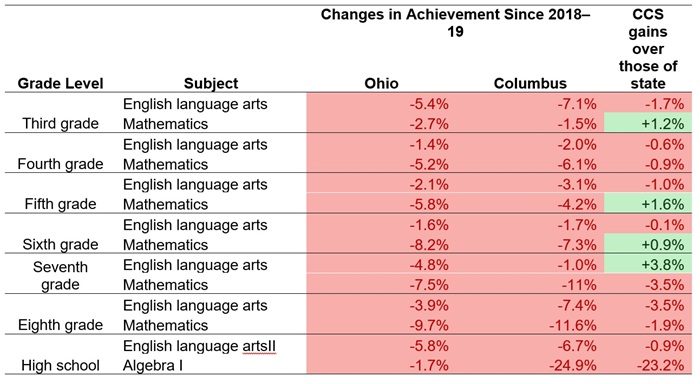
Figure 8 recreates the same analysis but instead uses 2018–19, the last year before the pandemic, as the starting point. It paints a very different picture. Not only is achievement of Columbus students still below the levels seen prior to the pandemic, including among younger grades who started school afterward, but the district has fallen further behind the rest of the state in most grades and subjects.[6]

The sharp increase in spending and increase in staffing has not produced an academic miracle. Instead, student outcomes have moved in the wrong direction.

Figure 8. Comparison of proficiency rate changes in Columbus vs. Ohio Statewide since 2018–19
Vlad Kogan blog on CCS finances figure 8

Misplaced focus, priorities

Given robust evidence that more money typically does produce better academic outcomes, one should wonder why the massive increase in spending in Columbus in recent years has not moved the academic needle more.

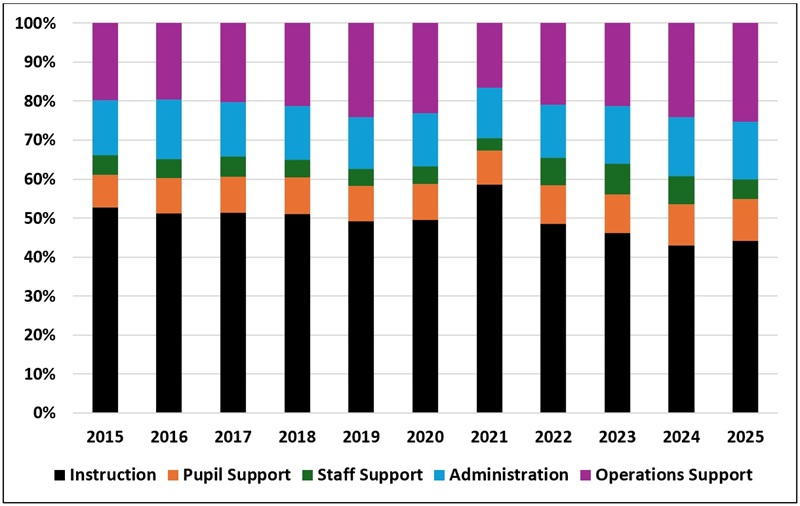
Part of the story is that a smaller slice of that growing pie is reaching the classroom. A decade ago, more than 60 percent of Columbus expenditures went toward student-facing services, paying for instruction and pupil support (see Figure 9). This peaked at nearly 70 percent during the pandemic, as shuttered buildings produced savings on operations and transportation. By last year, however, only 55 cents of every dollar spent by the district was going into the classroom.

The share of total expenditure on operations—including building maintenance, student transportation, and food services—has risen from 20 percent in 2015 to 25 percent a decade later. Since overall spending has grown sharply during this period, the absolute dollar amount spent per student on operations has increased by an astronomical 230 percent over this period. The refusal of the school board (until recently) to close underutilized buildings, even as enrollment declined, has contributed to these growing costs.

Increasingly, Columbus seems to operate primarily as an adult employment agency, where academic instruction and student learning are merely incidental and of secondary importance.

Figure 9. Share of Columbus expenditures by service category
Vlad Kogan blog on CCS finances figure 9

Dark path ahead

The Columbus story—irresponsible spending of one-time pandemic aid, failure to match staffing to enrollment trends, diverting money from core academic functions, and blaming the state without taking responsibility for imprudent decisions—likely applies to many other Ohio districts facing budget challenges today.

Unfortunately, the news will probably get worse. The two simplest solutions from the point of view of district leaders—more state aid and local property tax increases—are unlikely to materialize in the current environment.

Medicaid costs already account for half of the state budget, and recent changes in federal law that push more of these and other social program costs to the states will create significant pressure on the Ohio budget. If the economy tips in to recession, state revenues will decline sharply, and policymakers facing massive deficits will be in no position to increase K–12 spending.

Similarly, the backlash to rising property values have fueled an effort to abolish property taxes, and recent state reforms designed to alleviate these demands have removed many of the tricks districts previously used to passively increase revenues without voter approval. In many communities, convincing voters to increase their taxes will be an uphill battle.

Districts around the states will have to make hard decisions, including prioritizing academics. This means implementing layoffs wisely—based on teacher quality, not seniority—and finding efficiencies that both reduce costs and help students, such as shuttering failing and underenrolled schools.

Columbus offers a critical test case for whether local officials will actually make the necessary but politically unpopular decisions. The district’s recent track record, unfortunately, is not encouraging. 

Vladimir Kogan is a senior research fellow at the Thomas B. Fordham Institute and a professor of political science at the Ohio State University. He is the author of the 2025 book No Adult Left Behind: How Politics Hijacks Education Policy and Hurts Kids (Cambridge University Press).



[1] In addition to being highly misleading, for the reasons I describe in this article, it’s unclear where the numbers in Chapman’s comments are coming from. She may have misspoken, referencing 2022 instead of 2021 as the high point in state funding. But the other figures don’t match those in the district’s five-year financial forecast.

[2] In their enthusiasm in lobbying in favor of the direct-funding reform, Columbus leaders apparently failed to anticipate an unintended consequence that reduced some of the financial upside. Previously, charter and voucher-receiving private school students counted as part of total Columbus enrollment, making the district look poorer. When these students were removed from the denominator after the shift to direct-funding, Columbus became much wealthier on paper—with assessed property values per pupil rising from just below $173,000 in 2021 to $290,000 in 2022—thereby reducing the district’s eligibility for state funding, which is allocated on a need basis.

[3] My calculations use the state foundation formula settlement reports and subtracts transfers made for charter schools, open-enrollment students, and voucher students and payments to education services centers. I also don’t include state funding related to preschool special education. This provides the cleanest “apples-to-apples” over-time analysis, but does not account for other state sources of revenue that are not allocated through the statutory funding formula, including casino revenues and money to compensate for certain property tax exemptions.

[4] Some might reasonably object to using official consumer price measures to adjust costs over time, since school districts don’t purchase the same “basket” of goods used for this calculation and instead spend over 80 percent of the dollars on salaries and benefits. As it turns out, the Employment Cost Index for professional employees during this period grew slower than overall inflation, so using that alternative deflator would actually make the Columbus spending increase look even more striking.

[5] Figure 5 uses data from personnel reports provided to the school board at every meeting and reflects filled, not budgeted, positions. I use counts from the first regular board meeting of each school year. If I instead take staffing data from January of each year, the changes in staffing over time remain similar, although the increase in teacher numbers is somewhat smaller. Note that the staffing data begin starting in the 2015–16 school year because the format of the report changed that year and is not directly comparable to earlier periods.

[6] Comparing changes in proficiency rates in Columbus to trends only in the other large, urban districts rather than the entire state paints a mixed picture, at best. Columbus has fallen behind the other Ohio urban systems in half of the tested grades and subjects during the same period.

view
State testing NRT SB 19 blog image

No, Ohio should not do an abrupt U-turn on state testing

Aaron Churchill
4.14.2026
Ohio Gadfly Daily

The Ohio House Education committee recently added an amendment to Senate Bill 19 that threatens to upend state testing. If passed into law, it would require the Ohio Department of Education and Workforce to seek a waiver from the U.S. Secretary of Education allowing for a “nationally normed referenced” (NRT) test instead of the current state assessment. If approved, Ohio would change course on assessments.

Shifting to an NRT for the state assessment appears on its face to violate the federal education law known as the Every Student Succeeds Act (ESSA), as well as the Trump Administration’s commitment to transparency and comparability. But even if the secretary were to grant such a waiver, the NRT proposal is still a bad idea for Ohio. Here’s why.

1. It would undermine a fair, standards-based assessment and accountability system.

Standards and assessments go hand in hand. Content standards outline the knowledge and skills that students are expected to acquire at the end of each grade, while an end-of-year assessment gauges the extent to which students actually meet those standards. For instance, Ohio expects fourth grade students to “use decimal notation for fractions with denominators 10 or 100. For example, rewrite 0.62 as 62/100.” Thus, the fourth-grade math assessment might ask a student to write 7/10 as a decimal to demonstrate understanding of the content standard.

An integrated standards-and-assessment system is the fairest way of holding schools accountable for student learning. Think of it this way, using the example above: Without a standards-based assessment, a fourth grader might be asked to write 3/8 as a decimal. But that would be an unfair question because rewriting fractions with denominators outside of 10 and 100 are not expected under Ohio’s fourth-grade standards.

Recognizing the important link between standards and assessments, ESSA requires states to administer standards-aligned tests in accountability systems. The key passage reads:

The assessments under subparagraph (A) shall...be aligned with the challenging State academic standards, and provide coherent and timely information about student attainment of such standards and whether the student is performing at the student’s grade level.

Nationally-normed referenced tests do not meet this requirement—hence the need for a waiver—as questions are not tied to any particular state’s learning standards. Though NRTs can play a role in education—they are typically used to track student progress throughout a school year—they are not intended for use in state accountability systems. If used this way, NRTs undercut state standards, as schools are no longer held accountable for helping students achieve them.

2. It would throw state testing into turmoil—yet again.

Switching state tests is not like flipping a switch. Each assessment has its own IT requirements, administration procedures, test-score reporting formats, and more. Consider that Ohio’s test administration manual runs a dense 144 pages, covering important details such as test security, teacher and student logins, practice tests, and test-timing protocols. More than a decade ago, the annoyances and frustrations associated with changing state tests—from the OAA/OGT to PARCC—boiled over to the point that state lawmakers booted the new vendor out of Ohio. Fortunately, testing has settled down since then, with ten years of mostly smooth sailing under the state’s current assessment system. It seems unwise to risk throwing state testing into convulsion yet again, especially to move to a test that is less fair. Why put schools through another disruption?

3. It would open the door to a national testing company to impose its priorities onto Ohio schools.

As their name implies, NRTs are produced by testing companies that provide products and services across the entire country. As noted earlier, many American schools appropriately use these tests for diagnostic purposes. But the state test is different: It should reflect what Ohioans believe students should know and be able to do, not what a national testing company thinks is important (see the recent criticisms of the iReady test).

To ensure that the state test reflects local values and priorities, Ohio implements an assessment program that incorporates the expertise of the state’s educators. The learning standards, upon which the assessments are built, were developed and are periodically revised based on feedback from teachers and the wider public. The tests themselves are vetted by educators across the state. By contrast, there’s no guarantee that Ohioans would have any meaningful input if an NRT were used for the statewide assessment. If Ohio wants to maintain control over its state testing program—and it should--it must reject the idea of outsourcing assessment to a national vendor.  

4. It would scramble achievement trends and limit the ability to track progress.

An oft-overlooked benefit of a stable assessment program is the ability to track long-term educational progress. When Ohio made the (messy) transition to its current state tests, we lost a connection to historical achievement data. The tests were so radically different that meaningful analyses—like comparing 2005 OAA to 2015 PARCC results—weren’t possible. Breaking the trend line limits state and local leaders’ ability to understand whether initiatives are moving the achievement needle. Is the science of reading improving reading proficiency statewide? Is a district’s new math or reading curriculum boosting achievement? Without consistent test data, it will only be harder to tell.

A better path forward on state assessment

It’s been suggested that the move to an NRT would reduce testing in Ohio schools. Concerns about assessment burdens are legitimate, and there are indeed ways that Ohio could make state tests less burdensome as well as more useful to parents and educators. But Ohio need not throw the baby out with the bathwater.

First, regarding time burdens, it’s important to remember that Ohio has a cap on annual testing time. Under state law, students may not spend more than 2 percent of the school year—roughly 20 hours—on state assessments and local diagnostic tests combined. In addition, students may not spend more than 1 percent of the school year on test preparation. These are smart guardrails that should curtail significant over-testing. If concerns are percolating about testing time, state lawmakers could start by ensuring that these provisions are being enforced.

Second, as for improvement options, the SB19 amendment also includes promising language that directs DEW to develop a plan for a “next-generation, computer-adaptive” state assessment. This plan would outline how the testing system aligns to state academic standards, minimizes testing time, ensures a rapid turnaround in results, allows testing windows later in the school year, and reports students’ grade-level status and percentile rankings. These are all worthy of investigation—we have recommended some of these features before—as they have the potential to make state testing more efficient and its results useful to teachers and parents. The scope of these upgrades would be much narrower than making a wholesale switch to an NRT—more like going from an iPhone 16 to iPhone 17. Lastly, by directing DEW to create a plan, rather than rushing headlong into changes, it could also help the state avoid another testing mess.

Ohio should maintain a stable, standards-aligned state assessment system, one that reflects Ohio’s educational priorities and includes input and feedback from Ohio educators. Carefully exploring how the state can build a better system makes sense. But let’s think twice before abruptly pulling an NRT off the shelf.

view
Next frontier SoR blog image

Teacher professional development around reading science is greatly improved. Here’s what Ohio must do next.

Jessica Poiner
4.8.2026
Ohio Gadfly Daily

In 2023, Ohio lawmakers established a statewide initiative grounded in the science of reading, an evidence-based instructional approach that focuses on phonics and knowledge-building. The ultimate goal of the initiative is to boost Ohio’s troublingly low reading scores. And since studies show that teachers matter more than any other element of schooling, Ohio will need a teacher workforce that’s well-trained in reading science to make meaningful progress.

To their credit, policymakers attempted to beef up training for reading teachers well before they established a statewide initiative. State law has long required teacher candidates to complete a certain number of college coursework hours covering topics like phonics and reading instruction. Candidates are also required to pass a Foundations of Reading exam to determine whether they have mastered the requisite knowledge.

But these policies—both of which remain in effect—weren’t enough on their own to ensure that teachers were entering the classroom with a strong foundation. In fact, a 2023 NCTQ report found that just a third of Ohio’s elementary teacher preparation programs were providing adequate coverage of all five components of reading science.[1] Even worse, more than half were promoting approaches contrary to research-based methods—things like three-cueing, which encourages students to use pictures or context clues to guess at words instead of using phonics-based word recognition skills.

To address this issue, policymakers took a two-pronged approach. First, they focused on future educators by requiring the Ohio Department of Higher Education to conduct audits of the state’s teacher preparation programs to ensure their alignment with reading science. (Findings from the first round of audits were published in December.) Second, they focused on current educators by requiring all teachers and administrators to complete a professional development (PD) course in the science of reading. Going forward, DEW will maintain this introductory course and develop a new, competency-based one that licensed teachers must complete every five years.

In short, Ohio has made a lot of progress. But while introductory courses and five-year refreshers are helpful, they shouldn’t be the only PD opportunities available in a subject that can have such a massive impact on students’ futures. Teachers—and kids—deserve more.

One way to give it to them is by providing curriculum-based professional learning (CBPL), or development that’s grounded in the specific curriculum and instructional materials that teachers use in their classrooms. CBPL pairs high-quality curriculum and materials with regular training and consistent coaching that gives teachers individualized feedback on how they’re using the materials they interact with on a daily basis. Compared to traditional PD, CBPL is “active, ongoing, and focused on improving the rigor and impact of teachers’ lessons.” When done right, it aligns with the elements of effective professional development.

Teachers regularly participate in PD that covers a broad range of issues, from student safety and classroom management to AI and ed-tech. CBPL, however, is harder to come by. According to a RAND report, just 40 percent of Ohio teachers reported in 2021 that they engaged in collaborative learning on English language arts materials at least four times a year. Only 13 percent said they engaged in workshops or trainings on materials. A measly 8 percent said they received coaching on materials.[2]

State policymakers should ensure that more teachers have access to CBPL, especially in reading. A quick look at Ohio’s list of approved reading curricula reveals that all of the providers claim to offer some form of curriculum-based PD. But the quality and depth of these offerings is unclear. Are they seminars or videos that require teachers to just sit and listen? Or are they collaborative experiences that permit teachers to ask questions, engage with peers, and receive guidance from experts and mentors? Do they provide teachers with opportunities to practice what they’ve learned, receive feedback, and try again? Or are they one-and-done experiences that simply check a box?

To be clear, evaluating the curriculum-based PD that providers offer was not on the original agenda for DEW. The department was charged with identifying high-quality curricula and materials and creating an entry-level reading science course. It accomplished both. Now it’s time to take the next step, and that means providing teachers with ongoing, in-depth development that’s aligned to reading science and the specific curricula and materials they’re using.

Other states have proven this is possible. The Rhode Island Department of Education, for example, publishes a list of approved CBPL providers, all of whom hold statewide contracts through Rhode Island’s master price agreement and were selected through a statewide RFP. For districts interested in partnering with external vendors, the department provides a link to the professional learning partner guide offered by Rivet Education, a consulting group that’s already done the work of vetting providers. Rivet’s recommended partners for the science of reading or curricula that appear on Ohio’s approved list include well-respected organizations like Amplify, Education First, Relay Graduate School of Education, and TNTP.

Ohio policymakers should follow Rhode Island’s lead. They could start by calling on DEW to send out an RFP for CBPL providers that specialize in the reading curriculum and materials that appear on the state’s approved list. DEW (or a chosen contractor) could then vet applicants and establish an approved list like the one in Rhode Island. From there, Ohio policymakers could incentivize districts to offer CBPL by covering the cost if they choose to work with a provider on the state’s list.

Some lawmakers might balk at the idea of spending more money on early literacy. After all, Ohio has already invested roughly $200 million via its last two state budgets. But incentivizing districts and schools to offer CBPL is a win for everyone. Teachers would receive in-depth and ongoing training that’s customized to the materials they use every day. Administrators would have teachers and staff that not only feel better-supported but actually are better-supported, freeing up time, attention, and funds to spend elsewhere. Students would benefit from teachers who are beefing up their knowledge and improving their instructional practice. And policymakers who are eager to boost reading achievement would be one step closer to doing so.

Ohio leaders deserve kudos for how far the state has come with the science of reading. But now that the foundation is in place, it’s time to start building. Governor DeWine’s plan for instructional implementation teams and additional reading coaches is a good one. Adding CBPL to the mix would be even better.


[1] The five components are phonemic awareness, phonics, fluency, vocabulary, and comprehension.

[2] The report found similar numbers for math.

view
Grade inflation report card blog image

Grade inflation has infected Ohio’s school report cards. Here’s how to address it.

Aaron Churchill
4.10.2026
Ohio Gadfly Daily

Five years ago, the Ohio General Assembly overhauled school report cards. The reboot was necessary, as the former version had gotten bogged down with too many measures and unnecessary complexity. To their credit, state lawmakers crafted an improved report card whose design is now more streamlined and better balanced. But whether the report card maintains high expectations remains unsettled.

The overall rigor of the report card hinges greatly on where the state sets the performance benchmarks. At the time the legislation passed, state officials faced real challenges determining where exactly to place those targets, as the pandemic had scrambled education data. The state board of education did a respectable job establishing the initial grading scales, given the uncertainties in play.[1] It also put forth admirable principles to guide the standards-setting process. They included the following, which note the importance of high expectations and envision raised standards after a transition period.

  • The accountability system should be transparent and encourage high expectations for all students, schools, and districts.

  • The implementation of the new report card ratings should include transition time ... then appropriately transition to higher expectations for all students. Ohio should expect all students to reach proficiency or higher.

With four years of implementation on the books, it’s time for the Ohio Department of Education and Workforce (DEW) to raise the performance bar and follow these wise principles. Last year, 91 percent of districts and 78 percent of schools received overall ratings of three stars or above, which indicates “meeting or exceeding state standards.” Yet at the same time, just 60 percent of Ohio students achieved proficiency on state assessments—a troubling disconnect that DEW itself flagged in a 2024 analysis of the report card.

Soft standards are behind these rose-colored ratings, and the department has a perfect opportunity to tighten them as the relevant administrative rules are under review.[2] Here’s how state officials can raise expectations and help fulfill the promise of a rigorous report card (some of these issues have been covered in more detail in a recent series on the report card).

1. Demand greater progress on chronic absenteeism. Given the attendance crisis roiling Ohio schools, the state has rightly made cutting chronic absenteeism a top priority. In fact, Governor DeWine and DEW Director Dackin pledged to reduce absenteeism in half by 2029. Ohio still has a long way to achieve this goal, and it must get serious about holding schools accountable for attendance. Unfortunately, the report card gives credit to schools with unacceptable rates of chronic absenteeism through a weak improvement measure. Columbus City Schools, for instance, received full credit on the chronic absenteeism indicator last year, despite 53 percent of students being chronically absent, which represented a decline of just 1.6 percentage points versus the prior year. Schools and districts with sky-high absenteeism rates should have to make significantly more progress to earn accolades on this measure.

2. Take some of the hot air out of the graduation component ratings. Due to relaxed graduation standards—a story for another day—graduation rates and the ratings based on them have gone through the roof. Last year, 49 and 43 percent of districts and schools, respectively, received five-star graduation ratings.[3] These inflated ratings came perilously close to running afoul of a statutory provision that prohibits more than half of districts or schools from receiving any one rating. To ensure adequate differentiation, DEW should rescale (i.e., raise the benchmarks) for the graduation ratings.

3. Provide a more honest picture of achievement gaps. Stubborn achievement gaps continue to plague our school systems, and they ultimately represent diminished opportunities for Ohio’s low-income students, special-need students, and students of color. Last year, less than a quarter of students with disabilities achieved proficiency on state reading and math exams and only about one in three Black students met that mark. Despite these sobering numbers, the report card offers an almost jubilant portrayal of how Ohio schools educate our neediest children. Last year, 88 and 76 percent of districts and schools, respectively, were awarded three or more stars on the gap closing component, which focuses on specific student groups. Part of the problem is that DEW substantially softened its annual proficiency targets shortly after the pandemic, making it easier for schools to meet gap closing indicators. To provide a more realistic picture of Ohio’s progress in narrowing achievement gaps (or lack thereof), DEW should also raise the performance benchmarks for gap closing.

4. Fix the grading scale used to determine overall ratings. The overall rating combines the results of the various report card components to yield a bottom-line summary of school performance. As described in more detail previously, DEW’s method for converting scores on the underlying components into an overall rating is flawed. In essence, it implements a lenient “rounding” rule that subtly gives schools and districts an artificial bump in their overall rating, worth about a half-star. The rule also produces some head-scratching results. There are examples of schools receiving one-star component ratings across the board, only to receive a 1.5-star overall rating due to the misalignment. DEW should rescale the overall rating to remove the artificial inflation and link overall ratings more closely with the underlying component results.

***

Grade-inflation has crept into classrooms, and it’s creeping into Ohio’s report card. The basic problem with inflating grades and ratings is that it’s dishonest. It hides the truth and sweeps academic deficiencies under the rug. That’s not fair to students who need help or parents who deserve an accurate picture of student achievement. In the case of school report cards, inflated ratings withhold the truth not only from students and families, but also from the taxpayers who fund public education.

When Ohio adopted its current report card, promises were made that it would be a rigorous, fair, honest, and transparent system. Unfortunately, those promises aren’t being fully met. It’s time for state officials to take actions that raise expectations.


[1] The state board of education was tasked at the time with setting report card standards. Today, that responsibility lies with the Ohio Department of Education and Workforce.

[2] The department has proposed rule changes that would adjust the early literacy grading scale to account for statutory changes made within that component. So far, it has made no other proposals related to the report card.

[3] Ninety and 78 percent of districts and schools, respectively, received three or more stars for graduation (“meeting or exceeding state standards”).

view
Weather and college choices SR image

Stormy weather for college application decisions?

Jeff Murray
4.14.2026
Ohio Gadfly Daily

The college visit is a time-honored tradition in the search process, and how such tours go likely plays a role in any final application decision. A new working paper looks at one college visit wildcard—the weather—to see if something so arbitrary might actually sway kids’ final decisions.

The single college under study is unnamed (dubbed “institute of higher education” or IHE), but the trio of researchers all hail from Amherst College. They look at ten years of prospective student tour data at IHE—from summer 2016 through fall 2024, excluding summer 2020 through spring 2021 due to Covid restrictions—comprising more than 47,000 individuals. Data on participants include hometown, race, and gender. A proxy for family income is based on their residential zip code, sourced from the American Community Survey for the year of their visit. Hourly weather data from all visit days come from a resource called Visual Crossing Corporation. Details on college application and matriculation (or not) come from the National Student Clearinghouse. All tours were conducted on foot along designated routes, lasted approximately one hour, were mostly outdoors (with short stops in a couple of buildings along the way), and took place regardless of weather conditions. While some colleges give brownie points to applicants who took a tour, our researchers assure us this is not the case at highly-selective IHE.

Using a set of temporal fixed effects models, they find that “bad” weather of any kind reduced tour participants’ likelihood of applying to IHE. Hot weather—relative to what are deemed “moderate” temperatures for the area—reduced applications by 10.1 percent, and cold weather reduced applications by 5.9 percent. Relative to sunny conditions, precipitation reduced applications by 8.3 percent, and cloudy conditions reduced applications by 4.9 percent. Negative impacts of cold temperatures were driven entirely by students from warmer home states, who experienced a 14.6 percent reduction in applications. Tour weather effects tended to be larger for male than for female tour participants.

White tour participants experienced near-zero effects of tour weather; while Black, Hispanic, and Asian participants experienced large-magnitude impacts. For one example, precipitation on a tour reduced application rates for Asian individuals by 18.5 percent. Results are similar whether students registered for their tour several days ahead (that is, likely without regard to a timely weather forecast) or at the last minute. Finally, having one tour in bad weather had little to no impact on students ultimately attending college in general, but of course there are no data on their tour experiences at other schools leading up to the ultimate choice.

While “immoderate” weather on a tour day does seem to sway the application decisions of prospective students, there’s no way to know whether this is a good or a bad thing. Perhaps a calm and sunny day in March is a rarity, belying weeks of unbearable swelter or torrent that a new college freshman will end up hating despite what they saw on their tour. Maybe one chilly early April downpour is just the last call of winter, driving a prospective student to avoid a school and miss out on a halcyon spring at a great college. Recruiters and parents can only hope that no matter how influential a single day of weather is, that it is only one piece of data among a large and growing set of informational sources that young people will consider before making their final, fateful decision.

SOURCE: Olivia Feldman, Joshua Hyman, and Matthew McGann, “‘Feel’ as a Determinant of College Choice: Evidence from Campus Tour Weather,” NBER Working Paper (March 2026).

view
Chalkboard arrow

Another deep dive into estimates of economic returns to education

Jeff Murray
4.9.2026
Flypaper

Hot on the heels of a recent report that postulated a lower-than-commonly-believed economic benefit of formal schooling comes a brand new analysis that offers more proof of high marginal returns to education. Who is winning the battle of the impact estimates?

The earlier report (which we will call Clark, the name of its lead author) was a meta-analysis of 79 previous studies that the authors concluded showed evidence of two types of publication bias. These combined to suppress findings of small or null impacts of an additional year of education on individuals’ future earnings, leading to an overestimation of positive benefits. If those biases were not in place, Clark says, typical income boosts would be in the range of 0 to 3 percent. At least two of the papers cited in Clark were co-authored by Harry Anthony Patrinos and George Psacharopoulos, researchers from the University of Arkansas and the London School of Economics, respectively. Now Patrinos and Psacharopoulos have published a brand-new report that once again supports the more-commonly-found positive impacts in the 8 to 10 percent range…and more besides.

Their new paper is also a meta-analysis, comprising 191 impact estimates from 145 studies across 54 countries, including 45 of the studies also analyzed in the Clark paper. Cognizant of the findings in Clark, Patrinos and Psacharopoulos look to overcome the publication bias questions by compiling the “most comprehensive” collection of studies that report both ordinary least squares (OLS) regressions and other credibly causal estimates of economic impact to allow for comparison—especially estimates using instrumental variables (or IV) regressions. They also document and discuss the changing geographic and temporal composition of the evidence base (that is, increasing evidence from low-income and low-educational-attainment contexts) and why that matters to outcomes. Their paper, they write, “does not provide new causal estimates of the return to schooling; instead, it analyzes how different identification strategies shape the magnitude and interpretation of reported returns, documenting systematic patterns across credible designs and clarifying their economic meaning.”

By comparing the impact findings in the two types of regressions, they observe three widely-documented empirical findings in their meta-analysis. First, estimated returns to schooling are consistently positive under both OLS and causal identification strategies. Second, IV-based estimates of impact exceed OLS estimates in the majority (78 percent) of cases reviewed. Third, the magnitude of the IV–OLS gap shows systematic variation driven by income levels. Specifically, the gap is substantially larger in lower- and middle-income economies than in high-income contexts. This pattern is not driven by a small number of outliers but reflects a broad regularity across studies, instruments, and study locations. Patrinos and Psacharopoulos interpret these findings as reflecting high marginal returns in low-educational-attainment environments and the fact that IV analysis identifies local average treatment effects of specific policy changes.

If true, these findings would serve to refute the idea that publication bias is driving up impact estimates, as the Clark paper argues. Instead, they indicate that causal estimates are specifically identifying very high returns to education for first-generation secondary or post-primary completion, which is more prevalent in lower- and middle-income economies. And while other returns may be lower—some even near zero despite being in similar low-income contexts, as Clark argues—the average income gains for an additional year of formal education would still settle out in the typical 8 to 10 percent range due to the very high impacts in those specific contexts.

Patrinos and Psacharopoulos conclude that their findings not only refute Clark, but actually make an even stronger case for the value of education for disadvantaged and lower-income populations. “Well-designed education policies,” they conclude, “that expand access to high-quality schooling remain a central instrument for promoting individual prosperity and supporting long-run economic development.” They recommend future research to quantify the relative contributions of specific contextual factors such as national income level and local test score variations and expanded investigations in using credible causal designs in low-income country settings where data are currently scarce.

SOURCE: Harry Anthony Patrinos, and George Psacharopoulos, “Causal returns to education,” International Journal of Educational Development (March 2026).

Fordham Logo

© 2026 The Thomas B. Fordham Institute
Privacy Policy
Usage Agreement

National

P.O. Box 110
Burke, VA 22009

202.223.5452

[email protected]

Ohio

P.O. Box 82291
Columbus, OH 43202

614.223.1580

[email protected]

Sponsorship

130 West Second Street, Suite 410
Dayton, Ohio 45402

937.227.3368

[email protected]