
Twice each year, Ohio school districts must submit medium-term financial forecasts to the state, and the most recent updates released in early March paint a bleak picture.
Four out of ten districts expect their expenditures to exceed revenues at the end of this fiscal year. By 2029, 85 percent project operating in the red. Absent revenue increases or spending cuts, one in five school districts could end that year with a negative cash balance—effectively bankrupt.
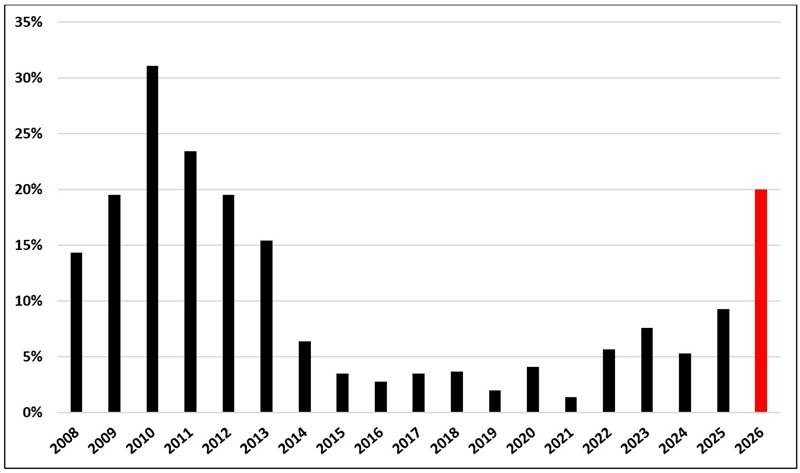
This represents a sharp deterioration from last year, and indeed the worst financial stress to confront Ohio school districts since the depths of the Great Recession (see Figure 1).
Figure 1. Percent of Ohio districts projecting negative cash balance in three years
Columbus City Schools, the largest district in the state, is among those currently on a course for insolvency. The district serves as a cautionary tale for many of the governance challenges facing public education in Ohio. It illustrates both how political pressures can push districts to make irresponsible, short-term hiring and spending decisions and the extent to which their leaders will go to pass the buck when the bill eventually comes due.
This is the story about how Columbus went broke, and what others should learn from it.
No, state “underfunding” is not to blame
At a special board meeting called to deal with the district’s projected $100 million budget crisis last November, Columbus Superintendent Angela Chapman’s presentation included a shocking graph. A slide titled “State Aid Revenue Analysis” (reproduced in Figure 2 below) appeared to show a sharp reduction in state funding, from nearly $400 million in 2021 to below $200 million in recent years.
Figure 2. Slide from Columbus superintendent board presentation on November 13, 2025
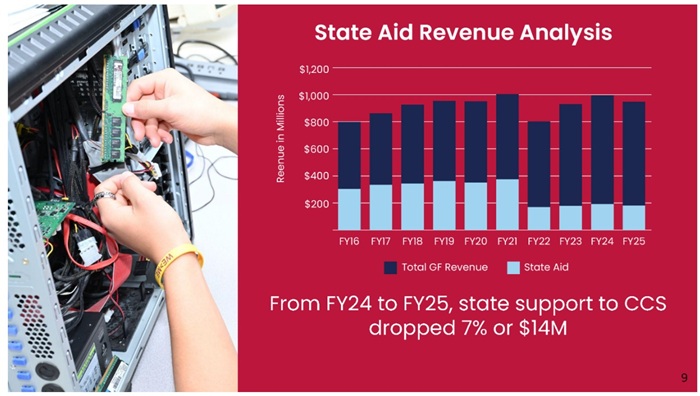
“The state used to be a big player in education,” Chapman explained to the board. “In 2022, they provided more than 30 percent of our budget in CCS [Columbus City Schools]. Today, that is closer to 15 percent. And it will be 10 percent in 2027.”[1]
“We know right now we’re in this budget situation not because we did this, but because our state house did this, because our federal government is doing this,” board member Jen Adair emphasized later in the meeting, lest anyone miss the implication.
Adair would go on to include the same figure in a social media post a few days later. Structured as a Q & A, the post asked why the district faced a massive budget deficit and went on to answer with this: “Great question! The main reason is because the State has not fully funded public education for the next two years.”
The slide and comments are misleading, to say the least. They misrepresent what was a purely accounting change—one that actually benefited Columbus financially—and create the false impression that the state has reduced its financial support for the district.
Some background: Before 2022, Ohio utilized a “pass-through” funding model that sent dollars ultimately destined for charter schools and to pay for EdChoice vouchers through students’ district of residence. In Columbus, millions of state dollars were recorded as revenue, but then immediately left the door as payments to charter schools and parents using private school vouchers.
Due to a quirk in the school funding formula at the time, which capped state payments to the district, Columbus officials blamed the “pass-through” approach for “bleeding” the district. They complained, quite reasonably, that payments Columbus was required to make to charter and private schools exceeded the amount of state funding provided for these students.
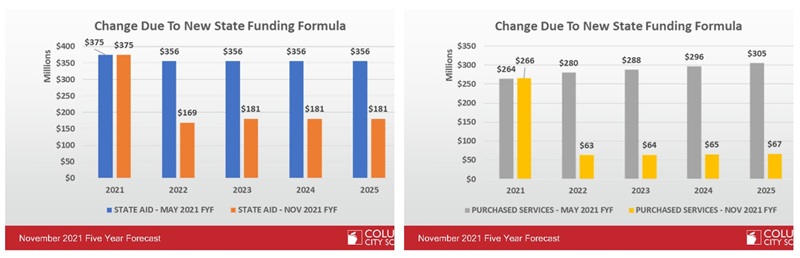
The district lobbied lawmakers to replace this flawed pass-through approach with a “direct” funding model, in which the state would write checks to charter schools and for vouchers itself, without funneling the dollars through Columbus’s bank accounts. As noted in a presentation to the Columbus school board in November 2021, this reform had the effect of reducing state revenue by nearly $200 million (left panel of Figure 3), although this represented a paper loss because it was money the district never expected to keep. The same accounting change reduced expenditures even more (right panel of Figure 3), with the district ultimately coming out at least $30 million ahead each year.[2]
Figure 3. Slides from November 2021 Columbus board presentation, showing that shift from “pass-through” to “direct” state funding of charter and voucher students caused the district to come out at least $30 million ahead per year
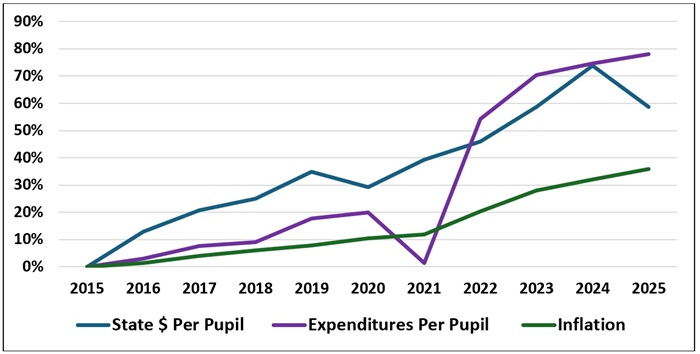
To be sure, the state legislature delayed phasing in a new funding formula adopted the same year and hasn’t regularly updated it to reflect higher costs, the complaints implied in Adair’s statement. However, as Figure 4 shows, net per-pupil state funding after accounting for the charter and scholarship deductions in Columbus has increased by nearly 60 percent over the past ten years, far outpacing inflation.[3] Since the transition to the new state formula in 2022, state dollars have continued to grow faster than inflation. In recent years, some of this increase has been offset by a state penalty Columbus has had to pay for its failure to meet its legal obligation to transport charter and non-public school students, a mess of its own making.
The bottom line is that Adair is wrong. State funding—or lack of it—is clearly not the underlying cause of the district’s fiscal stress.
Figure 4. Change in state funding and expenditures in Columbus City Schools since 2015
Declining enrollment, increased hiring
If lack of revenue is not responsible for Columbus’s budget crisis, the problem must be on the other side of ledger—excessive expenditures. Figure 4 confirms that this is the case, with spending per pupil far outpacing the rate of inflation.[4] Before the pandemic, expenditures grew somewhat slower than state funding. Spending dipped during the pandemic year, as schools remained closed, but have exploded since then.
No doubt the $450 million in federal pandemic aid that Columbus received contributed to this recent spending spree, but the district seems to have committed the cardinal sin of using one-time dollars to pay for permanent, ongoing expenses. The former Columbus treasurer, Stan Bahorek, explicitly counseled district leaders that this was a bad idea in the early days of the pandemic, reminding them of the “fiscal cliff” that came when the post–Great Recession federal aid ran out a decade ago.
In 2023, district disclosures noted that temporary federal dollars were covering the cost of 430 district staffing positions. “This represents a significant risk … and will impact the scope and magnitude of budget reductions needed to offset the cost of these positions,” the document warned ominously.
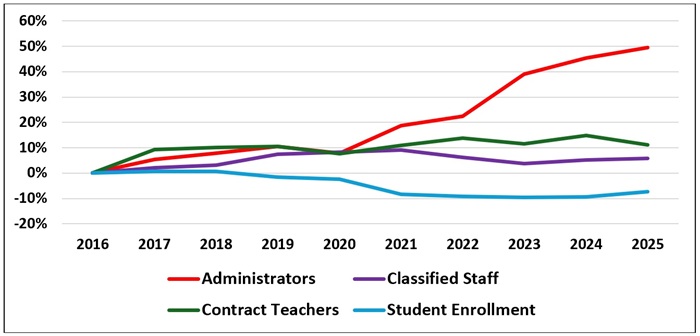
As Figure 5 shows, some of spending splurge has indeed paid for increased staffing levels, despite declining student enrollment.[5] The district has lost 7 percent of its students over the past decade. During the same period, the number of teachers increased by more than 10 percent and classified staff went up 6 percent. The number of administrators has jumped by nearly half.
The timing of these changes is important. Most of the enrollment losses came after the pandemic, in part due to the district’s prolonged closures. Like the transportation penalty, this is a self-inflicted wound.
Columbus public health officials insisted that schools could and should reopen as early as October 2020, yet the district stayed remote for months longer due to intransigence from the district’s teachers union. It would take the threat of Governor Mike DeWine not putting teachers at the front of the Covid-19 vaccine line for in-person instruction to resume, in spring 2021. But by then, the damage had already been done.
Most of the increase in teacher and classified hiring took place before the pandemic, while the sharp increase in the ranks of administrators occurred after 2021.
Figure 5. Changes in enrollment and staffing in Columbus over time
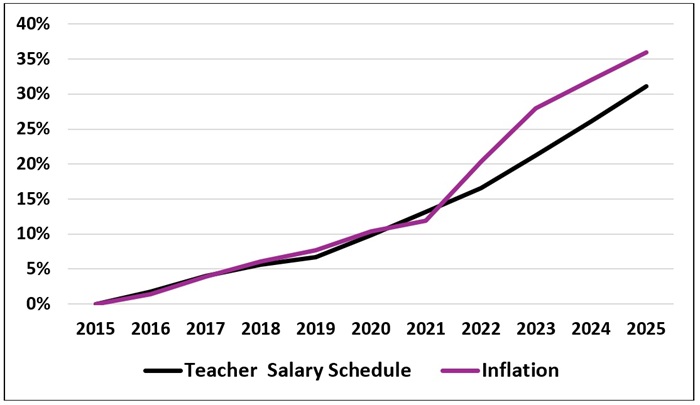
Importantly, increased hiring has not come at the expense of compensation. Until the pandemic, teacher salaries at each level of education and experience in the Columbus pay schedule rose roughly in line with inflation (see Figure 6). Salaries fell somewhat behind in subsequent years—increasing by a total of 31 percent over the course of the decade, about 5 percentage points slower than cumulative inflation over the same period. But the pay of individual teachers rose even more than the salary schedules indicate, as they gained experience and moved to higher “steps” in the salary schedule.
Figure 6. Change in Columbus teacher salary schedule
Academic outcomes have declined
District leaders have claimed that increased hiring reflects a strategic effort to move the needle on student achievement and warned that pending layoffs required to close the deficit will undo some of those gains. But on this point, the district is again distorting the evidence.
A presentation to the school board last fall (Figure 7), shortly after the release of the annual state report cards, triumphantly claimed that “Columbus City Schools’ post-pandemic gains exceed those of the state in nearly every grade level in Reading and Math!”
Figure 7. Slide from Columbus school board presentation on September 16, 2025
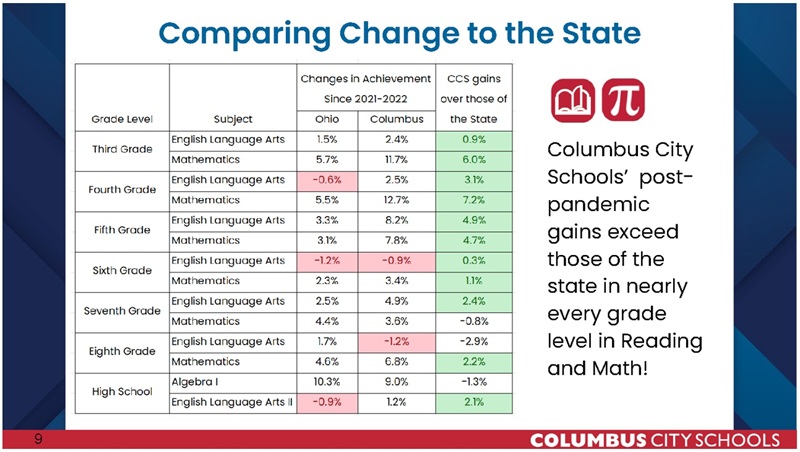
But this comparison intentionally focused only on the post-pandemic period—starting at the nadir, after Columbus suffered some of the largest academic declines in Ohio least in part due to its extended closures. And the recovery in the years since also reflects changes in student composition, with gains concentrated in the youngest grades, where performance of incoming cohorts unaffected by pandemic disruptions is compared to students who were enrolled when schools were closed.
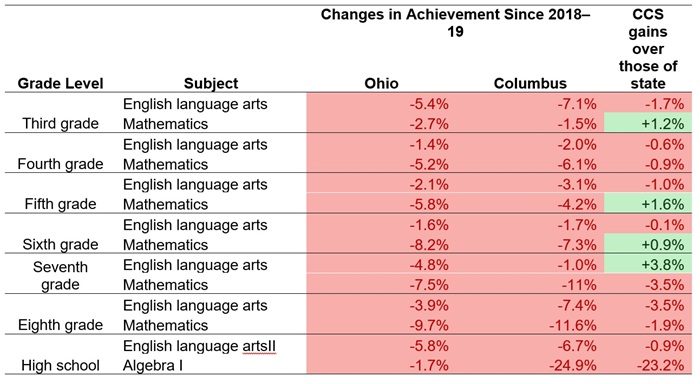
Figure 8 recreates the same analysis but instead uses 2018–19, the last year before the pandemic, as the starting point. It paints a very different picture. Not only is achievement of Columbus students still below the levels seen prior to the pandemic, including among younger grades who started school afterward, but the district has fallen further behind the rest of the state in most grades and subjects.[6]
The sharp increase in spending and increase in staffing has not produced an academic miracle. Instead, student outcomes have moved in the wrong direction.
Figure 8. Comparison of proficiency rate changes in Columbus vs. Ohio Statewide since 2018–19
Misplaced focus, priorities
Given robust evidence that more money typically does produce better academic outcomes, one should wonder why the massive increase in spending in Columbus in recent years has not moved the academic needle more.
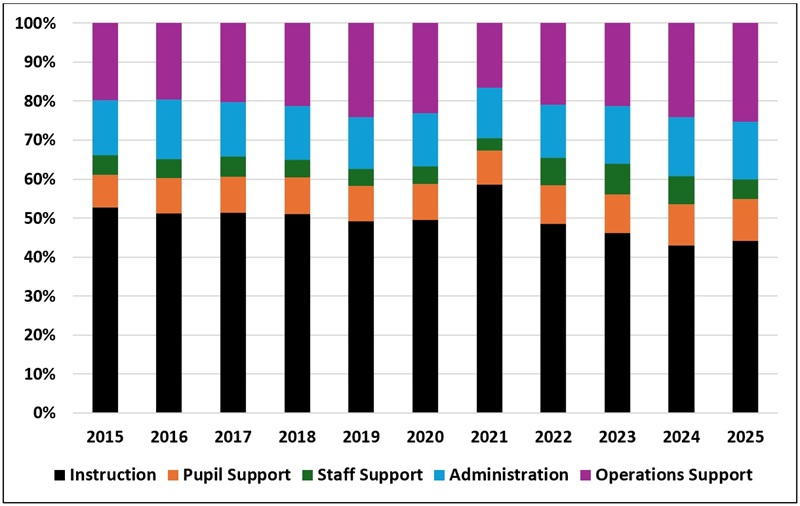
Part of the story is that a smaller slice of that growing pie is reaching the classroom. A decade ago, more than 60 percent of Columbus expenditures went toward student-facing services, paying for instruction and pupil support (see Figure 9). This peaked at nearly 70 percent during the pandemic, as shuttered buildings produced savings on operations and transportation. By last year, however, only 55 cents of every dollar spent by the district was going into the classroom.
The share of total expenditure on operations—including building maintenance, student transportation, and food services—has risen from 20 percent in 2015 to 25 percent a decade later. Since overall spending has grown sharply during this period, the absolute dollar amount spent per student on operations has increased by an astronomical 230 percent over this period. The refusal of the school board (until recently) to close underutilized buildings, even as enrollment declined, has contributed to these growing costs.
Increasingly, Columbus seems to operate primarily as an adult employment agency, where academic instruction and student learning are merely incidental and of secondary importance.
Figure 9. Share of Columbus expenditures by service category
Dark path ahead
The Columbus story—irresponsible spending of one-time pandemic aid, failure to match staffing to enrollment trends, diverting money from core academic functions, and blaming the state without taking responsibility for imprudent decisions—likely applies to many other Ohio districts facing budget challenges today.
Unfortunately, the news will probably get worse. The two simplest solutions from the point of view of district leaders—more state aid and local property tax increases—are unlikely to materialize in the current environment.
Medicaid costs already account for half of the state budget, and recent changes in federal law that push more of these and other social program costs to the states will create significant pressure on the Ohio budget. If the economy tips in to recession, state revenues will decline sharply, and policymakers facing massive deficits will be in no position to increase K–12 spending.
Similarly, the backlash to rising property values have fueled an effort to abolish property taxes, and recent state reforms designed to alleviate these demands have removed many of the tricks districts previously used to passively increase revenues without voter approval. In many communities, convincing voters to increase their taxes will be an uphill battle.
Districts around the states will have to make hard decisions, including prioritizing academics. This means implementing layoffs wisely—based on teacher quality, not seniority—and finding efficiencies that both reduce costs and help students, such as shuttering failing and underenrolled schools.
Columbus offers a critical test case for whether local officials will actually make the necessary but politically unpopular decisions. The district’s recent track record, unfortunately, is not encouraging.
Vladimir Kogan is a senior research fellow at the Thomas B. Fordham Institute and a professor of political science at the Ohio State University. He is the author of the 2025 book No Adult Left Behind: How Politics Hijacks Education Policy and Hurts Kids (Cambridge University Press).
[1] In addition to being highly misleading, for the reasons I describe in this article, it’s unclear where the numbers in Chapman’s comments are coming from. She may have misspoken, referencing 2022 instead of 2021 as the high point in state funding. But the other figures don’t match those in the district’s five-year financial forecast.
[2] In their enthusiasm in lobbying in favor of the direct-funding reform, Columbus leaders apparently failed to anticipate an unintended consequence that reduced some of the financial upside. Previously, charter and voucher-receiving private school students counted as part of total Columbus enrollment, making the district look poorer. When these students were removed from the denominator after the shift to direct-funding, Columbus became much wealthier on paper—with assessed property values per pupil rising from just below $173,000 in 2021 to $290,000 in 2022—thereby reducing the district’s eligibility for state funding, which is allocated on a need basis.
[3] My calculations use the state foundation formula settlement reports and subtracts transfers made for charter schools, open-enrollment students, and voucher students and payments to education services centers. I also don’t include state funding related to preschool special education. This provides the cleanest “apples-to-apples” over-time analysis, but does not account for other state sources of revenue that are not allocated through the statutory funding formula, including casino revenues and money to compensate for certain property tax exemptions.
[4] Some might reasonably object to using official consumer price measures to adjust costs over time, since school districts don’t purchase the same “basket” of goods used for this calculation and instead spend over 80 percent of the dollars on salaries and benefits. As it turns out, the Employment Cost Index for professional employees during this period grew slower than overall inflation, so using that alternative deflator would actually make the Columbus spending increase look even more striking.
[5] Figure 5 uses data from personnel reports provided to the school board at every meeting and reflects filled, not budgeted, positions. I use counts from the first regular board meeting of each school year. If I instead take staffing data from January of each year, the changes in staffing over time remain similar, although the increase in teacher numbers is somewhat smaller. Note that the staffing data begin starting in the 2015–16 school year because the format of the report changed that year and is not directly comparable to earlier periods.
[6] Comparing changes in proficiency rates in Columbus to trends only in the other large, urban districts rather than the entire state paints a mixed picture, at best. Columbus has fallen behind the other Ohio urban systems in half of the tested grades and subjects during the same period.