Technically, “for-profit charter schools” are non-profit organizations that contract out some or all of their operations or services to a for-profit organization—meaning the schools themselves are not for-profit. It’s also very common for all public schools—both traditional and charter—to use for-profit vendors for a variety of services, from transportation and building maintenance to food service and student tutoring.
This study, conducted by Stéphane Lavertu and Long Tran, uses administrative data from Ohio to explore whether a charter school’s use of for-profit organizations impacts school quality. Specifically, it asks:
To read the full report and its implications for educational leaders and policymakers, scroll down or download the PDF (which also includes the appendices).
Foreword
By Amber M. Northern and Michael J. Petrilli
After a tumultuous and mostly hostile reception, the Biden administration’s regulations for the federal Charter Schools Program (CSP)—which provides start-up and expansion grants—were finalized in July. Although the Administration backpedaled partway on issues related to community demand and racial integration, its final rules maintained its war against for-profit charters, in line with the president’s campaign promises.
We understand perfectly well that the phrase “for-profit charter schools” can conjure up images of stout old men in suits greedily raking in cash on the backs of poor families and students. We also recognize that a few charter operators are closer to that depiction than choice supporters might care to admit. Yet that image is based on a misnomer married to a misconception.
That’s because all U.S. charter schools (save for a handful in Arizona) are not only governed and regulated by public agencies, but also must operate as nonprofit organizations run by their own boards. Those boards may—and many do—choose to enter into contracts with for-profit or non-profit management organizations that provide specific services for one or more schools. They do this in the interests of quality, efficiency, and economy, much as traditional public schools obtain various administrative and academic supports from their central offices, even as many districts obtain services ranging from busing to textbooks to clinical psychology to cafeteria food from for-profit vendors. Strictly speaking, then, almost nowhere in America is there such a thing as a “for-profit charter school.” What there are are some non-profit schools that contract with for-profit management organizations for a range of goods and services.
If that explanation strikes you as technocratic, you’re not alone. Most people fail to make a distinction between whether a school is providing a service directly via its own regular staff or is obtaining it via another entity. One result of that failure to read the fine print is that charter critics and enemies run into few challenges when they erroneously refer to “for-profit schools.”
Such animosity certainly oozes through the dense requirements that CSP applicants must henceforth meet if they choose to work with for-profit management organizations. For starters, they must ensure that goods and services purchased from such an organization are of fair market value, that the school’s governing board is making key programmatic decisions, that members of said board are not selected by the management organization, that the management contract is severable, and on and on.
We’re all for reasonable safeguards to guard against rotten apples in the charter barrel. But note the crucial missing link: The federal regs appear oblivious to whether the functions performed by a for-profit organization have anything to do with school quality. Heavy on inputs, the final regs ignore how for-profit management companies might serve to benefit (or harm) charter students academically. They also fail to make some vital distinctions within the variegated world of schools that work with outside providers.
This study sheds much light on these key points. Using recent data from Ohio, Professor Stéphane Lavertu and Assistant Professor Long Tran of The Ohio State University dig into what is meant by “for-profit” charter schools, how they spend resources differently from other charters, and how they compare in effectiveness to other charters (and to traditional public schools) in academic and nonacademic outcomes.
The full report is well worth your time, but for the time-challenged, here’s the gist of what they found.
First, as explained above, Ohio has no “for-profit charters.” But the 208 charter schools included in the study can be split into three categories: those that mostly manage their own operations (47 schools, or 23 percent), those that outsource goods/services to non-profit organizations (55 or 26 percent), and those that outsource goods/services to for-profit organizations (106 or 51 percent). The lattermost typically send more of their operating funds to their (for-profit) management organizations than do charter schools with non-profit management organizations.
Further, the roughly half of charter schools that outsource to a for-profit management organization (n=106) can be further subdivided into those that contract for personnel services and those that choose to hire their own staff. Three-fourths (n=78) of the charter schools that work with external for-profit organizations contract for staff. And because staffing is the largest item in any school budget, those schools send the bulk of their operating funds to those organizations. The remaining one-fourth (n=28) hire their own staff and, consequently, send smaller checks to for-profit management organizations. This staffing distinction is important, as teachers and other staff are the heart of any school—and a charter school board that directly employs its own retains more control over the content and quality of its curricula, its pedagogy, and its personnel than one that outsources staffing.
Drs. Lavertu and Tran also find that charters that contract with for-profit entities for staffing spend more in the classroom and less on administration than their counterparts that work with non-profit organizations. That’s good. But they also drive heightened rates of chronic absenteeism among the charter sector. Not so good.
Finally, the study examines school effectiveness and largely replicates what Dr. Lavertu found in an earlier analysis of Ohio charter schools: So-called for-profit and non-profit charter schools both outperform traditional public schools, but non-profits also outperform for-profit charters, particularly in mathematics.
We draw four implications from these results.
First, readers who are automatically inclined to hate so-called for-profit charter schools should rethink their priors.
Second, as with all schools, we shouldn’t view for-profit charter schools as a monolith.
There are 106 charters in Ohio (about half of the study sample) that contract with for-profit management organizations. Seventy-eight of them turn over nearly everything, including personnel, to those organizations, while the remaining twenty-eight directly employ all or nearly all of their personnel, choosing instead to contract for specific (and less expensive) services. Since personnel is the biggest budget item in a school, charters that externally contract for it purchase services that, on average, comprise 91 percent of their total expenditures. Those charters that directly employ their own staff purchase services from their for-profit management companies that comprise on average 39 percent of their total expenditures.
That's a big difference.
It’s not a huge leap to assume that a school’s relative level of control is correlated to the portion of its budget that it outsources. Schools that outsource over 90 percent of their budgets have essentially surrendered control of key decisions, not only the hiring of their most important asset (teachers!), but largely what they teach and how, as well as decisions about learning loss, parental engagement, school discipline, the master schedule, and so on. Schools that purchase less than 40 percent of services effectively retain “majority control” over the running of the school. They continue to shape some of the fundamental educational goals and practices of the school, as well as its likelihood of succeeding academically.
Third, for-profit charter schools in Ohio that outsource nearly all services perform worse than those that outsource fewer.
It’s true that students in Ohio for-profit charter schools are more likely to be chronically absent than students in non-profit charter schools or traditional public schools. However, this result is driven entirely by the for-profit charter schools that send nearly all of their operating funds to their for-profit management organizations, also known by detractors as “sweeps contracts.” Compared to charter schools that contract with non-profit management organizations, these contract-centric charter schools also have more students per teacher and more teacher turnover, which could manifest into weaker student-teacher relationships that depress attendance.
Fourth and finally, because of this variation, we should avoid regulating charter schools based on the tax status of their management organizations.
*************
Applicants to the federal Charter Schools Program were barely given a month to complete their applications after the final regulations were issued. It’s hard to grasp how any school leaders could finish such a daunting task in so little time. But, like it or not, charter schools are used to having to prove themselves. Grants are to be announced within days. We’ll be looking to see which state entities, developers, and charter management organizations make the cut—and whether any high-quality for-profit schools are in the mix. Stay tuned!
Introduction
Biden administration officials at the U.S. Department of Education proposed in March 2022 to make it more difficult for charter schools to open or expand, as well as to deny federal funding to so-called “for-profit charter schools.”[1] In July, the administration’s final rules and regulations relative to the Charter Schools Program (CSP) grants largely followed through on these intentions, making it hard for for-profit charter schools to access federal start-up funds. House Democrats are also working to incorporate the rules into appropriations bill language, meaning that both the executive branch and Congress are targeting these schools. And multiple states have already banned (e.g., California) or considered banning (e.g., Ohio) for-profit entities from the charter sector.
But what do we mean exactly by a “for-profit” school? After all, every U.S. charter school (save for a few in Arizona[2]) is a nonprofit entity, in that the school—which holds the charter approved by the authorizer—must be a nonprofit organization recognized by the Internal Revenue Service. That means that the school must put any profit (i.e., net income) it generates back into the organization to further its public mission, as opposed to enriching owners as in for-profit businesses. Moreover, the authorizing organizations that sponsor and oversee schools—the organizations that grant schools those charters—must be public agencies or nonprofit entities. So, by law, definition, and practice, charter schools are not “for-profits.”
Typically, when critics use the term “for-profit charter school,” they mean that a nonprofit charter school has contracted out its operations or services to a for-profit organization—not that the school itself is for-profit. What complicates matters is that it is common for all public schools—both traditional and charter—to contract with for-profit vendors for a variety of services, from transportation and building maintenance to food service and student tutoring. Vendors also supply basics such as desks, textbooks, and paper.
Should the definition of a for-profit charter school include any school that contracts for goods or services from a for-profit entity? Should distinctions be made between the types of services—managerial, instructional, or other operations—or based on the extent of goods and services provided? For instance, if the latest rules are read as cutting off federal start-up dollars to “for-profit” schools, will they inadvertently eliminate funding to some nonprofit, community-based schools, too, just because they outsource “too many” services to for-profit organizations?
The latest regulations seek to make some of these distinctions. For instance, they
“. . . require applicants to provide assurances that they will not relinquish full or substantial administrative control of their CSP grants or subgrants to a for-profit management organization and that any management contract with a for-profit management organization will contain specific provisions to mitigate the risks associated with such contracts.”
What comprises “full or substantial administrative control” may be open to interpretation, but other new requirements are not. For example, applicants are required “to conduct a needs analysis and to submit detailed information on their management contracts with for-profit entities, including nonprofit charter management organizations (CMOs) operated by or on behalf of for-profit entities.” They must also “provide assurance that they will post on their websites information regarding any management contract between the charter school and a for-profit management organization.”
What these new regulations ignore is how the particular functions that a for-profit organization performs correspond to school quality. Would restrictions on purchasing services from for-profit vendors limit or enhance high-quality public school options? Those opposed to charter schools contracting with for-profit organizations claim that, because state per-pupil funding formulas put a ceiling on revenues per pupil, a profit motive could lead for-profit charter school operators to minimize spending and, consequently, lower educational quality.
On the other hand, charter schools—which in many major cities receive, on average, 33 percent less funding per student than traditional schools—can increase per-pupil revenue by enrolling more students and realizing economies of scale, which still requires meeting the expectations of parents, authorizers, and state officials to remain open.
To date, we know very little about whether a charter school’s use of for-profit organizations affects its quality. To better understand these differences among charter schools and how these differences affect students, this report uses administrative data from Ohio to answer the following research questions:
1. What makes a charter school “for-profit” vs. “nonprofit”?
2. How do for-profit and nonprofit charter schools spend resources differently?
3. How does the effectiveness of “for-profit” charters compare to the effectiveness of traditional public schools and “nonprofit” charters in terms of standardized test scores, end-of-course exam scores, and attendance and disciplinary outcomes?
We are not able to determine how much “profit” is made by a for-profit organization hired to render services for a charter school. We have access to school-level expenditure data that schools and districts report annually, as well as charter schools’ financial forecasts. But we do not have access to the budgets or earnings reports of the for-profit organizations that are contracted to help schools. Still, the present study is by far the most systematic analysis of for-profit vs. nonprofit-operated schools that has been conducted to date.
Ohio context
Ohio is an ideal state to explore these questions. Not only is it one of only a handful of states with a sufficiently large number of charter schools that use for-profit organizations,[3] but it is also the only state in the country that makes charter school contracts with vendors publicly available, including fine-grained financial data[4] (though, as indicated above, the CSP regulations may change that). It is also atypical in the wide variety of charter school authorizers it permits, including local school districts, other public agencies, and nonprofit entities (including the Thomas B. Fordham Foundation).
Ohio is typical, however, in that its brick-and-mortar charter schools on average provide considerable educational benefits to disadvantaged student populations. It seems reasonable to assume that the results documenting the advantages and disadvantages of for-profit charter schools (relative to both nonprofit charters and traditional public schools) could apply in other contexts.
Figure 1 provides an overview of Ohio charter school governance and operations. As indicated, all Ohio charter schools are deemed both public schools—governed and regulated by public agencies—and nonprofit organizations run by their own boards. Charter schools’ governing boards may also choose to enter into a contract with for-profit or nonprofit management organizations (“operators”) that provide specific services for one or more schools (a.k.a. a charter school “network”)—much like the administrative supports and academic leadership provided to traditional schools via district central offices (see the last boxes in Figure 1). Technically, then, there is no such thing as a “for-profit charter school” in Ohio or in virtually any other state[5]—just for-profit management organizations.
Still, for the sake of consistent nomenclature, we adopt the same (albeit confusing) shorthand. We identify charter schools as “for-profit” if they contract with a management organization that the State of Ohio has identified as a for-profit corporation. “Nonprofit” charter schools, on the other hand, are those that contract with nonprofit organizations for management services or those independent community-based schools that manage their own operations.
Figure 1. State government and nonprofit organizations can oversee charter schools in Ohio, but for-profit organizations may help in running day-to-day school operations.
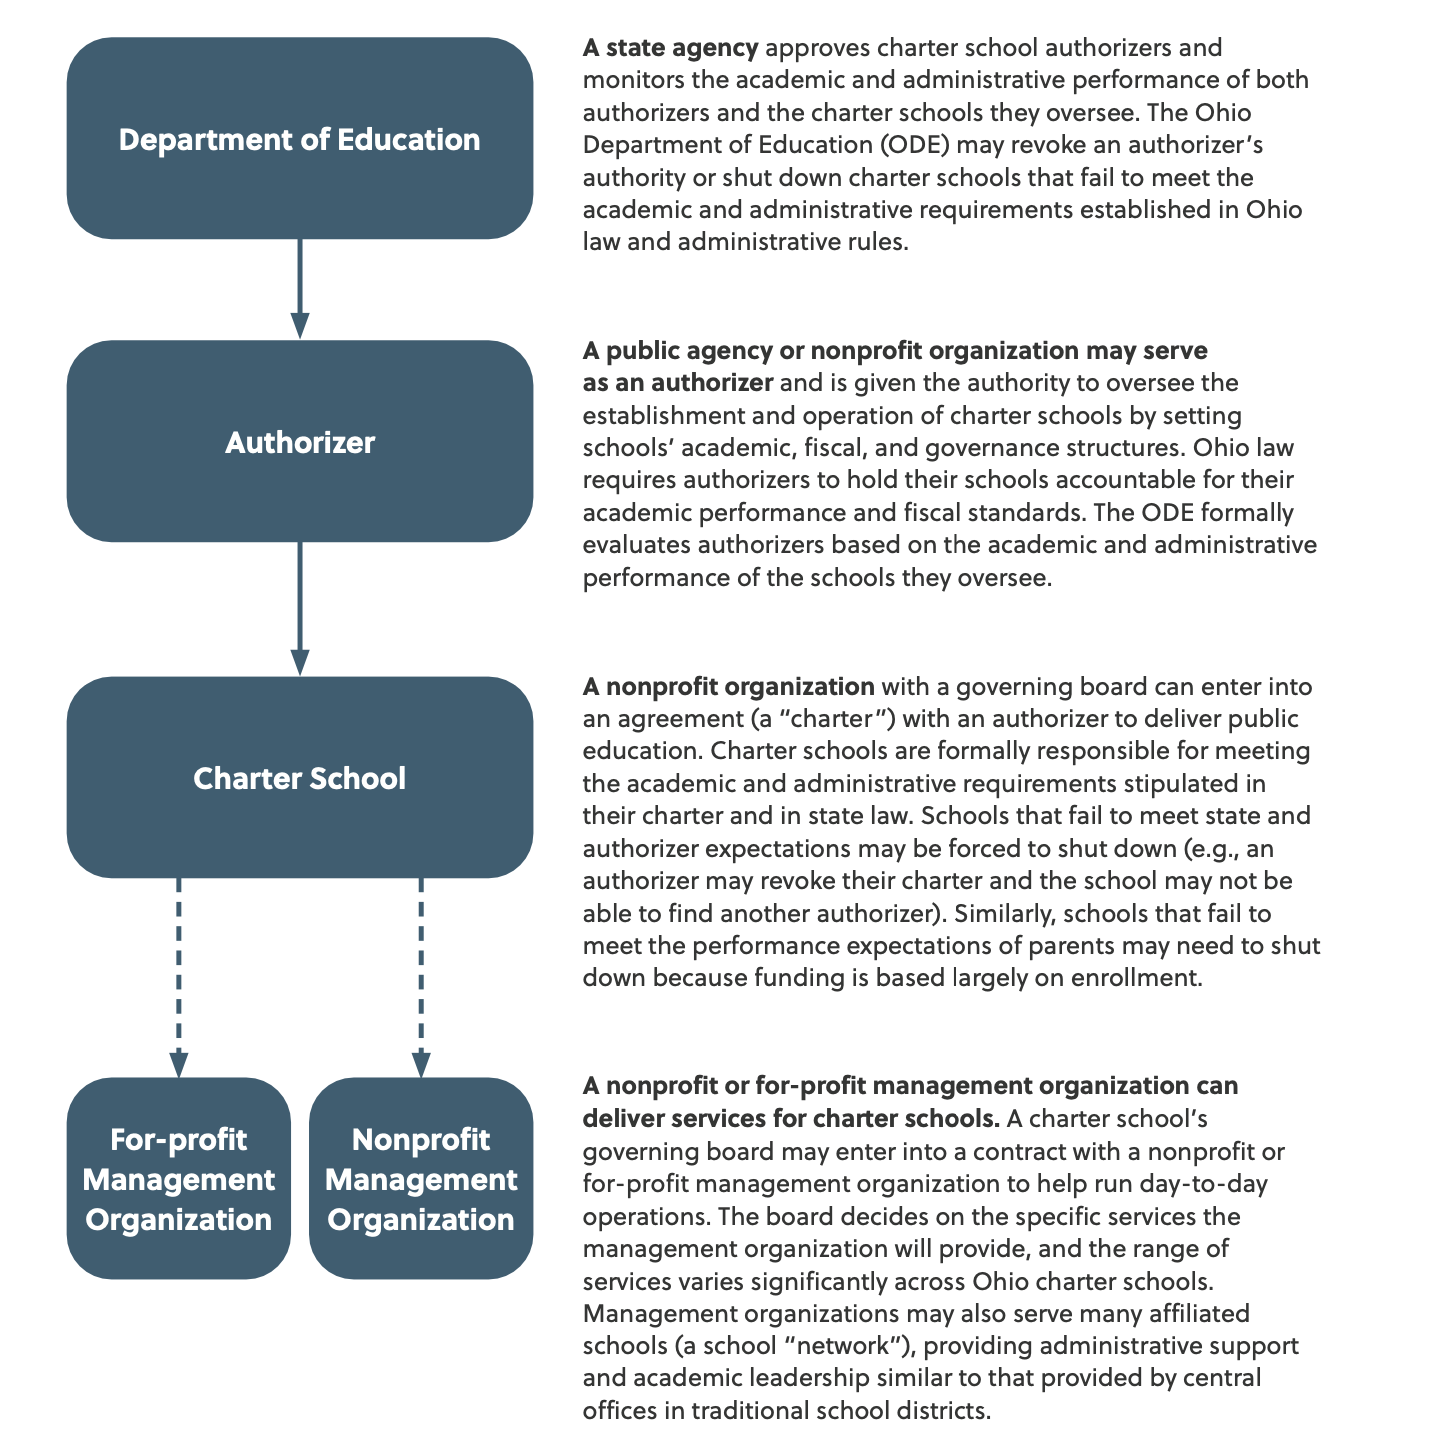
Note. For more information on this organizational hierarchy, consult the Thomas B. Fordham Institute’s guide “Ohio Community School Governance: An Overview” (updated February 26, 2019), available at https://fordhaminstitute.org/ohio/research/policy-brief-ohio-community-school-governance
Note. For more information on this organizational hierarchy, consult the Thomas B. Fordham Institute’s guide “Ohio Community School Governance: An Overview” (updated February 26, 2019), available at https://fordhaminstitute.org/ohio/research/policy-brief-ohio-community-school-governance Background
Data and Methods
The analysis compares the administrative practices (e.g., staffing and budgeting) and educational effectiveness (e.g., gains in achievement and attendance rates) of various types of charter schools in operation during the 2018–19 school year (hereafter 2019)[11]—the last prepandemic year for which student-level outcome data are available. We analyze schools serving elementary and secondary grades separately because their administration often differs in key ways.[12] We focus on differences in average outcomes between sectors: nonprofit charter, for-profit charter, and traditional public schools.[13]
Table 1. Ohio charter school counts by type (2019)
|
|
Full Sample
|
Non-profit– Community-based
|
Non-profit– Mgmt. org.
|
For-profit–Mgmt. org.
|
|
Brick-and-mortar charter schools
|
|
|
|
|
|
General education
|
210
|
47
|
55
|
108
|
|
Special education
|
30
|
6
|
22
|
2
|
|
Dropout prevention and recovery
|
60
|
20
|
7
|
33
|
|
Virtual charter schools
|
|
|
|
|
|
General education
|
5
|
1
|
0
|
4
|
|
Dropout prevention and recovery
|
9
|
4
|
5
|
0
|
|
Total charter school count
|
314
|
48
|
89
|
147
|
Note. The table presents counts of charter schools by type. It includes only those schools that operated for the entire 2018–19 school year and for which we have financial forecast data. All for-profit dropout prevention and recovery schools are stand-alone high schools (grades 9–12). Two schools without a management organization (according to ODE records) are categorized as “nonprofit management organization” because nearly all expenses were allocated to purchased services from an outside nonprofit organization.
We use Ohio’s publicly available school-level financial data and teacher-level staff data. We obtained every charter school’s financial forecast from May 2019,[14] as well as school-level expenditure data that schools and districts report annually.[15] The forecast data allow us to characterize the extent to which charters utilize the organizations from which they purchase services (both for-profit and nonprofit), whereas the school-level expenditure data enable comparisons of inputs in charter schools and traditional public schools using a consistent coding scheme. We use a number of other publicly available datasets to obtain information on school personnel and other characteristics.[16]
We also obtained from the Ohio Department of Education student-level data that provide school of attendance for each grade and year, demographic and academic characteristics (race, economic disadvantage, gender, disability status, and English-learner status), scale scores on mathematics and English language arts (ELA) exams in grades 3–8, scale scores on high school exams (Algebra, Geometry, ELA I, ELA II, and ACT/SAT), counts of reported disciplinary incidents for which the schools expelled or suspended a student, the number of instructional hours for which a student was present, and whether a student received a high school diploma. We normalize state test data for grades 3–8 such that student scores capture their distance in standard deviation units from the statewide mean in a given subject, grade, and year. We normalize high school tests by subject and year only, as students may take these tests in different grades.[17]
Statistical approach
We compare the administrative inputs and educational impacts of schools operating in the same geographic school district. Comparing nearby schools helps to take into account regional differences relative to how much it costs to educate children and variation in students’ demographic characteristics.[18] As described in Appendix A, we use models that account for such fixed differences between districts.
Comparing students who attend school in the same geographic district goes a long way toward making sure that we are comparing the educational outcomes of students who are identical except for the type of school they attend. Still, to address the issue that students who select into one school type may nonetheless differ from those who select into another school type, we follow the well-established practice of comparing student-level changes in educational outcomes between students who are nearly identical in observable characteristics but who attended different types of schools. As explained in Appendix A, we include statistical controls for students’ baseline test scores, attendance rates, rates of disciplinary reports, and various other observable characteristics (e.g., economic disadvantage).[19]
Finally, to provide the most credible assessment possible of Ohio charter schools, we focus primarily on brick-and-mortar (“site-based”) charter schools serving “general” student populations according to the Ohio Department of Education.[20]
Differences in how for-profit and nonprofit charter schools allocate resources
- Summary of Results
-
This section examines how charter schools contract for services and spend revenues. We find that for-profit charter schools send more of their operating funds to their management organizations than do their nonprofit counterparts. Moreover, contractual data show that there are actually two types of for-profit charter schools, distinguished by whether they contract for personnel services or, instead, hire their own staff. For-profit charter schools also spend more in the classroom and less on administration than their nonprofit counterparts.
Finding 1: For-profit charter schools typically send more of their operating funds to their management organizations than do nonprofit charter schools with management organizations.
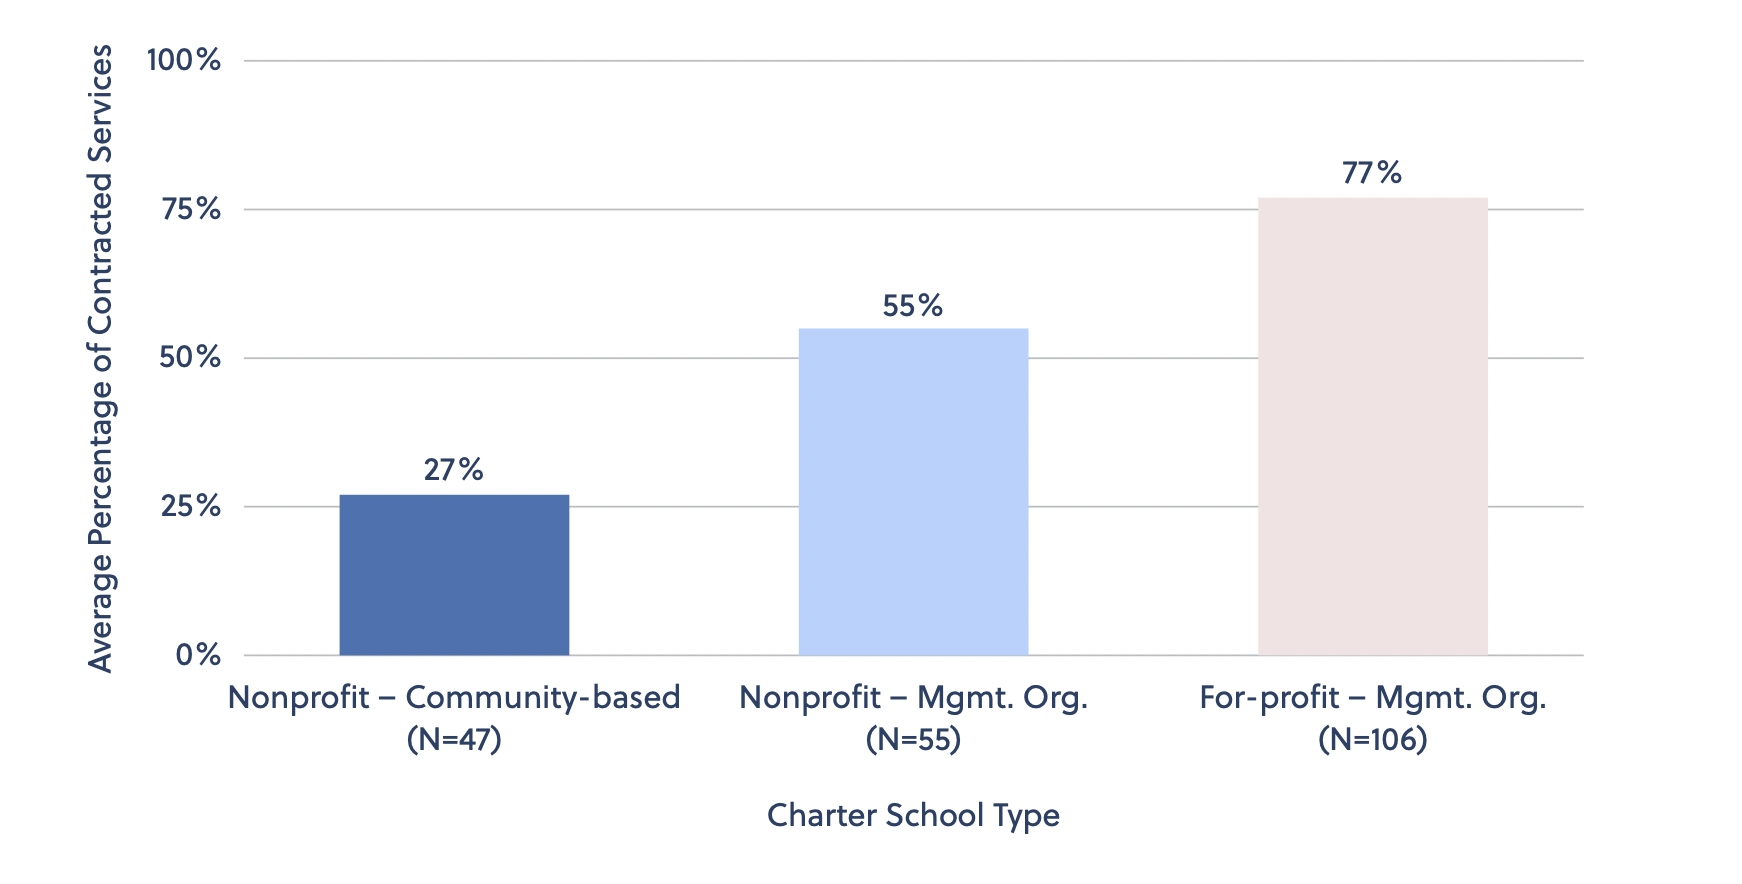
Figure 2 shows the percentage of services purchased via contract by charter school type. The average for-profit charter school spends 77 percent of its operating funds on purchased services, whereas the average charter school with a nonprofit organization managing its operations spends 55 percent of its funds on purchased services. The average community-based nonprofit charter school—which, by our definition, manages its own operations—spends 27 percent of its operating funds on purchased services, with none of these schools spending more than 50 percent.
Figure 2. For-profit charter schools spend more of their operating funds on purchased services than other charter schools.
Note. Statistics are limited to brick-and-mortar charter schools serving general student populations.
Note. Statistics are limited to brick-and-mortar charter schools serving general student populations.
Finding 2: Contractual data reveal two types of for-profit charter schools—those that contract for personnel services and those that hire their own staff.
A school’s key expense is instructional personnel (i.e., teacher salaries), and the data show a notable distinction in how for-profit charter schools handle these costs.[21] Figure 3 shows that two-thirds of for-profit charter schools purchase personnel services from their for-profit management organization (those schools are represented by the striped rose bars in panel C). Consequently, these schools send nearly all of their operating funds to their management organizations. The remaining one-third of for-profit charter schools hire their own staff and, consequently, send much less to their for-profit management organization.[22] This stands in contrast to nonprofit charter schools. Sixty-six for-profit charters send more than 80 percent of services from contractors, but only sixteen nonprofit schools (per striped blue bars in panel B) do likewise.
The striking distinction between schools that hire their own staff and those that contract for staff likely has some real-world consequences. Once a school relinquishes control of their most important asset—teachers—they are effectively handing over to their nonprofit or for-profit management organization the power to shape some of the fundamental educational goals and practices of their school, as well as the likelihood of succeeding academically. Schools in which teacher contracts are held by the management organization are also operating as part of a network, suggesting more standardization of teacher practices. On the other hand, a charter school that continues to hire its own staff retains more control over its educational programming even if it has outsourced multiple other services to a management organization.
Figure 3. Since personnel expenses are the bulk of a school’s budget, charters that contract for personnel have the highest levels of purchased services.
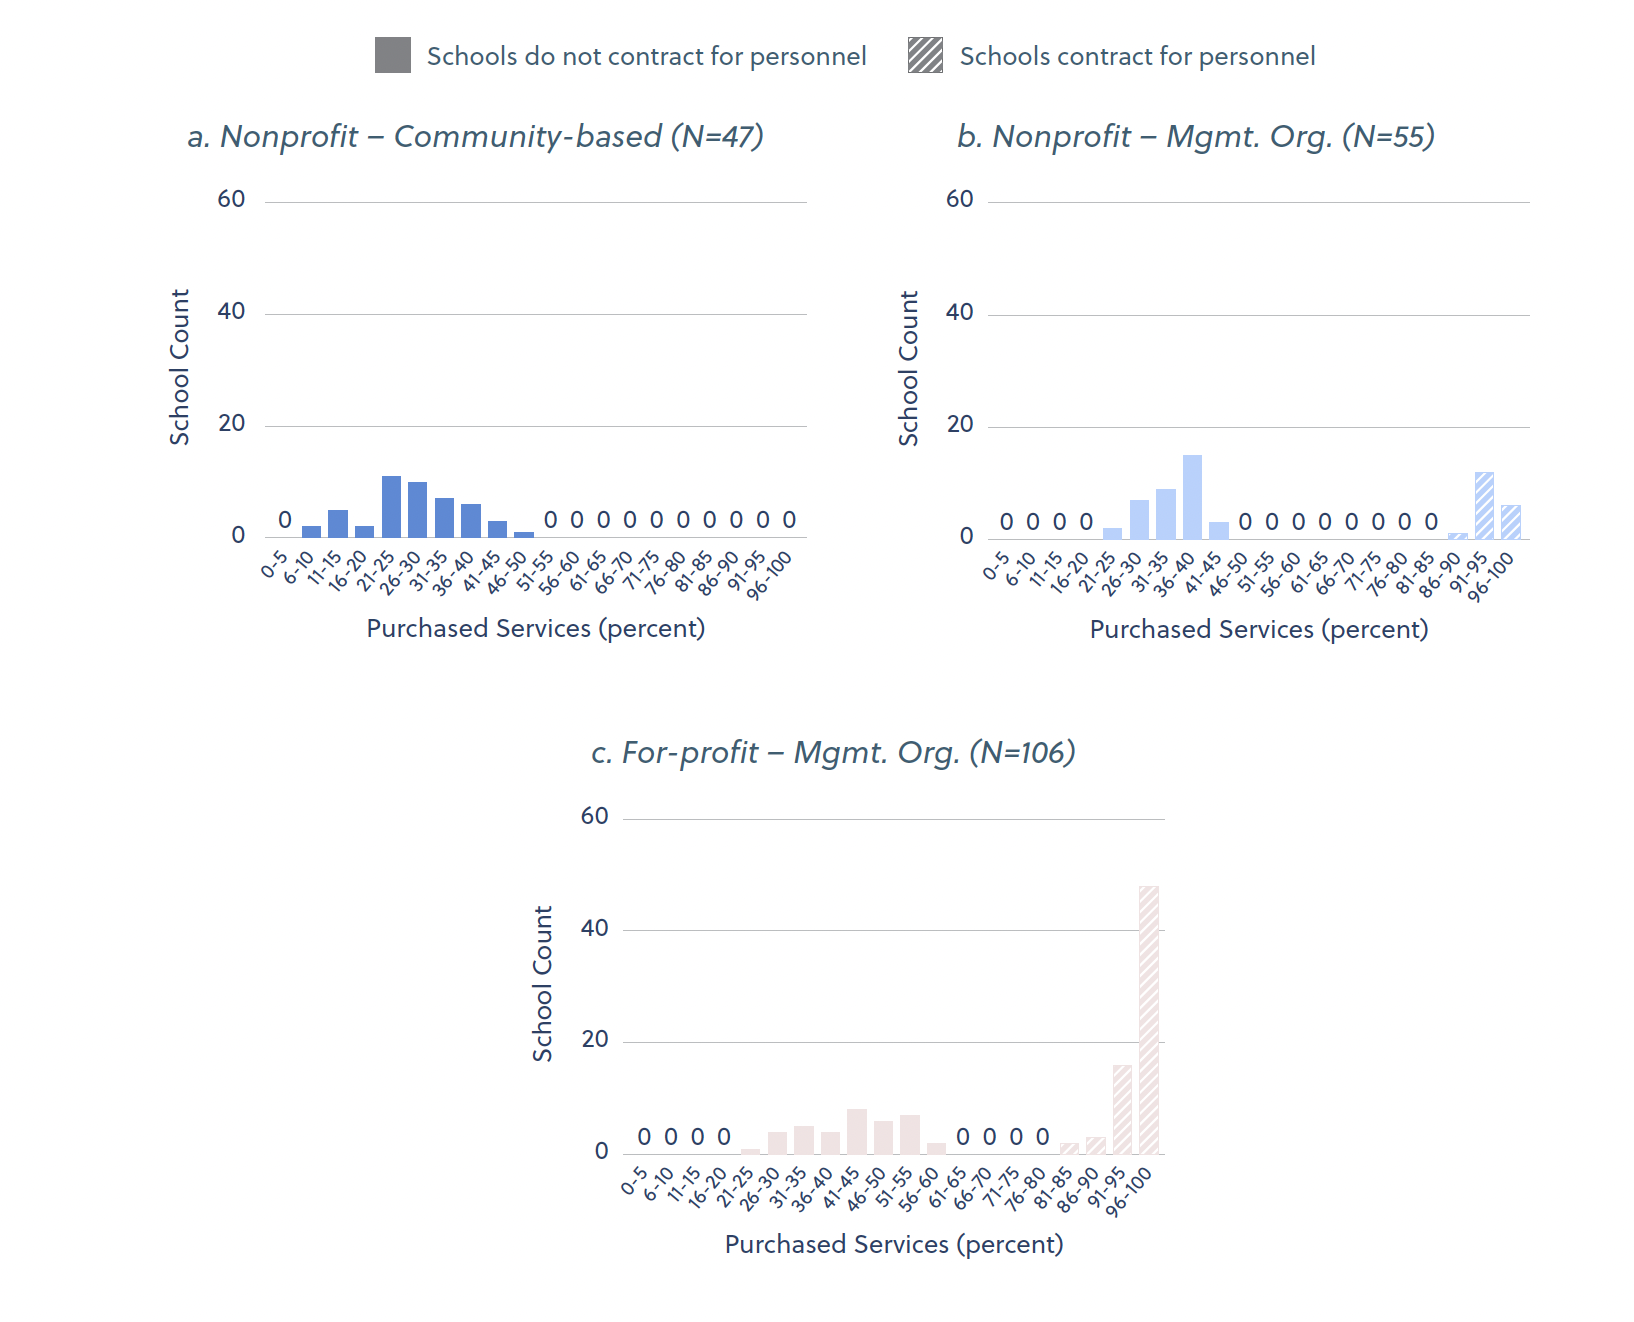
Note. The figure presents the extent to which brick-and-mortar charters schools serving general student populations purchase services, using the Ohio Department of Education’s identification of them as not working with a management organization (Nonprofit – community based), working with a nonprofit management organization (Nonprofit – Mgmt. Org.), or working with a for-profit management organization (For-profit – Mgmt. Org.).
Note. The figure presents the extent to which brick-and-mortar charters schools serving general student populations purchase services, using the Ohio Department of Education’s identification of them as not working with a management organization (Nonprofit – community based), working with a nonprofit management organization (Nonprofit – Mgmt. Org.), or working with a for-profit management organization (For-profit – Mgmt. Org.). Table 2 describes the extent to which for-profit organizations are involved in educational delivery for different types of charter schools. Recall that a school may be for-profit or not based on the for-profit status of its management organization. For-profit schools are separated into those that have their own instructional staff (“for-profit – own staff”) and those that contract with their management organization for personnel services (“for-profit – contract staff”). As shown, the latter send nearly all of their budget (91 percent on average) to their management organizations, whereas the former send only 39 percent on average. Thus, the extent of involvement of for-profit firms (low, moderate, or high) is based on whether they do not contract with a for-profit management organization (low), contract with a for-profit management organization but hire their own teachers (moderate), or contract with a for-profit company for virtually everything (high).
Table 2. Charter schools vary significantly in terms of how involved their for-profit management organizations are in the delivery of educational and other services
|
School Types
|
Definition
|
School Count
|
Purchased services as percent of expenditures
(Avg/Median)
|
Extent to which for-profit firm involved
|
|
Nonprofit – Community-Based
|
Charter schools that manage their own operations.
|
47
|
27% / 27%
|
Low
|
|
Nonprofit – Mgmt. Org.
|
Charter schools that contract with a nonprofit organization to manage operations. These may be organizations that serve a single school or CMOs that serve a network of schools.
|
55
|
55 % / 38%
|
Low
|
|
For-profit –Mgmt. Org.
|
Charter schools that contract with a for-profit organization to manage operations. These may be organizations that serve a single school or EMOs that serve a network of schools.
|
106
|
77% / 94%
|
Moderate/High
|
|
For-profit – Own Staff
|
For-profit charter schools that directly employ all (or nearly all) of their personnel.
|
28
|
39% / 40%
|
Moderate
|
| |
|
For-profit – Contract Staff
|
For-profit charter schools that contract for all (or nearly all) of their personnel.
|
78
|
91% / 96%
|
High
|
Note. Statistics are limited to brick-and-mortar charter schools serving general student populations. School counts do not exactly match those from Table 1 due to missing data on purchased services for two for-profit schools.
Finding 3: For-profit charter schools that contract with management organizations for staffing spend more in the classroom and less on administration than their nonprofit counterparts.
Table 3 shows that for-profit charter schools overall spend the same amount per pupil as nonprofit schools.[23] However, for-profit charter schools spend $581 more per pupil on classroom personnel and activities and, correspondingly, $699 less on administration. On the other hand, they have more first-year teachers (43 versus 35 percent, on average), three more students per teacher (19 versus 16, on average), and five more schools in their networks (17 versus 12, on average) than nonprofit charter schools. These latter three differences, however, are driven by the schools that send nearly all their funds to their for-profit management organizations to handle staffing and other tasks. Additionally, students in these particular charter schools experience forty-six more instructional hours annually, on average, than students in nonprofit charter schools.
Moreover, for-profit charters in general spend nearly every penny—keeping an average of just 5 percent of their operating expenditures as cash on hand to help them cope with revenue volatility (see Table A2 in Appendix A). These results paint a picture consistent with the notion that for-profit organizations seek to maximize economies of scale.[24]
Table 3. For-profit charter schools spend more in the classroom and less on administration than nonprofit charter schools that contract with nonprofit management organizations, but there are significant differences between for-profit charters that do and do not purchase personnel services from their management organization.
|
Characteristic
|
Non-profit – Mgmt. Org. Average
(N=47)
|
For-Profit Difference
|
|
All For-Profits
(N=107)
|
For-Profit – Own Staff
(N=28)
|
For-Profit – Contract Staff
(N=79)
|
|
Schools in operator network
|
12 schools
|
+5*
|
-1
|
+6*
|
|
Percent of teachers in their first year
|
35 percent
|
+8*
|
0
|
+9*
|
|
Student-teacher ratio
|
16 students/instructor
|
+3*
|
+2*
|
+3*
|
|
Percent of teachers with a master’s degree
|
22 percent
|
+4
|
0
|
+4*
|
|
Classroom expenditures per student
|
$5,588
|
+581*
|
528
|
594
|
|
School age (years)
|
10 years
|
+1*
|
+4*
|
1
|
|
Annual instructional hours per student (actual)
|
1,004 hours
|
+29*
|
-43*
|
+46*
|
|
Average teacher experience (years)
|
5 years
|
+1*
|
+1*
|
0
|
|
Teacher annual pay (dollars)
|
$37,802
|
-814
|
-4,093*
|
-14
|
|
Total expenditures per student
|
$10,682
|
-79
|
-340
|
-17
|
|
Percent of expenditures on salary/benefits
|
55 percent
|
-5*
|
-1
|
-6.5*
|
|
Administrative expenditures per student (dollars)
|
$2,816
|
-699*
|
-1,627*
|
-476
|
Note. The table compares 2019 characteristics of charter schools serving grades 4–8 that contract with for-profit organizations compared to nearby charters in the same district that contract with nonprofit organizations. Estimates are weighted by student enrollment. Estimates starred and in bold indicate a statistically significant difference between for-profit charter schools and the nonprofit charter schools used as a baseline (p < 0.10 using a two-tailed test and clustering errors at the school level). For-profit schools are separated into those that have their own instructional staff (“for-profit – own staff”) and those that contract with their management organization for personnel services (“for-profit – contract staff”).Comparing the results of for-profit and nonprofit charter schools
- Summary of Results
-
In this section, we compare for-profit and nonprofit charter schools in the same district while controlling for school composition (i.e., the average baseline test scores and demographic characteristics of their students).[25] We find that nonprofit charter schools exhibit slightly higher achievement gains than their for-profit counterparts and that chronic absenteeism is especially high in the latter—particularly those that contract with their management organizations for staffing. [26]
Finding 4: Nonprofit charter schools exhibit slightly higher achievement gains than for-profit charter schools.
Figure 4 compares the impact on academic achievement of for-profit and nonprofit charter schools operating in the same geographic district, holding constant their student makeup. Figure 4 shows that annual achievement growth is slightly (0.02 standard deviations) lower among students in for-profit charter schools compared to similar students in nearby nonprofit charter schools with similar student bodies.[27] This lower growth (which is still greater than that of nearby traditional public schools) is driven by lower math achievement, particularly in for-profit schools that hire their own staff. Overall, there is no statistically significant difference in the average achievement impact of the for-profit schools that use external hiring and the nonprofit charter schools operating in the same district (though this average masks less progress in math in for-profit charters).
Figure 4. Students in for-profit charter schools experience somewhat lower achievement growth relative to same-district nonprofit charter schools.
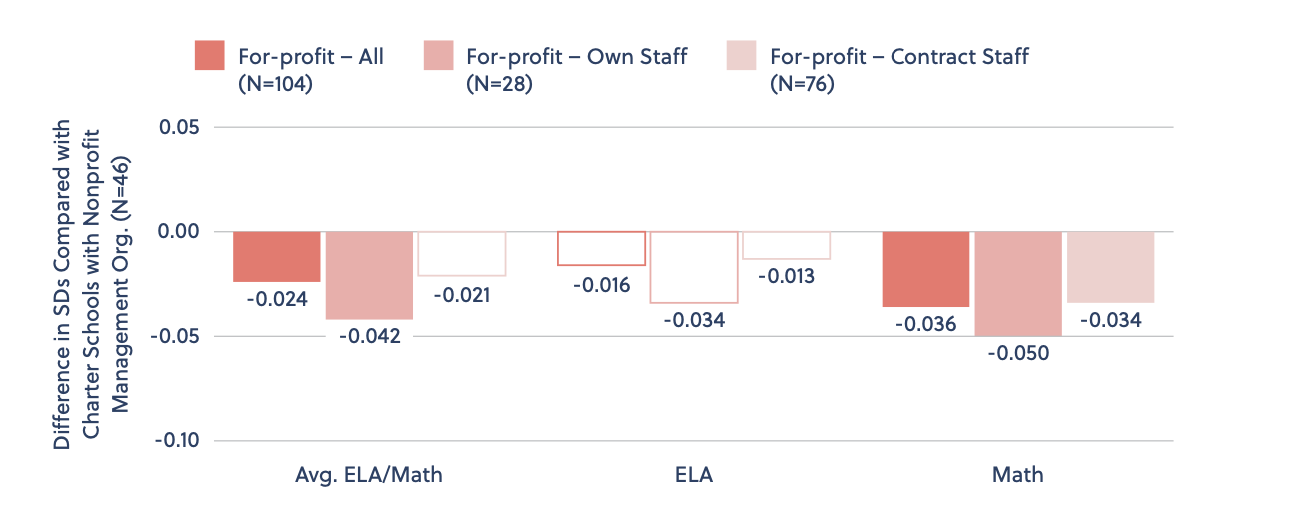
Note. The figure shows the annual impact of attending charter schools operated by for-profit management organizations (as opposed to nonprofit management organizations) on achievement in grades 4–8. Achievement estimates are in standard deviation units. Solid bars are statistically significant differences (p < 0.10 using a two-tailed test and clustering errors at the school level). Positive/negative estimates indicate relative increases/decreases in achievement for students attending charter schools with for-profit management organizations as compared to similar students attending nearby schools with nonprofit management organizations. For-profit schools are separated into those that hire their own instructional staff (“for-profit – own staff”) and those that contract with their management organization for personnel services (“for-profit – contract staff”). Estimates are based on 65,219 student-year observations.
Note. The figure shows the annual impact of attending charter schools operated by for-profit management organizations (as opposed to nonprofit management organizations) on achievement in grades 4–8. Achievement estimates are in standard deviation units. Solid bars are statistically significant differences (p < 0.10 using a two-tailed test and clustering errors at the school level). Positive/negative estimates indicate relative increases/decreases in achievement for students attending charter schools with for-profit management organizations as compared to similar students attending nearby schools with nonprofit management organizations. For-profit schools are separated into those that hire their own instructional staff (“for-profit – own staff”) and those that contract with their management organization for personnel services (“for-profit – contract staff”). Estimates are based on 65,219 student-year observations.Finding 5: The heightened rates of chronic absenteeism among for-profit charter schools are driven by those that send nearly all their funds to their management organizations for staffing costs.
Results in Figure 5 show that for-profit charter schools that contract with their management organization for staff are driving the negative attendance results in the for-profit sector. Students attending these schools experience worse attendance rates and are more likely to be chronically absent than similar students attending nonprofit charter schools[28] (students at these schools are also somewhat less likely to be reported for disciplinary action). In other words, the adverse effects on student attendance rates overall in the for-profit sector are driven entirely by the for-profit charter schools that contract externally for staffing services. In fact, students in for-profit charters that hire their own staff—and are therefore less reliant on their management organizations for instructional delivery—experience improvements in attendance rates and declines in rates of chronic absenteeism.
Figure 5. The for-profit charter schools that send most of their funds to their management organizations for staffing drive the inferior attendance outcomes.
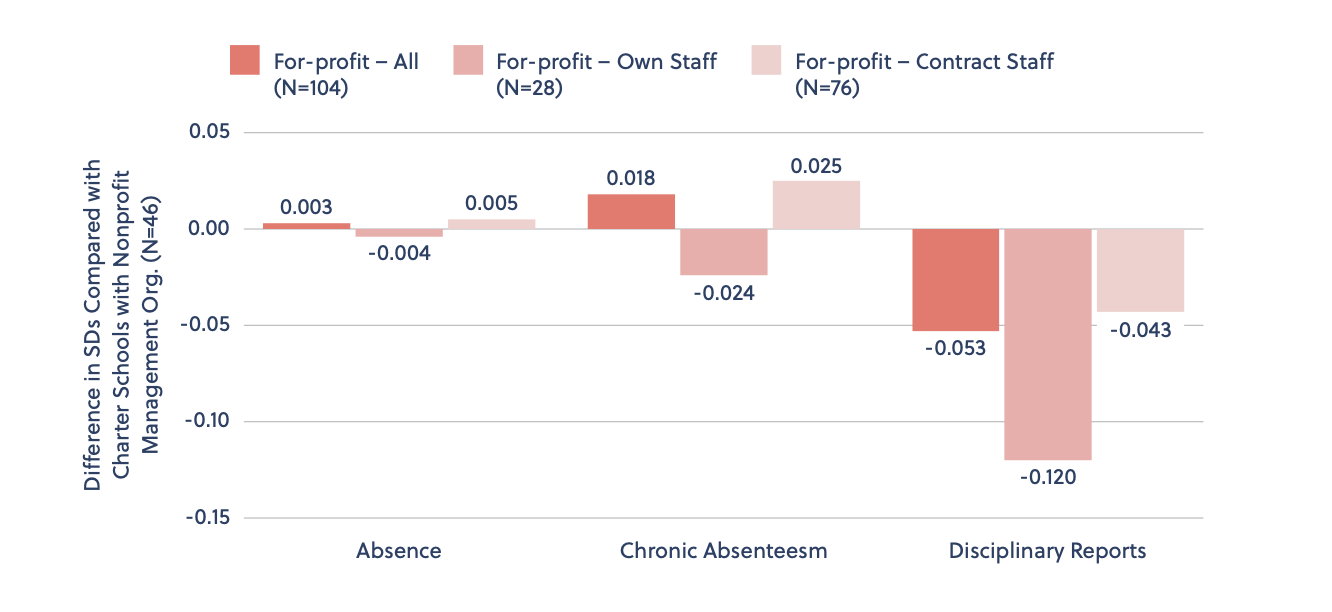
Note. The figure shows the annual impact of attending charter schools operated by for-profit management organizations on absence rates, rates of chronic absenteeism, and disciplinary reports among students in grades 4–8, which are fractions that translate to percentage points. Positive/negative estimates indicate relative increases/decreases in absence/absenteeism rates and the probability of disciplinary incidents for students attending charter schools with for-profit management organizations compared to similar students attending nearby schools with nonprofit management organizations. Solid bars are statistically significant differences (p < 0.10 using a two-tailed test and clustering errors at the school level). For-profit schools are separated into those that have their own instructional staff (“for-profit – own staff”) and those that contract with their management organization for personnel services (“for-profit – contract staff”). Estimates are based on 65,173 student-year observations.
Note. The figure shows the annual impact of attending charter schools operated by for-profit management organizations on absence rates, rates of chronic absenteeism, and disciplinary reports among students in grades 4–8, which are fractions that translate to percentage points. Positive/negative estimates indicate relative increases/decreases in absence/absenteeism rates and the probability of disciplinary incidents for students attending charter schools with for-profit management organizations compared to similar students attending nearby schools with nonprofit management organizations. Solid bars are statistically significant differences (p < 0.10 using a two-tailed test and clustering errors at the school level). For-profit schools are separated into those that have their own instructional staff (“for-profit – own staff”) and those that contract with their management organization for personnel services (“for-profit – contract staff”). Estimates are based on 65,173 student-year observations.How do for-profit charters compare to traditional public schools?
A 2020 Fordham Institute report (authored by one of this report’s authors) compared the performance of Ohio charter schools to the state’s traditional public schools.[29] That report found that both nonprofit and for-profit charter schools outperformed nearby traditional public schools (see Appendix A for additional evidence that replicated this finding). Moreover, within the charter sector, nonprofits outperformed for-profits.
Analyzing charter high schools, the results here follow those of the previous report, finding generally strong performance, although those for for-profit charter high schools are more mixed. Students in nonprofit charter high schools (particularly those attending schools with nonprofit management organizations) have greater achievement growth than traditional public-school students (Figure S1). Specifically, in grades 9–11, students in nonprofit charter schools experience achievement gains that are 0.06–0.08 standard deviations greater (as measured by the ACT, which includes both math and ELA content) than similar students attending traditional public schools (across the board, though, the charter school advantage is more pronounced in ELA). Students attending for-profit charter high schools, however, experience lower achievement growth in mathematics (0.08 standard deviations lower) than similar students in nearby traditional public schools.[30]
Figure S1. High school students in nonprofit charter schools experience greater achievement than similar students attending traditional public schools.
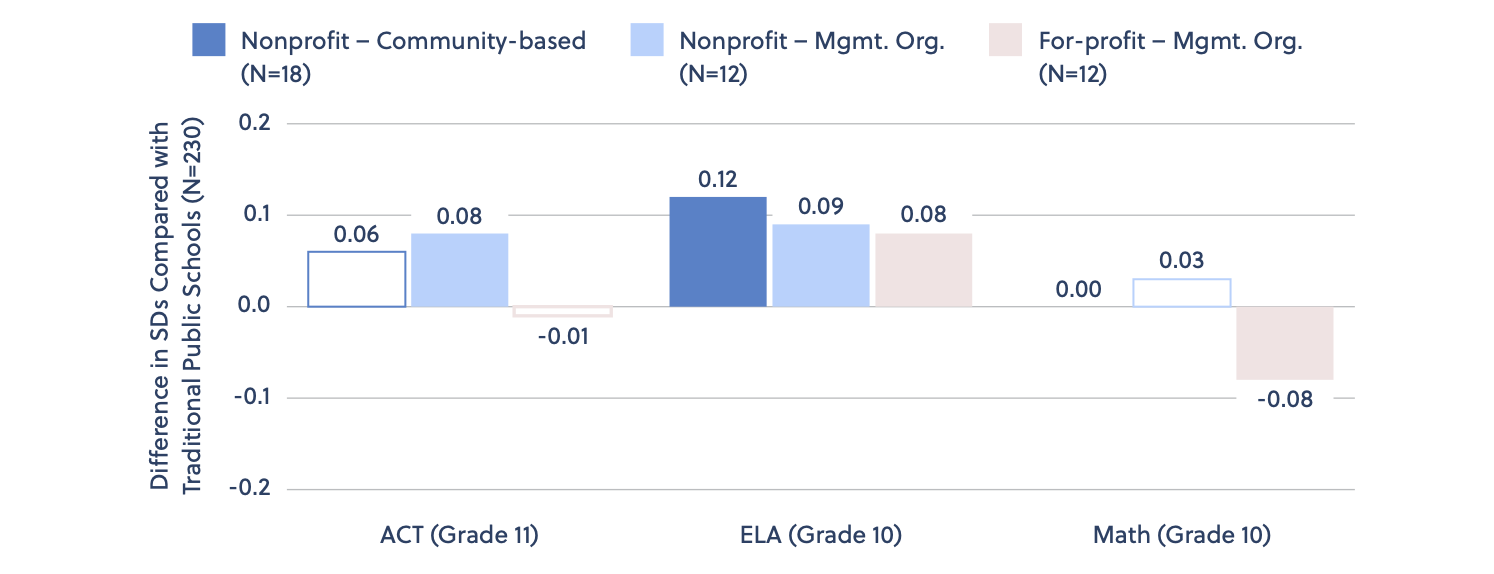
Note. The figure illustrates the annual impact of attending a charter school versus a traditional public school on student achievement growth in grades 4–8 and the total impact on growth in grades 9–10 or 9–11 (depending on the test). Achievement growth estimates are in standard deviation units. Positive (negative) estimates indicate relative increases (decreases) in achievement for students attending charter schools as compared to similar students attending traditional public schools. Solid bars indicate statistically significant differences (p < 0.10 using a two-tailed test and clustering errors at the school level). Estimates are based on 71,070 student-year observations.
Note. The figure illustrates the annual impact of attending a charter school versus a traditional public school on student achievement growth in grades 4–8 and the total impact on growth in grades 9–10 or 9–11 (depending on the test). Achievement growth estimates are in standard deviation units. Positive (negative) estimates indicate relative increases (decreases) in achievement for students attending charter schools as compared to similar students attending traditional public schools. Solid bars indicate statistically significant differences (p < 0.10 using a two-tailed test and clustering errors at the school level). Estimates are based on 71,070 student-year observations.In contrast to the strong performance of charters on academic assessments, Figure S2 shows that nonprofit charter schools offer no statistically significant advantages in terms of the probability of ever receiving an Ohio diploma and that students attending for-profit charter high schools are six percentage points less likely to do so (a 7 percent decline from the average graduation rate of 87.5 percent in our sample). However, the figure reveals that students who attend nonprofit charter schools are significantly more likely to persist to grade 11 and just as likely (if not more) to sit for the ACT than students in traditional public schools. These results are consistent with the positive attendance estimates in other grades (see Appendix A) and confirm that the positive charter school effects on the ACT exam are not due to charter schools getting rid of low-achieving students low-achieving students.
Figure S2. Students in for-profit charter high schools are less likely to receive an Ohio diploma compared to students in nonprofit charters or traditional public schools, but comparable students in all schools are just as likely to take the ACT or SAT in eleventh grade.
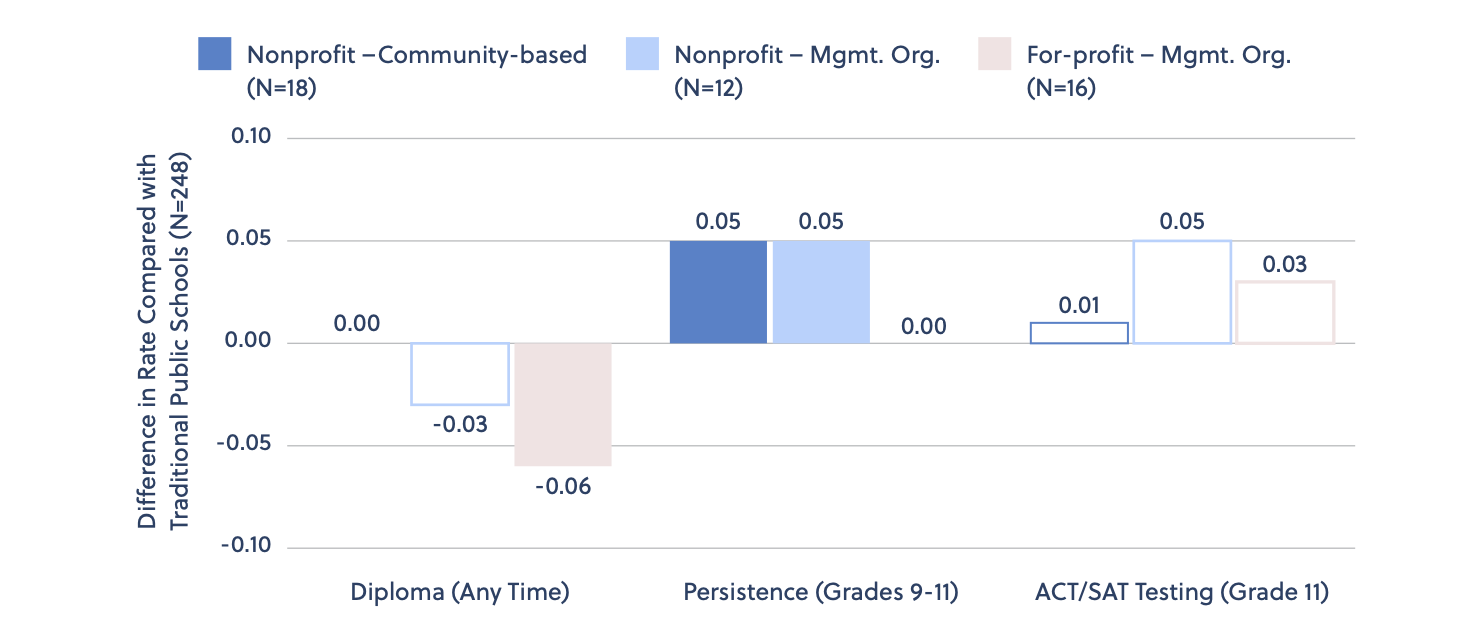
Note. The figure shows the differences in the graduation, persistence, and test participation rates between students attending charter schools relative to students attending traditional public schools. Positive (negative) estimates indicate relative increases (decreases) in graduation, persistence, and test participation rates for students attending charter schools relative to similar students attending traditional public schools. Solid bars indicate statistically significant differences (p < 0.10 using a two-tailed test and clustering errors at the school level). Estimates are based on 251,675 student-year observations.
Note. The figure shows the differences in the graduation, persistence, and test participation rates between students attending charter schools relative to students attending traditional public schools. Positive (negative) estimates indicate relative increases (decreases) in graduation, persistence, and test participation rates for students attending charter schools relative to similar students attending traditional public schools. Solid bars indicate statistically significant differences (p < 0.10 using a two-tailed test and clustering errors at the school level). Estimates are based on 251,675 student-year observations.Also worth mentioning: the strong performance of charter schools in Ohio may be a result of those schools providing more instructional hours (Figure S3).
Figure S3. Charter schools’ superior achievement growth in grades 4–8 corresponds to a significantly greater number of instructional hours.
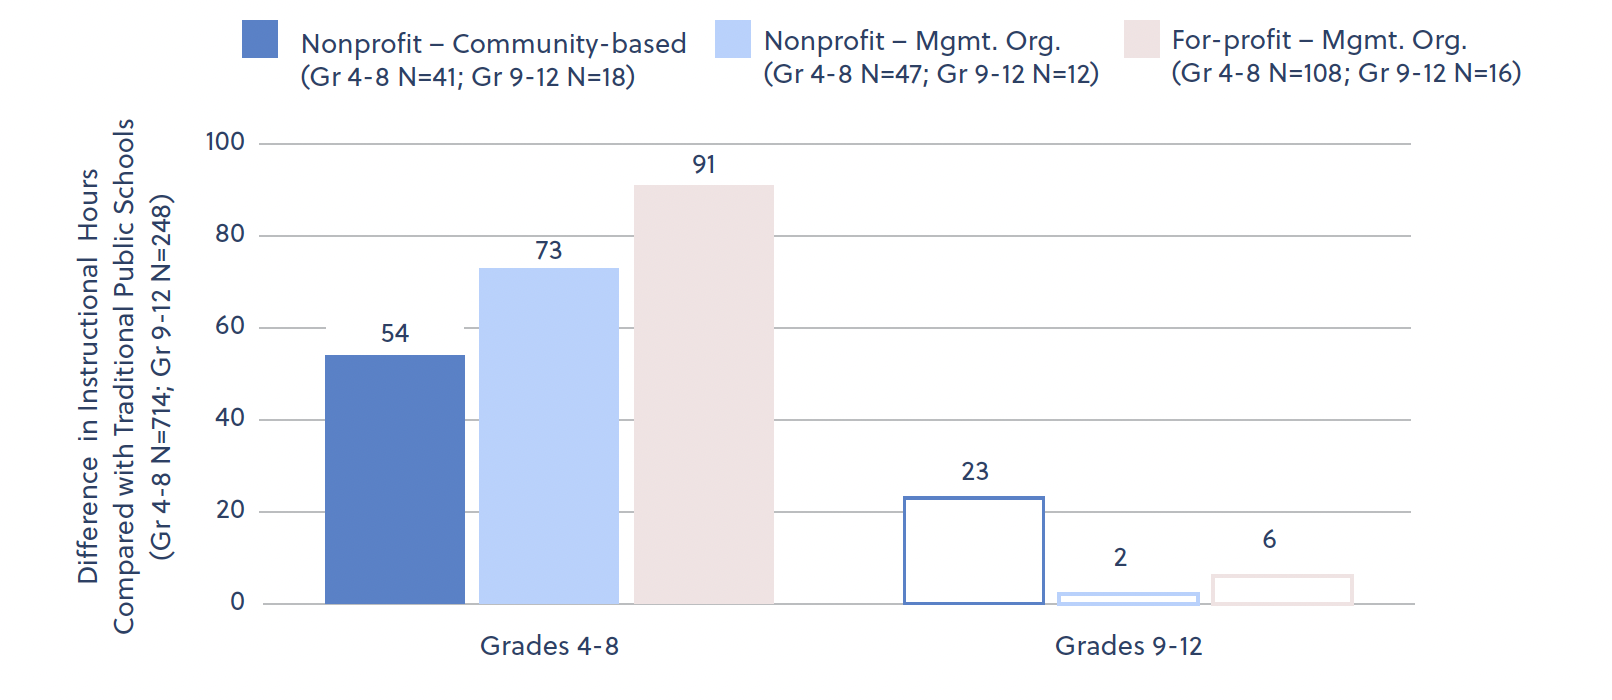
Note. The figure shows the difference in annual instructional hours for students attending charter schools relative to students attending traditional public schools. Positive (negative) estimates indicate relative increases (decreases) in annual instructional hours for students attending charter schools relative to similar students attending nearby traditional public schools. Solid bars indicate statistically significant differences (p < 0.10 using a two-tailed test and clustering errors at the school level). Grades 4–8 estimates are based on 569,774 student-year observations, and grades 9–11 estimates are based on 251,675 student-year observations.
Note. The figure shows the difference in annual instructional hours for students attending charter schools relative to students attending traditional public schools. Positive (negative) estimates indicate relative increases (decreases) in annual instructional hours for students attending charter schools relative to similar students attending nearby traditional public schools. Solid bars indicate statistically significant differences (p < 0.10 using a two-tailed test and clustering errors at the school level). Grades 4–8 estimates are based on 569,774 student-year observations, and grades 9–11 estimates are based on 251,675 student-year observations. Implications
The analysis suggests three takeaways.
First, banning, restricting, or limiting funding for charter schools that contract with for-profit management organizations could adversely impact the disadvantaged students that such schools primarily serve. There are clear educational benefits of for-profit charter schools. Their average impact on student achievement is substantively and statistically greater than that of traditional public schools in the same geographic school district. These results hold even if we limit the analysis to for-profit charter schools that send nearly all their operating funds to their for-profit management organization. But we also don’t know what other schools students would attend—or how effective they would be—if federal funding were denied to charter schools that use for-profit management organizations.[31]
Although not definitive, our analysis suggests some distinct advantages for charter schools managed by for-profit organizations. These schools tend to focus more on instruction versus administration, as they spend more on classroom activities and students experience more instructional hours. This pattern corresponds to economies of scale, as for-profit schools spend less on personnel, have higher student-teacher ratios, and have larger networks of schools than nonprofit schools, on average. The for-profit delivery-model—which appears to be less staff dependent—is more effective than the traditional public school system at educating low-achieving students when it comes to ELA and math content on standardized exams but perhaps less effective at promoting attendance and educational attainment.
Second, virtual charters and charter schools that contract out almost all of their services to a for-profit organization may deserve extra scrutiny. This analysis reveals that students in for-profit charter schools are more likely to be chronically absent than students in nonprofit charter schools or traditional public schools. This result is driven entirely by for-profit charter schools that send nearly all of their operating funds to their for-profit management organizations, which also have larger operator networks, more students per teacher, and more teacher turnover than nonprofit charter schools that contract with nonprofit operators.
In Appendix B, we also document the significant academic struggles of students in virtual schools—a finding that has been well documented in the literature. All virtual schools are, by definition, charter schools in Ohio, and they are also far more likely to be managed by for-profit organizations.
Third, states should continue to expand high-quality charter schools, given their strong track record. Ohio’s charter schools, on average, cost less and outperform nearby traditional public schools with respect to student achievement, attendance, and disciplinary incidents. Although there’s a perception that Ohio charter schools perform poorly compared to charter schools in other states,[32] evidence is mounting that Ohio’s charters are good choices for many families.[33] As this study and our previous study on the topic have shown, students attending brick-and-mortar charter schools experience substantial improvements in math and reading achievement, increases in attendance rates, and declines in rates of chronic absenteeism and reported disciplinary incidents. Results show that the positive average impact of charter school attendance (relative to traditional public schools in the same geographic district) is not due to a few high-performing charter schools but the fact that charters are generally delivering above average results.
Endnotes
[1] In particular, the 2020 Democratic Party platform states, “We will ban for-profit private charter businesses from receiving federal funding.” See Democratic National Committee, “2020 Democratic Party Platform,” accessed April 28, 2021, https://democrats.org/where-we-stand/party-platform.
[2] In Arizona, for-profit organizations are permitted to hold a school’s charter.
[3] Only 12 percent of charter schools nationwide have for-profit management organizations, and 80 percent of these schools are in four states: Arizona, Florida, Michigan, and Ohio. Kat Sullivan, “Are Charter Schools For Profit?” National Alliance for Public Charter Schools, January 16, 2019, accessed April 28, 2021, https://www.publiccharters.org/latest-news/2019/01/16/are-charter-schools-profit.
[5] The lone exception is Arizona, where for-profit organizations are permitted to hold a school’s charter.
[6] Stéphane Lavertu, The Impact of Ohio Charter Schools on Student Outcomes, 2016–19 (Columbus, OH: Thomas B. Fordham Institute, October 2020), https://fordhaminstitute.org/ohio/research/impact-ohio-charter-schools-student-outcomes-2016-19. The report also documented notable improvements in the charter school sector as a whole from 2016 to 2019, which stems primarily from state actions that have led to declining enrollments in for-profit virtual schools. Most notably, the Ohio Department of Education’s demand for a refund of $80 million from the virtual school Electronic Classroom of Tomorrow (ECOT) led to that school’s closure. Similarly, 2015 reforms greatly strengthened a state accountability system that now holds a charter school’s authorizer responsible for poor academic performance, and which imposed further regulations to enhance the transparency of charter school finances. This report did not examine differences in administrative practices between for-profit and nonprofit schools, impacts in high school, or outcomes other than math and ELA achievement.
[7] Center for Research on Education Outcomes, Charter Management Organizations 2017 (Stanford, CA: Center for Research on Education Outcomes, 2017), https://credo.stanford.edu/report/charter-management-organizations. Since for-profit organizations are more likely to operate online or “virtual” charter schools, it may be that for-profit management organizations appear less effective because of the difficulties associated with distance learning.
[8] Susan Dynarski, Daniel Hubbard, Brian Jacob, and Silvia Robles, “Estimating the Effects of a Large For-Profit Charter School Operator” (working paper No. 24428, Cambridge, MA, National Bureau of Economic Research, March 2018), doi:10.3386/w24428.
[9] John D. Singleton, “Putting dollars before scholars? Evidence from for-profit charter schools in Florida,” Economics of Education Review 58 (June 2017): 43–54, doi:10.1016/j.econedurev.2017.03.004. Also see Cynthia D. Hill and David M. Welsch, “For-Profit Versus Not-for-Profit Charter Schools: An Examination of Michigan Student Test Scores,” Education Economics 17, no. 2 (June 2009): 147–66, doi:10.1080/09645290801977017, and Tim R. Sass, “Charter Schools and Student Achievement in Florida,” Education Finance and Policy 1, no. 1 (2006): 91–122, doi:10.1162/edfp.2006.1.1.91.
[10] Cellini’s (2021) review of sectorial differences in higher education indicates that students in for-profit colleges have lower future earnings and employment rates than similar students in nonprofit colleges. But there are more extensive financial regulations and more robust accountability systems in the K–12 public charter school sector than in postsecondary education. Stephanie Riegg Cellini, “For‐Profit Colleges in the United States:
[11] Throughout this report, academic years are referred to by their spring terms—e.g., 2018–19 is referred to as “2019.”
[12] For example, traditional public high schools are typically stand-alone schools serving grades 9–12 exclusively, and they are often much larger and spend more per pupil than elementary schools. High school grades also pose analytical challenges such as student attrition and irregular testing schedules, which are not as big an issue in elementary grades. Additionally, we limit the achievement analysis to grades 4–11 (due primarily to limitations in the availability of test data) and estimate impacts on high school graduation rates based only on a student’s high school experience beginning in grade 9 (due to limitations in the availability of historical data). Finally, although we focus on schools in operation during the 2019 school year, the analysis of educational impacts examines student outcomes across four school years (2016–19) to increase statistical precision.
[13] We illustrate this symmetry in the final part of Appendix A, which presents the distribution of charter school achievement gains estimates for math and ELA in grades 4–8 (Figure A5) and for the ACT among students we observe in charter schools in grade 9 (Figure A6). The figures reveal that the distributions become more normal when we weight them by student counts (which is what our main analysis effectively does), and it illustrates how much more symmetric and approximately normal the distributions when we have a lot of data (estimates for grades 4-8), as compared to the analysis in which we have little data (ACT estimates for grade 11).
[14] Specifically, we obtained from the Ohio Department of Education schools’ May 2019 forecasts, so that they capture information through the end of the 2018–19 school year—the last year for which we have the necessary student-level outcome data. We coded, validated, and combined these 2019 forecast data and ultimately ended up with a school-level dataset of financial information for 313 charter schools in operation during the 2019 school year. These forecasts include detailed budget information, including spending for “purchased services” (e.g., how much schools paid vendors for transportation, food, management, and personnel services). These data also include historical budget information by function for the 2016–18 school years, which Ohio directs schools to use in generating their financial projections. For more details, see Stéphane Lavertu and Travis St.Clair, “Beyond spending levels: Revenue uncertainty and the performance of local governments,” Journal of Urban Economics 106 (2018): 59–80, doi:10.1016/j.jue.2018.06.003.
[15] They report these data according to a coding scheme developed by the Ohio Auditor of State. This scheme requires reporting by fund (e.g., restricted state grants), function (e.g., classroom instruction), and object (e.g., specific goods and services).
[16] First, we compiled the Ohio Department of Education’s charter school annual reports (2015–19), which indicate the districts in which charter schools are located, the students they serve (e.g., “general” vs. “special education”), and whether they are virtual “e-schools” or brick-and-mortar “site-based” schools. Second, we obtained from the Ohio Department of Education their determination of which school management organizations are for-profit and nonprofit, which they submit to the U.S. Department of Education annually. Third, we employed both federal Common Core data and state data to calculate student-teacher and student-staff ratios based on student and staff “full-time equivalent” (FTE) units. Fourth, we obtained restricted-use teacher-level data that indicate the school buildings in which they work, annual salary, education level, and years of experience. We used these teacher-level data to create school-level variables that we included in our school-by-year dataset.
[17] Indeed, because there is considerable variability in the timing of tests in high school (particularly the Algebra exam, which students often take in grade 8, 9, or 10, depending on their coursework), the analysis of achievement in high school grades focuses on students who took tests in the modal grade (ELA II and Geometry in grade 10 and the ACT in grade 11). As the analysis shows, the probability that observationally similar eighth-grade students take those tests in modal grades (particularly ELA II and ACT) is comparable across school types. Additionally, because a small minority of students take the SAT instead of the ACT (which also fulfils Ohio’s requirement that they take a college entrance exam), the analysis analyzes ACT scores for which we imputed missing values using the student’s SAT score—based on publicly available 2016–19 conversion charts. Finally, unlike the state math and ELA exams in grades 3–10, we normalize the ACT effect estimates based on the national standard deviation on that exam.
[18] A student’s district of residence is arguably better for estimating impacts of charter schools on educational outcomes, as students may attend charter schools in a different district than the one in which they reside. Unfortunately, students’ districts of residence was not in the dataset used for this analysis. However, in other analyses using ODE data, the authors found that which district one accounts for (district of residence or district of attendance) has no substantively significant impact on the results once one controls statistically for students’ prior test scores and baseline demographic characteristics.
[19] Importantly, all estimates are from statistical models that econometricians have endorsed for these types of schools and pupil populations, and the results are generally insensitive to model specification. For example, we find that the results are insensitive to our inclusion of multiple years of test score lags (e.g., controlling for both seventh- and eighth-grade test scores in the high school analysis), although including more lags increases the precision of our estimates. The Fordham Institute’s 2020 report on Ohio charter schools also reveals that the specific statistical models used in this report yield results comparable to other common statistical approaches (see Stéphane Lavertu, The Impact of Ohio Charter Schools on Student Outcomes, 2016–19). Some readers might be concerned that charter schools’ relative effectiveness may stem not from the impact of their educational practices but from the superior educational environment students enjoy because they are surrounded by relatively motivated peers. To address this possibility, we also reestimated all models while controlling for school-level averages in baseline student achievement and demographic characteristics. As we discuss, doing so has virtually no impact on the estimated effects of charter school attendance on student achievement, but it appears to have some effect on behavioral outcomes such as attendance rates.
[20] Research indicates that comparing changes in outcomes among observationally similar students should yield credible estimates of the effects of charter school attendance among students attending schools in the same district. But estimates could be inaccurate if comparing students across district boundaries or those in unusual circumstances. For example, most Ohio charter schools that focus on student populations with special needs have no natural comparison groups among traditional public schools. Indeed, all Ohio schools that focus on DPR are charter schools. The students they serve are different by definition. Similarly, the unmeasured factors that lead students to select into online “virtual” schools—all of which Ohio law labels as charter schools and most of which draw students statewide—are also likely to make them significantly different from traditional public school students attending brick-and-mortar schools.
[21] We can only observe how much schools send to their management organizations for personnel services—we cannot distinguish between types of personnel (e.g., teachers). However, because nearly all schools either contract for all or none of their personnel services, those with personnel costs expended primarily through the operator must contract for personnel staff. We read a sample of management organization contracts and confirmed that this indicates that staff are the formal employees of the for-profit management organization.
[22] The forecast data are not thoroughly validated by the state. Indeed, we discovered some inaccuracies in the data on “purchased services,” which we used to distinguish between schools that contract out a lot or a little. Nevertheless, these data seem to generally correspond to the contents of management organization contracts. Contracting data only tell us how much goes to the management organization—not whether the organization, in turn, contracts with for-profit vendors for particular services. Thus, only the contracting data for for-profit-operated schools provides insights on schools’ reliance on for-profit organizations.
[23] As in Table 3, the results are weighted by student enrollment, and statistically significant differences are bolded and starred. Some of the variables differ, however, as they are from charter-specific data files.
[24] Note that budgeting and staffing results are based on self-reported data that are not all thoroughly validated by the state.
[25] There are nine Ohio school districts in which we observe charter schools with nonprofit and for-profit management organizations (see Table A1 in Appendix A). Unfortunately, we have insufficient observations to conduct this analysis for charter schools serving high school grades.
[26] We also conducted this grade 4–8 analysis in our comparisons to traditional public schools, but the results were similar and only available for grades 4–8 (see Table A3 in Appendix A). Thus, in the interest of space, we present this disaggregated analysis only in this section.
[27] As in the previous analysis, accounting for school-level averages in student characteristics has little impact on the achievement estimates.
[28] As we report previously, these differences are less pronounced when accounting for the average baseline characteristics of a school’s student body (as we do in Figure 8), but they are nonetheless statistically and substantively significant.
[30] Assuming there is no fade-out over time, the achievement results in Figure 5 imply that if a student attended a for-profit charter school for all grades 4–8, their average achievement in mathematics and ELA would be approximately 0.25 standard deviations greater (0.05 x 5 years) than it would have been had they attended a traditional public school. These results imply that, on average, attending a charter school for five years (from grades 4–8) moves the typical student in a for-profit charter from approximately the thirtieth percentile on statewide mathematics and ELA exams to approximately the fortieth percentile. For nonprofit charter schools, the impact of attending all five years in grades 4–8 is equivalent to moving from roughly the thirtieth percentile to the forty-fifth percentile and equivalent to moving from roughly the thirty-fifth percentile in grade 8 to the fortieth percentile in grade 11.
[31] For example, in a prior study, we found that whether the closure of charter schools harmed or benefited students depended on the quality of nearby public schools. Deven Carlson and Stéphane Lavertu, School Closures and Student Achievement: An Analysis of Ohio’s Urban District and Charter Schools (Columbus, OH: Thomas B. Fordham Institute, 2015), https://fordhaminstitute.org/ohio/research/school-closures-and-student-achievement-analysis-ohios-urban-district-and-charter. Also see Deven Carlson and Stéphane Lavertu, “Charter school closure and student achievement: Evidence from Ohio,” Journal of Urban Economics 95 (2016): 31–48, doi:10.1016/j.jue.2016.07.001.
[32] This perception is largely due to CREDO’s reports on Ohio charter schools, which reported the combined effects of virtual and brick-and-mortar charter schools.
[33] Stéphane Lavertu, The Impact of Ohio Charter Schools on Student Outcomes, 2016–19.