Mobile Navigation

  • National
    • Policy
      • High Expectations
      • Quality Choices
      • Personalized Pathways
    • Research
    • Commentary
      • Gadfly Newsletter
      • Flypaper Blog
    • Events
    • Scholars Program
  • Ohio
    • Policy
      • Priorities
      • Media & Testimony
    • Research
    • Commentary
      • Ohio Education Gadfly Biweekly
      • Ohio Gadfly Daily
  • Charter Authorizing
    • Application
    • Sponsored Schools
    • Resources
  • About
    • Mission
    • Board
    • Staff
    • Career
Home
Home
Advancing Educational Excellence

Main Navigation

  • National
  • Ohio
  • Charter Authorizing
  • About

National Menu

  • Topics
    • Accountability & Testing
    • Advanced Education
    • Career & Technical Education
    • Charter Schools
    • Curriculum & Instruction
    • ESSA
    • Evidence-Based Learning
    • Facilities
    • Governance
    • Personalized Learning
    • Private School Choice
    • School Finance
    • Standards
    • Teachers & School Leaders
    • Think Again
  • Research
  • Commentary
    • Gadfly Newsletter
    • Flypaper Blog
    • Gadfly Podcast
  • Events
  • Scholars Program

The Education Gadfly Weekly

Sign Up to Receive Fordham Updates

We'll send you quality research, commentary, analysis, and news on the education issues you care about.
Thank you for signing up!
Please check your email to confirm the subscription.

The Education Gadfly Weekly: What national test scores tell us about American education before the pandemic

Volume 22, Number 36
8.31.2022
8.31.2022

The Education Gadfly Weekly: What national test scores tell us about American education before the pandemic

Volume 22, Number 36
view
High Expectations

What national test scores tell us about American education before the pandemic

NAGB officials recently reported on U.S. student achievement trends from 2009–19, and what they found was eye-opening. Whereas America’s higher achieving students held steady or even gained ground, our lowest performing kids saw test scores fall, at least in fourth and eighth grades and in reading and math. What might be causing these diverging trends?

Michael J. Petrilli 8.31.2022
NationalFlypaper

What national test scores tell us about American education before the pandemic

Michael J. Petrilli
8.31.2022
Flypaper

Pre-pandemic, more U.S. students were excelling in math

Brandon L. Wright
8.31.2022
Flypaper

Educating young Americans for citizenship is our schools’ top job

Chester E. Finn, Jr.
9.1.2022
Flypaper

What happens when school leaders are allowed to abandon “step and lane” pay scales

Amber M. Northern, Ph.D.
9.1.2022
Flypaper

Education Gadfly Show #835: The expanding partisan gap on K-12 education

8.30.2022
Podcast

Cheers and Jeers: September 1, 2022

The Education Gadfly
9.1.2022
Flypaper

What we're reading this week: September 1, 2022

The Education Gadfly
9.1.2022
Flypaper
view

Pre-pandemic, more U.S. students were excelling in math

Brandon L. Wright 8.31.2022
Flypaper
view

Educating young Americans for citizenship is our schools’ top job

Chester E. Finn, Jr. 9.1.2022
Flypaper
view

What happens when school leaders are allowed to abandon “step and lane” pay scales

Amber M. Northern, Ph.D. 9.1.2022
Flypaper
view
iStock/Getty Images Plus/Moussa81

Education Gadfly Show #835: The expanding partisan gap on K-12 education

Michael J. Petrilli, David Griffith, Ph.D., Amber M. Northern, Ph.D., David M. Houston 8.30.2022
Podcast
view

Cheers and Jeers: September 1, 2022

The Education Gadfly 9.1.2022
Flypaper
view

What we're reading this week: September 1, 2022

The Education Gadfly 9.1.2022
Flypaper
view

What national test scores tell us about American education before the pandemic

Michael J. Petrilli
8.31.2022
Flypaper

One piece of news that you might have missed in the hot summer months came from the National Assessment Governing Board (NAGB), which oversees the National Assessment of Educational Progress (NAEP), a.k.a. The Nation’s Report Card.

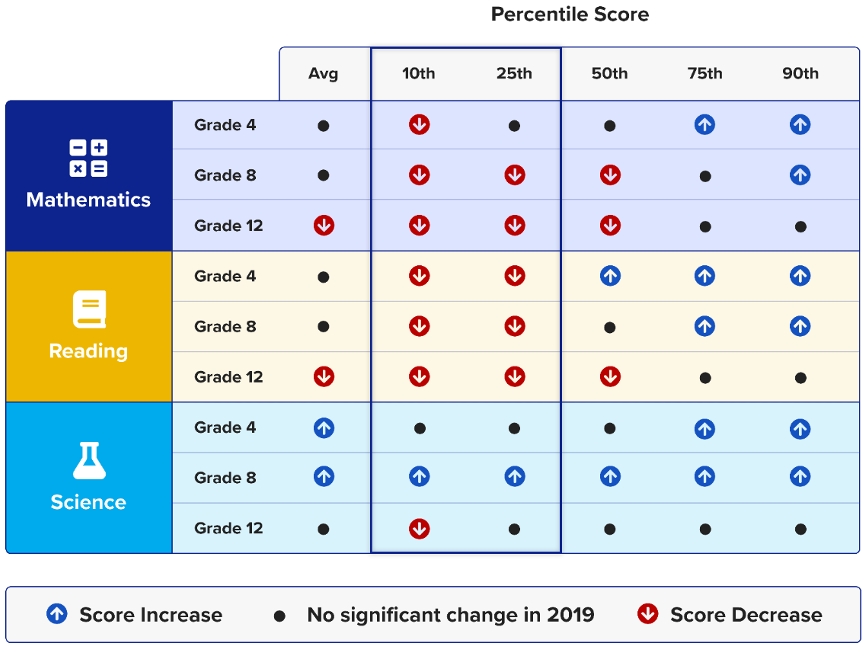
The good folks at NAGB had the smart idea to look at student achievement trends over the decade from 2009 until 2019. (They also have new “before and after the pandemic” data soon to emerge.) What they found was eye-opening. Whereas America’s higher achieving students—defined here as those in the top 10 or 25 percent of the distribution on the NAEP scale—held steady or even gained ground, our lowest performing kids—those in the bottom 10 or 25 percent—saw their test scores fall in both reading and math, at least in the fourth and eighth grades.

Figure 1: Changes in average and selected percentile scores, by assessment: 2009–2019

1

Source: National Assessment of Educational Progress, 2009–19 Mathematics, Reading, and Science

What didn’t come through clearly in some of the ensuing commentary was that this news wasn’t all bad. As my colleague Brandon Wright argues elsewhere, we should celebrate the fact that high achievers are doing better over time. It’s good for them, it’s good for the country, and it’s a plus for our elementary and middle schools. Yet somehow, in today’s environment, it’s mostly seen a bad thing because it widens gaps and thereby leads to greater inequality.

We should reject that viewpoint, even as we redouble our efforts to boost the low achievers, too. The more any kid learns, the better. Education is not a zero-sum game where there must be both winners and losers. And we all benefit if our high-achieving kids learn more and go on to cure cancer or fix climate change or out-compete China.

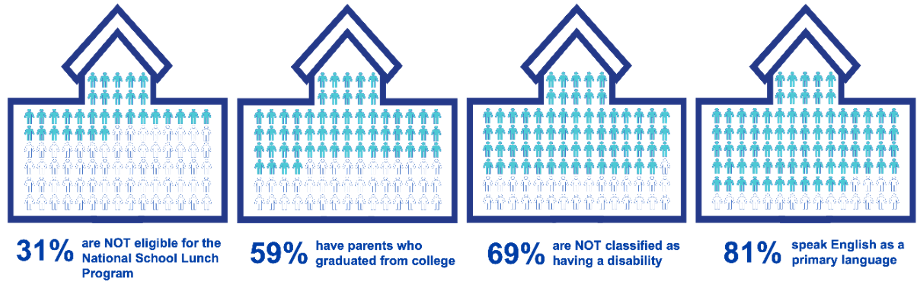
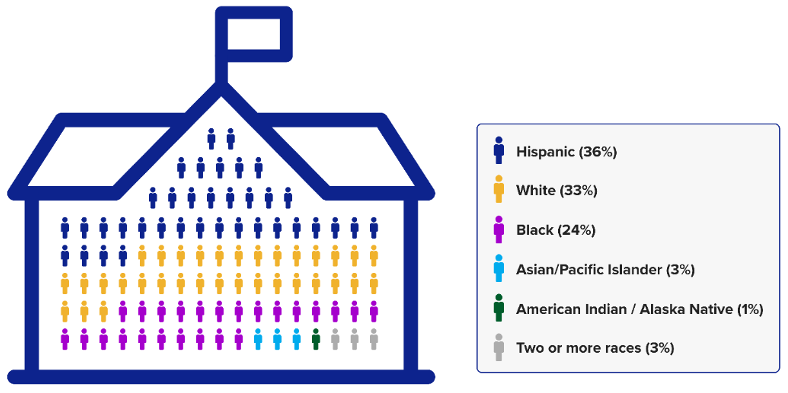
It’s also important to note that the gaps are widening on achievement, not race or income. Indeed, the low-achieving group includes a surprisingly large number of white and middle-class students, including those whose parents are college-educated. And while the high achievers are disproportionately drawn from white, Asian, affluent, and college-educated families, not everyone is.

Figure 2: Selected characteristics of lower-performing students

2

Source: National Assessment of Educational Progress, 2019 Reading, Grade 8

Figure 3: Racial/ethnic composition of students who performed below the 25th percentile

3

Source: National Assessment of Educational Progress, 2019 Reading, Grade 8

So now let’s get to the big question: What might be causing these diverging trends? The Governing Board is silent on this question, as it is supposed to be. It’s a just-the-facts-ma’am kind of outfit, and everyone is supposed to understand that NAEP, for all its virtues, cannot explain causation. But the rest of us can speculate, even as we are careful not to engage in mis-NAEP-ery.

Let’s walk through a few hypotheses, while remembering that what’s causing the decline in scores for low achievers may not be the same factors that are causing the increase in scores for the high achievers.

First, we should consider possibilities that have nothing to do with school. After all, any test score encompasses everything a child has experienced in his or her life to that point, including socioeconomic conditions at home during their early years; the richness of the language they have heard from their parents and other caregivers; preschool experiences; and yes, instruction in the K–12 system. Since children spend much more of their time outside of school than inside, we should always expect that something outside of school could be causing changes in test scores for the population as a whole. That might include:

  • The impact of the Great Recession on children’s socioeconomic circumstances.
  • Ongoing changes that have driven inequality in society writ large, such as “assortative mating” and the intensive—sometime hyper—parenting of college-educated adults.
  • Shifts in how children are spending their time, especially with respect to screen time.

Other possible explanations are more directly related to schooling:

  • Funding cuts in the wake of the Great Recession.
  • The move away from the No Child Left Behind (NCLB) act’s strict test-based accountability system for schools in favor of the looser requirements of the NCLB-waiver era, and eventually the laissez faire approach of the Every Student Succeeds Act.
  • The shift to the higher standards, and loftier instructional goals, of the Common Core.

Let’s explore whether any of these possibilities make sense.

The high achievers fly higher

Let’s start with the high achievers. What might be helping our top fourth and eighth graders do better than ever?

It’s hard to believe that anything in the broader economy can explain the trend, given the terrible aftereffects of the Great Recession.

It’s also difficult to fathom that the increasing prevalence of smart phones and other screens in the lives of children would be beneficial, though maybe it’s not impossible. Perhaps our most motivated students have been using their screens to learn more and indulge their curiosities? Maybe they are tuning into daily Khan Academy lessons and YouTube videos of educational content? I’m doubtful, but perhaps?

Or maybe we are mostly seeing the benefits of America’s affluent, college-educated parents marrying one another, waiting until they are older and richer to start their families, and then plowing an enormous amount of time and resources into raising their children. Maybe all that money spent on organic food and afterschool tutoring and summer enrichment activities is paying off. Maybe.

In my view, though, a more plausible explanation is that schools are simply paying more attention to their higher-achieving students than they were in the early 2000s. As we at the Thomas B. Fordham Institute reported back then, it was a problem that NCLB was so focused on helping the lowest performing students reach a low level of proficiency. Teachers admitted that they prioritized their struggling students over everybody else, certainly including their high flyers. Everything in our accountability system encouraged them to do so.

As NCLB waivers and eventually ESSA allowed states to move to a focus on student growth, perhaps that started to change. At the same time, the shift to the Common Core encouraged teachers to raise their level of instruction, and to adopt more challenging curricular materials. All of this might have benefited our high-achieving students, as they got more attention from their teachers, and received instruction that was more closely targeted to their level of readiness.

Granted, this hypothesis requires a multi-step process to be true, happening at huge scale in an enormous, continent-wide country.

Whatever the explanation, I’m happy about it and would love to see some scholars with serious methodological chops find clever ways to test one or more of these hypotheses. It would be great if we could keep these trends going, even in the wake of the pandemic.

How low can we go?

Next to the bad news about our low achieving students. Frankly, I think this puzzle is easier to solve.

I’ve argued before that the Great Recession had a negative impact on the achievement of our poor and working-class students. That’s not the same group we are talking about here, but there is obviously a lot of overlap. That impact came directly in the form of the difficult years for families when these students were infants, toddlers, and preschoolers. Income plummeted. Poverty rates rose. Food insecurity grew. All of this would make a difference with these tykes’ later achievement. Consider, for example, findings from NWEA that showed declining test scores at kindergarten entry in the early 2010s. I suspect this also explains why so many of our social indicators were heading in the wrong direction even before the pandemic—such as the murder rate, auto accidents, and more. The downstream effects of early-childhood hardship can take years or even decades to become clear. 

The impact of the Great Recession also happened indirectly, in the form of the dramatic K–12 spending cuts that happened from 2011 to 2014. Kirabo Jackson showed convincingly that these cuts had a negative impact on achievement. And it’s not hard to imagine that those spending reductions might have hurt the lowest-performing kids the most, as easy targets for cuts would have been tutoring programs, literacy coaches, and other extras that schools may have been directing towards their struggling students.

The screen-time story also makes more sense here, as we know that kids are spending dramatically more time on devices and on social media, and that could be getting in the way of learning. Especially if low-achieving students spent more time on screens than their higher-achieving peers.

And then there is the end of No Child Left Behind and the rise of the Common Core, which could be the flipside of the story with the high-achieving students. Moving away from the proficiency-only policy of the NCLB era, and toward a focus on growth and rigorous standards, encouraged a shift away from the drill-and-kill of basic skills, toward a higher level of instruction. While I believe that was the right thing to do and probably helped the majority of students, it is possible that teachers’ lessons started going way over the heads of our lowest-performing students, leaving them behind. Indeed, we have heard concerns all along from teachers that they are struggling to use the newer, higher quality instructional materials with their lowest-performing students. They have asked for more help to “scaffold” instruction, and it’s only very recently that many of the publishers have been able to offer decent advice on that front.

—

To repeat, these are educated guesses, and we would be better off if analysts could begin to see which of these theories might have a basis in the evidence.

In the meantime, we are about to find out from the Long Term Trend release whether we are coming out of the pandemic in even worse shape than we were going in. Understanding what happened in the pre-pandemic era might help us do better by kids in the post pandemic era and beyond.

view

Pre-pandemic, more U.S. students were excelling in math

Brandon L. Wright
8.31.2022
Flypaper

Editor’s note: This is an edition of “Advance,” a newsletter from the Thomas B. Fordham Institute written by Brandon Wright, our Editorial Director, and published every other week. Its purpose is to monitor the progress of gifted education in America, including legal and legislative developments, policy and leadership changes, emerging research, grassroots efforts, and more. You can subscribe on the Fordham Institute website and the newsletter’s Substack.

This week brings initial data from the 2022 Nation’s Report Card—what my colleague Checker Finn has fittingly called “the little-known test that matters the most.” This first tranche will show us long-term trends for America’s nine-year-olds, giving us a snapshot of their academic progress and math and reading skills before and after the Covid pandemic. Later in the fall, we’ll get new reading and math scores for fourth and eighth graders nationwide, as well as broken down by state and twenty-six large urban school districts.

As these releases loom, it’s worth reflecting on recent, pre-pandemic trends, as well as how the United States compares to its competitors. This newsletter focuses on advanced education, kids reaching the high end of the achievement spectrum. Looking at these data can help us build a case for the success of these programs, be they gifted education or higher-level coursework—or gauge whether we need more of them.

We find both good and bad news. The good news is that, over the last decade, the U.S. was getting more students to the high end of achievement in fourth and eighth grade, especially in math. The bad news: There’s no progress in high school—and the U.S. lags behind far too many countries, sometimes by huge margins. We are, in other words, headed in the right direction, but there’s still a lot of work to be done, especially in the upper grades.

The case for advanced education is simple, has two parts, and is worth restating, for it demonstrates why efforts to better educate advanced learners are so important. The first argument is equity-based: Every student deserves educational experiences that help them reach their full potential. Some children, due to high achievement, ability, or potential, require something more than can be provided in the average classroom geared toward the average student. Schools should therefore offer distinctive and high-quality advanced programs and services for those who would benefit from them. Not to do so is an unacceptable form of discrimination.

The second argument is that the country needs these children to be highly educated to ensure its long-term competitiveness, security, and innovation. They’re the young people most apt to become tomorrow’s leaders, scientists, and inventors, and to solve our current and future critical challenges. Indeed, economists don’t agree on much, but almost all concur that a nation’s economic vitality depends heavily on the quality and productivity of its human capital and its capacity for innovation. While the cognitive skills of all citizens are important, that’s especially the case for high achievers. Using international test data, for example, economists Eric Hanushek and Ludger Woessmann estimate that a “10 percentage point increase in the share of top-performing students” within a country “is associated with 1.3 percentage points higher annual growth” of that country’s economy, as measured in per-capita GDP.

Back to math scores. Considerable research suggests that “math skills better predict future earners and other economic outcomes than other skills learned in high school.” Math also lends itself best to international comparisons because there is wide consensus about what students should learn in this subject, and because its concepts are the same regardless of the language of instruction. Math scores are therefore my focus here, particularly the percentage of students reaching the highest levels on national and international exams. (This is a different metric than one used in two recent analyses by the National Assessment Governing Board and my colleague Mike Petrilli, which show a divergence in the pre-pandemic decade between low and high achievers, using scale scores at the 10th, 25th, 75th, and 90th percentiles.)

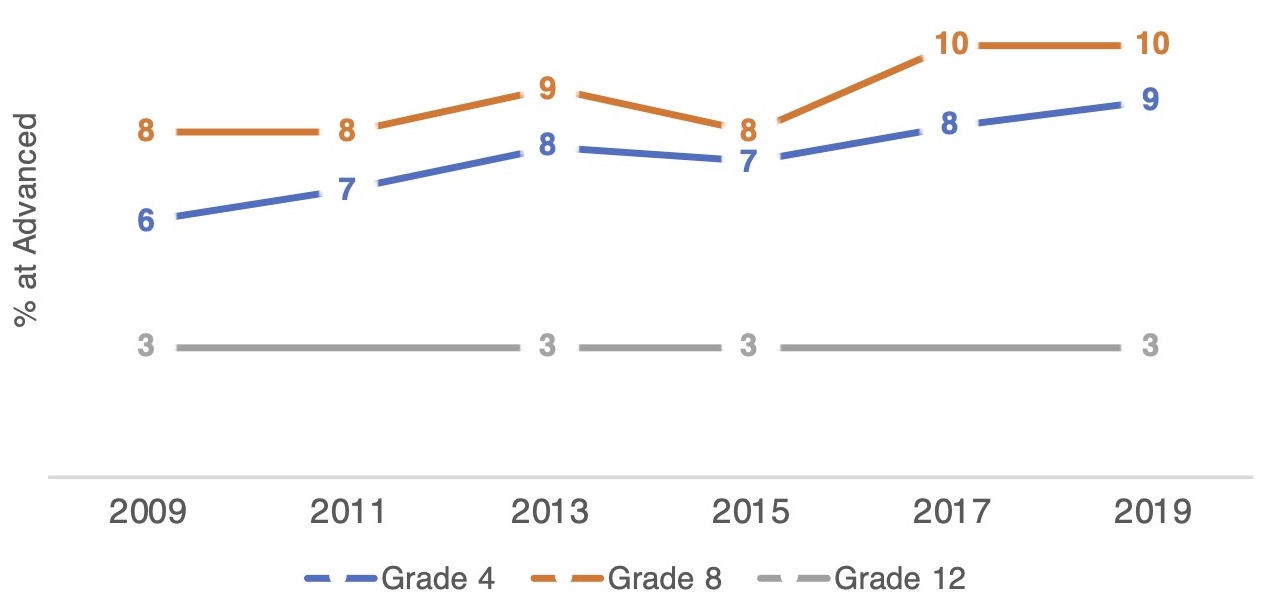
Figure 1 shows the percentage of students at or above “NAEP Advanced,” the test’s top achievement level, from 2009 to 2019 in grades four, eight, and twelve. The increases in the earlier grades are large, statistically significant, and encouraging, with grade four seeing a 50 percent jump, from 6 to 9 percent scoring at the Advanced level, and grade 8 rising 25 percent from 8 to 10 percent Advanced. (Reading also saw statistically significant rises in these grades during this time, but only by 1 percentage point.) Twelfth grade, however, is another story. Just 3 percent of test-takers reached NAEP’s top level in 2009—a figure that, sadly, didn’t change in 2013, 2015, or 2019.

Figure 1. Percentage of students at or above NAEP advanced level, by grade, 2009–19.
5

Turning to comparisons with other nations, it’s clear that the U.S. isn’t doing well at the upper end in relation to our competitor countries.

Consider, for instance, such well-known gauges as the OECD’s Program for International Student Assessment (PISA) and the Trends in International Mathematics and Science Study (TIMSS), in which dozens of countries participate. PISA tests fifteen-year-olds in math, science, and reading, and organizes its scores into seven levels, from 0 to 6, with high scorers generally being those who reach level 5 or 6. TIMMS assesses fourth and eighth graders in math and science and splits its scores into five levels, with a high achiever judged as one who reaches at least 625 on the relevant scales.

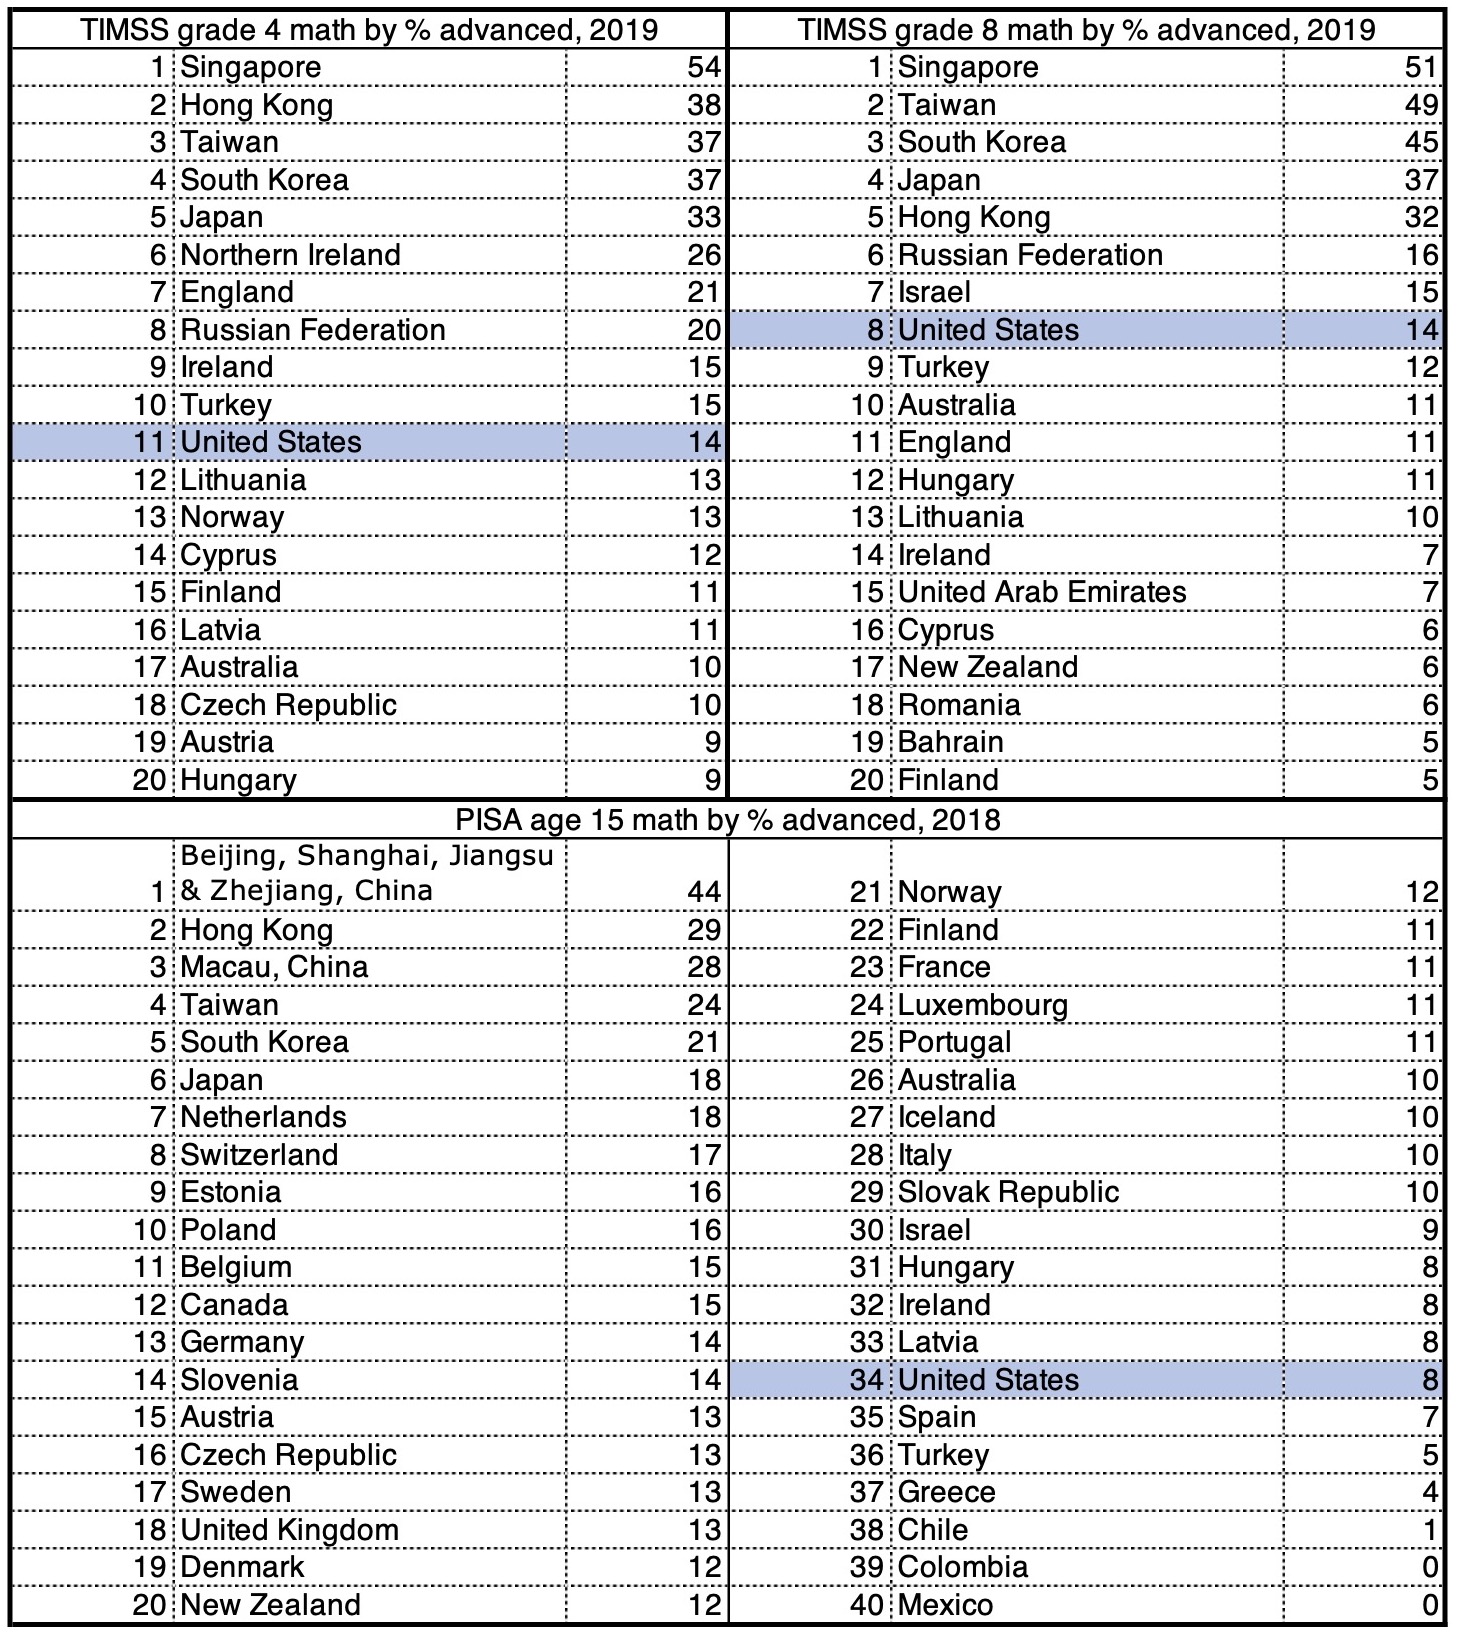
Using these cutoffs, Table 1 shows the percentage of advanced test-takers for a selection of top-scoring countries who participated in the most recent math assessments. It also shows how the United States compares.

Table 1. Percentage of students scoring at the advanced level in math on TIMSS 2019 and PISA 2018, by country
5

In the TIMSS results, we see the U.S. ranking eleventh in grade four and eighth in grade eight. In both, America landed behind Singapore, Taiwan, South Korea, Japan, Hong Kong, and Russia. Worse, the top-performing countries have two, three, and in the case of Singapore, almost four times the proportion of advanced students as does the U.S. The only silver lining is that many of these countries are small. America’s vast scale means that we have a decently large number of high achievers in raw numbers.

PISA paints an even worse picture for high-achieving high school students in the U.S., mirroring our dismal NAEP results for twelfth-graders. Rankings include all members of the OECD that took the assessment, plus Hong Kong, Macau, Taiwan, and a quartet of Chinese cities (Beijing, Shanghai, Jiangsu, and Zhejiang). That’s a total of forty jurisdictions. The United States comes in thirty-fourth, behind all participants in Asia and every participant in Europe except Spain, Turkey, and Greece.

But recall the good news: Over the last pre-pandemic decade, the U.S. was getting more of its students to the highest level of achievement in fourth and eighth grade math. And what Table 1 doesn’t show is trends. So here’s one that offers some hope: In 2019, 14 percent of U.S. eighth graders reached TIMSS’s top math level. Eight years earlier it was just 7 percent.

So perhaps this fall, when PISA next tests students around the globe, America’s rank will jump. Or not, considering America’s broad learning losses during the pandemic—losses that were exacerbated by, among other things, the country’s too-cautious approach to school closures, hybrid learning, and masking. “Over past two years,” reported the Economist earlier this year, “America’s children have missed more time in the classroom than those in most of the rich world.” So it’s possible, maybe even likely, that any comparative gains we’d made before Covid hit were erased by bad policy decisions at federal, state, and local levels.

Either way, all these data suggest that math learning for America’s advanced students was headed in the right direction before the pandemic. And perhaps, that the gifted programs that exist in 68 percent of U.S. primary and middle schools are doing something right. These are things to celebrate—at least guardedly, as we wait for new scores. What’s also clear is that there’s much work ahead, and that maintaining and accelerating advanced education in our schools in the best interest of America’s students, American prosperity, and American security.

—

QUOTE OF NOTE

“When we explore how exposure to tracking correlates with student mobility in the achievement distribution, we find positive effects on high-achieving students with no negative effects on low-achieving students...”

—Kate Antonovics, Sandra E. Black, Julie Berry Cullen, and Akiva Yonah Meiselman, “Patterns, Determinants, and Consequences of Ability Tracking: Evidence from Texas Public Schools,” National Bureau of Economic Research, Working Paper 30370, Abstract, August 2022

—

THREE RECENT STUDIES TO STUDY

“Patterns, Determinants, and Consequences of Ability Tracking: Evidence from Texas Public Schools,” by Kate Antonovics, Sandra E. Black, Julie Berry Cullen, and Akiva Yonah Meiselman, National Bureau of Economic Research, Working Paper 30370, August 2022

“We use detailed administrative data from Texas to estimate the extent of tracking within schools for grades 4 through 8 over the years 2011-2019. We find substantial tracking; tracking within schools overwhelms any sorting by ability that takes place across schools. The most important determinant of tracking is heterogeneity in student ability, and schools operationalize tracking through the classification of students into categories such as gifted and disabled and curricular differentiation... Finally, when we explore how exposure to tracking correlates with student mobility in the achievement distribution, we find positive effects on high-achieving students with no negative effects on low-achieving students….”

“Parenting with eyes wide open: Young gifted children, early entry and social isolation,” by Mimi Wellisch, Gifted Child International, Volume 37, Issue 1, 2021

“This case study outlines the challenges of eight Australian mothers with intellectually gifted preschoolers... It was found that early entry met the needs of children whose parents chose this acceleration option and that the preschoolers who missed out because of intervention by their educators did not fare so well. Findings also indicated an urgent need for the inclusion of compulsory early childhood giftedness courses for Australian pre-service educators and an equally urgent need for professional development courses about giftedness for educators already working in early childhood services.”

“Finding Talent Among Elementary English Learners: A Validity Study of the HOPE Teacher Rating Scale,” by Nielsen Pereira, Gifted Child Quarterly, Volume 65, Issue 2, 2021

“The purpose of this study was to investigate the validity of the HOPE Scale for identifying gifted English language learners (ELs) and how classroom and English as a second language (ESL) teacher HOPE Scale scores differ… Results also indicate that the rating patterns of classroom and ESL teachers were different and that the HOPE Scale does not yield valid data when used by ESL teachers. Caution is recommended when using the HOPE Scale and other teacher rating scales to compare ELs to EP students. The importance of invariance testing before using an instrument with a population that is different from the one(s) for which the instrument was developed is discussed.”

—

WRITING WORTH READING

“Gifted education and equity are not at odds,” Wall Street Journal, Ellen Winner, August 29, 2022

“Frisco ISD’s grading policies hurt high achievers like me,” Dallas Morning News, Vaishnavi Josyula, August 29, 2022

“Shakeup at Manhattan high school appeases affluent families whose kids didn’t get into elite schools, say parents,” New York Daily News, Michael Elsen-Rooney, August 29, 2022

“What national test scores tell us about American education before the pandemic,” Thomas B. Fordham Institute, Michael J. Petrilli, August 31, 2022

“Osceola [Florida] School District receives highly-competitive $2.6M grant for gifted studies among under-represented student segments,” Osceola News Gazette, Ken Jackson, August 28, 2022

“It’s never too early—or late—to identify gifted students,” K–12 Dive, Lauren Barack, August 17, 2022

“Gifted summer programs skew white and wealthy. Not Baltimore’s—and it’s free,” The 74, Asher Lehrer-Small August 17, 2022

“Philly public schools drop writing sample, add standardized tests back to selective admissions process,” WHYY, Aubri Juhasz, August 17, 2022


view

Educating young Americans for citizenship is our schools’ top job

Chester E. Finn, Jr.
9.1.2022
Flypaper

In the realm of elementary and secondary education, we so often focus on one or two trees instead of the forest. We go off and argue about the best way to teach reading, about which books belong in the school library, about whether everyone should take “college prep” courses, about how to teach race or evolution or climate change or even algebra. We fret about gifted kids and kids with disabilities, about teachers unions and school bus routes, about cafeteria food and parent engagement, about test scores and discipline codes.

Yes, there are lots of trees. But why is there a forest to begin with? It’s to develop tomorrow’s American citizens and prepare our young people for citizenship. Yet that profound and fundamental mission is so easy to forget, both because it’s so basic and because most of the time it’s not newsworthy like those hot-button issues mentioned above. Except, of course, when it gets tangled up in them.

We also sometimes err by thinking that the way schools prepare students for citizenship is simply by teaching them “civics.”

How and what to teach in civics (and history and—more broadly—social studies) is its own issue and one worth taking seriously and doing well. A handful of states—both red and blue—are doing so today, at least setting exemplary expectations for what their students should learn during the K–12 years. But getting this part of the curriculum right is just part of what goes into preparing citizens.

The rest of the curriculum matters, too. Although every American has a right and responsibility to participate in our democracy even if illiterate and innumerate, people will have more power and agency if they can read newspaper articles, possess the background to understand what they’re seeing on television and their screens, make sense of data graphs, have some grounding in science, and more.

Yet the formal curriculum itself—the whole curriculum—is just part of what schools need to get right if they’re to do as much as they can to form citizens. At least as important are the values, habits, principles, convictions, and patterns of behavior that kids acquire in school. Those don’t just come from classroom instruction. They also come from extracurricular activities, from playground time and basketball games, from how the principal handles misbehavior (and rewards good behavior), from the examples that teachers set through their own personal conduct, from whether the school climate is one of integrity and mutual respect or corner-cutting and suspicion. Are students’ rights and responsibilities taken seriously? Are parents taken seriously? I don’t go quite as far as the late Theodore Sizer—the Harvard education dean who decades ago handed me two graduate degrees—whose “Coalition of Essential Schools” wanted every participating school to “model democratic practices that involve all who are directly affected by the school.” But it’s clear to me that how schools function as organizations and the lessons in citizenship that they convey by example and precept are at least as consequential as what happens in civics class.

This is also what distinguishes great education from skills training and what differentiates the schools of a democracy from those of totalitarian regimes. We’re not just making kids learn things and obey orders. We’re turning them into tomorrow’s voters, neighbors, public servants, and community leaders.

If our schools do this well, they’ll have fulfilled their most vital responsibility. We know, of course, that even at their best they can’t do it all, that the citizens kids grow up to be are also shaped by family, community, media, and myriad institutions of civil society. But the schools’ part is indispensable, both in the formal curricular sense and in the types of communities that they model.

That’s all getting harder, to be sure, as today’s political divisions, racial tensions, and “culture wars” enter more forcefully into school governance, curricula, and operations. Autonomous schools of choice, including private and (most) charter schools, find it somewhat easier to navigate these turbulent waters because they’re not pummeled quite so hard by external pressures and politics (Sizer and his colleagues understood this). Yet district-operated schools, whether on purpose or incidentally, also convey values, habits, and precepts to their pupils. Those kids are far likelier to acquire key elements of good citizenship when their schools are intentional and consistent about what they’re conveying.

This naturally varies by community—and if it varies too much, it can widen rather than narrow the country’s divisions. I view the usual version of “local control of the schools” as a mixed blessing, but on the positive side, this form of governance adds flexibility and a degree of diversity to the enterprise such that the precepts and practices embodied in schools—including the district-operated kind—can to some extent reflect the values and priorities of the communities they serve.

Yes, it’s a balancing act. We recognize that some of the values and priorities conveyed by the schools of Portland, Oregon, say, or Brookline, Massachusetts, won’t be the same as what kids see and learn in Amarillo, Texas, or Knoxville, Tennessee. But all four communities are building Americans in their schools, and it’s important all four—and all the others—convey what it means to be an American and what it means to be an honest, truthful, tolerant, and engaged citizen.

At the Thomas B. Fordham Institute, we’ve delved into this in several ways. In the aftermath of the terrorist attacks of 9/11 and subsequently, we asked thinkers and leaders across the political spectrum to write about America and citizenship in ways that would help educators address these core topics. Over the years, we have evaluated states’ academic standards for teaching U.S. history and, more recently, civics, thereby conveying our judgment as to how well individual states are (or aren’t) setting their K–12 expectations, as well as our criteria for what those expectations should contain.

We’ve also addressed social and emotional learning and school discipline, two realms that intersect big time with the signals schools send and the examples they set for up-and-coming citizens.

It would be a fine thing if the information available to students and parents (and taxpayers and policymakers) about schools included their effectiveness on the citizen-prep front. It would also be great if states’ school-accountability systems incorporated this along with academics. Elements can be gleaned from civics tests, school-climate surveys, and the incidence (and handling) of discipline challenges. Bits may also be gathered from the media and certainly from the parent grapevine. Longitudinal studies—such as the propensity of their graduates to vote—can supply further clues. Yet much that we would like to know about schools’ impacts in this realm would require multi-year information about the life trajectories of those who once attended them. Even if we had such information, we’d need to remember that what young people take from school is only part of what molds the adults they become.

Yet to end where I began, the preparation of those young people for citizenship is the ultimate reason we send them to school in the first place. It’s not just to teach them the Three R’s, important as that is, or to expose them to chemistry or poetry or computer programming. We educate kids in many ways and for many reasons. But none matters more in the long run that their readiness to participate in sustaining the vitality and integrity of our democratic republic.

view

What happens when school leaders are allowed to abandon “step and lane” pay scales

Amber M. Northern, Ph.D.
9.1.2022
Flypaper

In 2013, the British government ended the use of “annual progression” pay scales for teachers. These were similar to U.S.-style “step and lane” models but were set at the national level across the pond. Instead, Whitehall mandated that all 20,000-plus state-funded schools in England and Wales introduce their own Performance Related Pay (PRP) scales.

The previous “main pay scale” took into account teacher experience and work location, and incorporated geographic adjustments intended to compensate for the higher cost of living around London. The new arrangement did not alter school-level funding, which meant that, within their existing budgets, school leaders could now choose to change the average teacher pay and/or vary pay across teachers within the school. A recent study from the Economics of Education Review examines how this reform, which impacted nearly half a million teachers, affected multiple outcomes, including teacher pay progression, recruitment, and retention, as well as student performance.

The analysts use a difference-in-differences model with school and year fixed effects. They compare the pre-reform mean hourly wage of the particular labor market where the school is located against the reality of post-reform wages. In other words, the counterfactual is the expected annual level of pay growth based on what educators would have gotten under the old scale system. They also aggregate these data to create school-level measures of average deviation from expected pay growth.

Now to the results. First, the analysts find that the reform leads teacher salaries to grow faster in tighter labor markets. Post reform, there’s an immediate slackening of teacher pay growth across all districts, but the decrease is smallest in labor markets with higher outside wages—meaning places where competition for labor is the highest. Second, despite having the flexibility to reward teachers differently based on individual performance, within-school variance in teacher pay growth was no higher than in the pre-reform years, suggesting that any changes in teacher wage growth were applied to all staff equally. Schools tended not to hire new teachers but to use the funds to augment the salaries of existing ones. Evidence also showed little connection between the new policy and teacher retention and recruitment.

Evidence also indicates little connection between the new policy and teacher retention and recruitment.

Removal of the national pay scales led to some teacher groups receiving greater or smaller pay increases. For instance, teachers with longer tenure at a school experienced higher pay growth, as did males (0.38 percentage point higher than females). And although STEM teachers who were more in demand did not see a difference, Black secondary teachers did—having gained 0.57 percentage points in pay growth after the reform.

The bottom line is that the flexibility afforded to school leaders in England did not, ultimately, lead to real performance-based pay. While summaries of the research on performance-based pay are positive overall—as long as policies are designed carefully—a larger issue is that principals are hard pressed (or disinclined) to differentially evaluate teachers, tending to give them all fairly high marks. Leaders are likely not clamoring to downgrade evaluations of their teachers if they are not able to let them go next year anyway (thanks in part to power-hungry unions). And it’s hard to justify performance-based pay when one of the measures you use to do so says that everyone is performing similarly.

This study reiterates the difficult position in which school leaders find themselves, as both teachers’ biggest supporters and judicious evaluators. Future efforts to create a true performance-based pay scenario must reckon with this reality.

SOURCE: Simon Burgess, Ellen Greaves, and Richard Murphy, “Deregulating Teacher Labor Markets,” Economics of Education Review (March 2022).

view
iStock/Getty Images Plus/Moussa81

Education Gadfly Show #835: The expanding partisan gap on K-12 education

8.30.2022
Podcast


On this week’s Education Gadfly Show podcast, David Houston, assistant professor at George Mason University and survey director of the Education Next Poll, joins Mike Petrilli and David Griffith to discuss the relationship between political partisanship and public opinion on education issues. Then, on the Research Minute, Amber Northern reviews a study on the impact of the Broad Superintendents Academy, a program that trains non-educators to lead urban school systems.

Recommended content: 

  • David Houston’s co-authored Education Next article with Paul E. Peterson and Martin R. West: “Partisan Rifts Widen, Perceptions of School Quality Decline” (August 2022) 
  • The study that Amber reviewed on the Research Minute: Thomas S. Dee , Susanna Loeb, and Ying Shi., “Public-Sector Leadership and Philanthropy: The Case of Broad Superintendents,” Educational Evaluation and Policy Analysis, (August 2022)

Feedback Welcome!

  • Have ideas on our podcast? Send them to our podcast producers Nathaniel Grossman and Lilly Sibel at [email protected] and [email protected]
view

Cheers and Jeers: September 1, 2022

The Education Gadfly
9.1.2022
Flypaper

Cheers

  • A new CREDO study of San Antonio public schools found that English-language learners who attended charters received the equivalent of 95 extra days in reading instruction than their peers in traditional public schools. —The 74
  • This year, sixty high schools across the nation are piloting the College Board’s new course in Advanced Placement African American Studies. —Time
  • Surrounded by cheering teachers, students at Pacific Rim Public Charter School in Massachusetts joyfully strut down a red carpet each year on the first day of school. —Boston.com

Jeers

  • Pandemic-era restrictions on schools led to declining graduation rates in at least thirty-one states, with low-income students and students with disabilities suffering the largest declines. —Education Week
view

What we're reading this week: September 1, 2022

The Education Gadfly
9.1.2022
Flypaper
  • To prevent Covid-era learning losses from becoming permanent, we need schools to retain and reward their most effective teachers while dismissing their least effective ones. —Erik Hanushek
  • Insisting that an exam is inherently racist due to disparate outcomes is a crude oversimplification that ignores the realities of class background. —John McWhorter
  • Alberto Carvalho—L.A. Unified School District’s new superintendent—should draw inspiration from the district’s previous two decades of improvement when facing the challenges ahead. —Jay Mathews
  • Nineteen of the thirty candidates for local school boards endorsed by Florida Governor Ron DeSantis won their elections—some of whom ran in liberal districts like Miami-Dade. —The 74
Fordham Logo

© 2026 The Thomas B. Fordham Institute
Privacy Policy
Usage Agreement

National

P.O. Box 110
Burke, VA 22009

202.223.5452

[email protected]

Ohio

P.O. Box 82291
Columbus, OH 43202

614.223.1580

[email protected]

Sponsorship

130 West Second Street, Suite 410
Dayton, Ohio 45402

937.227.3368

[email protected]