Mobile Navigation

  • National
    • Policy
      • High Expectations
      • Quality Choices
      • Personalized Pathways
    • Research
    • Commentary
      • Gadfly Newsletter
      • Flypaper Blog
    • Events
    • Scholars Program
  • Ohio
    • Policy
      • Priorities
      • Media & Testimony
    • Research
    • Commentary
      • Ohio Education Gadfly Biweekly
      • Ohio Gadfly Daily
  • Charter Authorizing
    • Application
    • Sponsored Schools
    • Resources
  • About
    • Mission
    • Board
    • Staff
    • Career
Home
Home
Advancing Educational Excellence

Main Navigation

  • National
  • Ohio
  • Charter Authorizing
  • About

National Menu

  • Topics
    • Accountability & Testing
    • Advanced Education
    • Career & Technical Education
    • Charter Schools
    • Curriculum & Instruction
    • ESSA
    • Evidence-Based Learning
    • Facilities
    • Governance
    • Personalized Learning
    • Private School Choice
    • School Finance
    • Standards
    • Teachers & School Leaders
    • Think Again
  • Research
  • Commentary
    • Gadfly Newsletter
    • Flypaper Blog
    • Gadfly Podcast
  • Events
  • Scholars Program

The Education Gadfly Weekly

Sign Up to Receive Fordham Updates

We'll send you quality research, commentary, analysis, and news on the education issues you care about.
Thank you for signing up!
Please check your email to confirm the subscription.

The Education Gadfly Weekly: A hypothesis: NCLB-era achievement gains stemmed largely from declining child poverty rates

Volume 19, Number 27
7.10.2019
7.10.2019

The Education Gadfly Weekly: A hypothesis: NCLB-era achievement gains stemmed largely from declining child poverty rates

Volume 19, Number 27
view

A hypothesis: NCLB-era achievement gains stemmed largely from declining child poverty rates

There’s a strong relationship between a child’s socioeconomic status and his or her academic outcomes, so it stands to reason that improved economic conditions for lots of children should be associated with achievement gains. And indeed, that’s precisely what we saw in the decades before the Great Recession struck. But are those two trends linked?

Michael J. Petrilli 7.10.2019
NationalFlypaper

A hypothesis: NCLB-era achievement gains stemmed largely from declining child poverty rates

Michael J. Petrilli
7.10.2019
Flypaper

Public attitudes toward gifted education: Supportive, complacent, incomplete

Chester E. Finn, Jr.
7.10.2019
Flypaper

In Chicago, a new early-warning indicator for elementary schools

Dale Chu
7.10.2019
Flypaper

How to help students think critically

Robert Pondiscio
7.10.2019
Flypaper

Little rhyme or reason in special needs designations for students

Jeff Murray
7.10.2019
Flypaper

The Education Gadfly Show: While the Democratic candidates debate the past, the future of education policy is in the hands of the states

7.10.2019
Podcast
view

Public attitudes toward gifted education: Supportive, complacent, incomplete

Chester E. Finn, Jr. 7.10.2019
Flypaper
view

In Chicago, a new early-warning indicator for elementary schools

Dale Chu 7.10.2019
Flypaper
view

How to help students think critically

Robert Pondiscio 7.10.2019
Flypaper
view

Little rhyme or reason in special needs designations for students

Jeff Murray 7.10.2019
Flypaper
view

The Education Gadfly Show: While the Democratic candidates debate the past, the future of education policy is in the hands of the states

Michael J. Petrilli, Adam Tyner, Ph.D., Marc Porter Magee 7.10.2019
Podcast
view

A hypothesis: NCLB-era achievement gains stemmed largely from declining child poverty rates

Michael J. Petrilli
7.10.2019
Flypaper

Editor’s note: This is the fourth in a series of posts looking at whether the nation’s schools have improved over the past quarter-century or so—what might be considered the modern “reform era” of American education. The first two posts demonstrated that student outcomes rose significantly from the mid-1990s until the Great Recession—especially in reading and math, but in other academic subjects, too. The greatest progress came for the lowest-performing students and children of color. The third post argued that this educational progress coincided with dramatically improving conditions for our poorest families. In particular, the “supplemental poverty rate” plummeted for children of color in the 1990s and into the 2000s, along with crime and teenage pregnancy rates.

It’s long been understood that, on average, there’s a strong relationship between a child’s socioeconomic status and his or her academic outcomes. It’s also the case that when poor families become less poor—either because of more “market income” or due to social programs like the Earned Income Tax Credit—their children tend to do better in school. That’s not surprising, given that kids only spend approximately 9 percent of their first eighteen years of life in school. So it stands to reason that improved economic conditions for lots of children should be associated with improved results on achievement tests. Is that what we were seeing before the Great Recession struck?

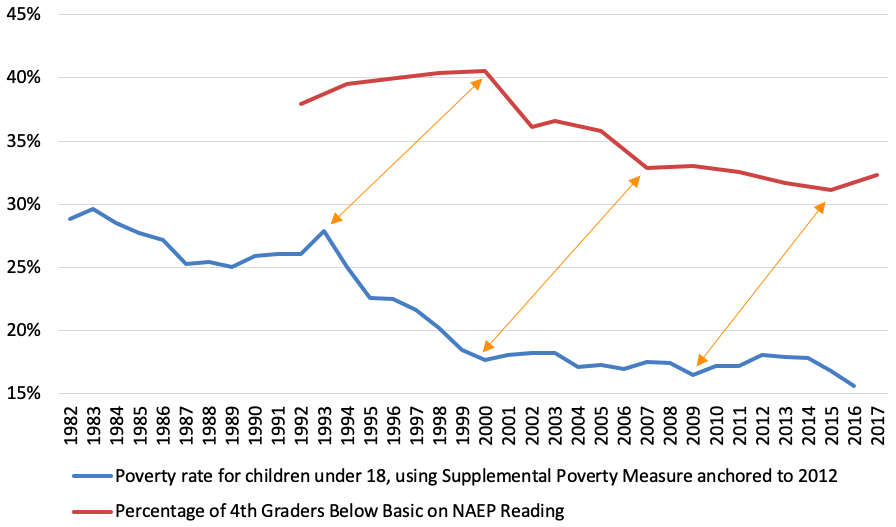
To find out, we’ll start by charting the supplemental child poverty rate against the “below basic rate” for the fourth-grade National Assessment of Educational Progress (NAEP) in reading. Both measures are dichotomous—you’re either above or below the line in each case. And we want both of these rates to decline over time.

Helping families escape poverty is not the only goal we might have for social policy. We’d also love to see significant upward mobility into the middle class and beyond. Likewise, moving students to NAEP basic isn’t nearly enough if we want children to be on track for college and career. “Proficiency” is still the gold standard.

But let’s not allow our desire for the gold to blind us to some worthy bronze. Reducing the child poverty and below-basic rates is an important milestone on the way to bigger and bolder goals.

Without further ado, let’s take a look.

Figure 1. The “below basic in fourth grade reading rate” versus the supplemental child poverty rate
mp 11

What immediately jumps out from this picture are the similar inflection points in both lines—with changes in the “below basic” rate lagging changes in the child poverty rate by about seven years. From 1993 until 2000, the supplemental child poverty rate declined from 28 percent to 18 percent—a 10-point drop, or 36 percent reduction. From 2000 until 2007, the percentage of fourth graders reading below basic on NAEP declined from 41 percent to 33 percent—an 8-point fall, or 20 percent reduction. The supplemental child poverty rate hit an all-time low in 2009, before ticking up in 2010. And the below-basic rate hit an all-time low in 2015, before ticking up in 2017.

Interesting.

To be sure, the pattern isn’t perfect. Most notably, child poverty declined in the 1980s, and yet reading performance in the early 1990s got worse. (Perhaps because of the whole-language craze?) But over the past twenty years, the two lines appear to be moving generally in the same direction.

Now let’s see how it looks for eighth graders.

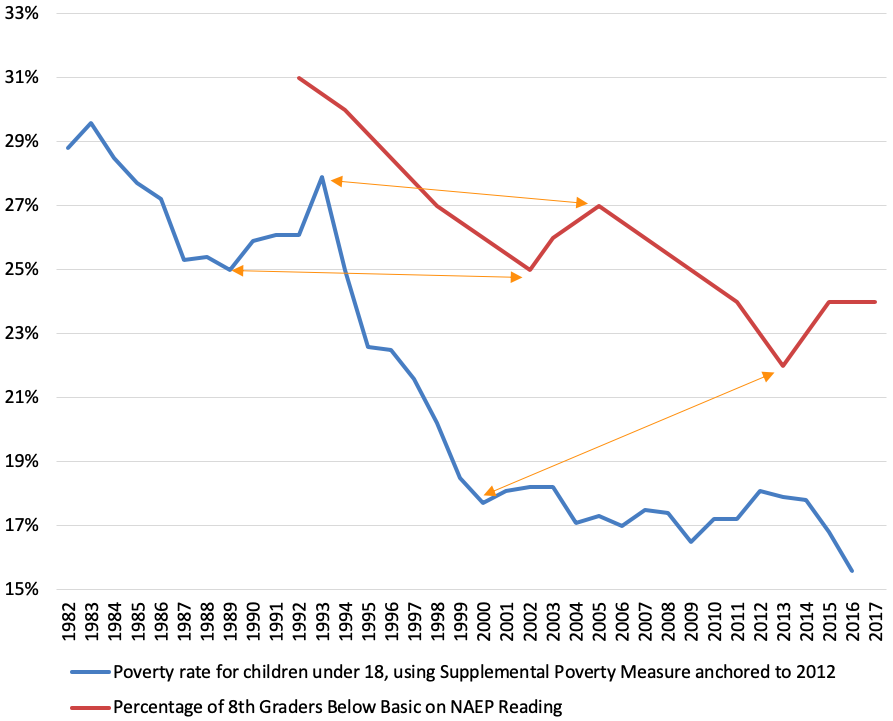
Figure 2. Percentage of eighth graders below basic on NAEP reading, supplemental child poverty rate
mp 2

This time, changes in the below-basic rate lags changes in the child poverty rate by about thirteen years.

After declining for most of the 1980s, the supplemental child poverty rate started to rise in 1989 with the onset of a recession, and hit a peak in 1993 before plummeting throughout the remainder of the 1990s. A similar pattern is seen with the rate of eight graders reading at a below-basic level—but thirteen years later. This rate declined throughout the 1990s. Then in 2002 it started to rise, thirteen years after 1989. Three years later, in 2005, it started declining again, twelve years after 1994.

The same pattern can be seen in later years, as child poverty rose slightly with the weakening economy in 2000. Thirteen years later, the below-basic rate rose, too.

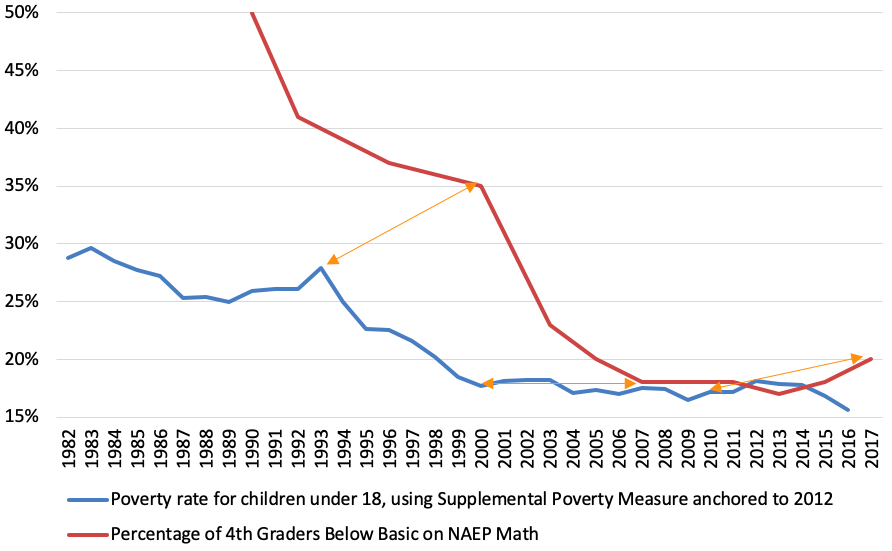
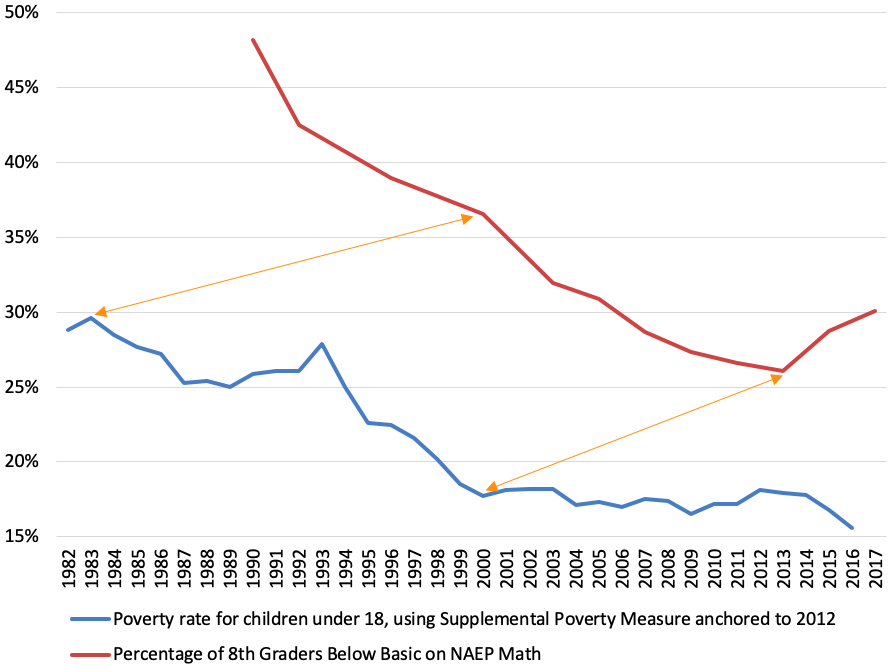
And it’s not just in reading. We can glimpse similar patterns in math.

Figure 3. percentage of fourth graders scoring below basic on NAEP math, supplemental child poverty rate
mp 3

Figure 4. Percentage of eighth graders below basic on NAEP math, supplemental child poverty rate
mp 4

***

Now is a good time for me to issue a disclaimer: I may just be a policy wonk instead of a trained social scientist, but even I know that correlations between a few lines don’t count as solid evidence that the falling child poverty rate drove improvements in student achievement. But it sure seems that there might be a relationship at work—namely that the prevailing economic conditions at the time of a cohort of children’s birth (or shortly thereafter) appear to be related to the cohort’s later achievement—at least at NAEP’s below-basic level.

Again, this is speculative. I would love for a scholar with econometric chops to dig into the question of how much of the progress in student achievement can be explained by the improving economic conditions for poor kids and their families, and how much credit should go to schools and various efforts to reform them. My hunch is that the declining child poverty rate deserves some, perhaps much, of the praise. It would surely vary by subject, grade, and time period—and might help us understand when and how our schools outperformed what we’d expect given socioeconomic conditions. To my friends in academia: Please help!

***

I can imagine that my hypothesis—that the big achievement gains of the late 1990s and early 2000s mostly shouldn’t be credited to schools or school reform—will be depressing to my colleagues in the reform movement. I can also picture some reform opponents cheering these arguments, given that they have long pointed out that test scores are strongly correlated with socioeconomics, and that reformers have been ignoring reality when we argue that schools should and could be getting much better results.

But my posts in coming weeks are likely to further complicate this narrative. I will argue:

  • That there’s strong evidence that changes in policy deserve some credit for improved achievement too—especially the advent of school accountability systems.
  • That if improving socioeconomic conditions largely explain the improving test scores of the late 1990s and early 2000s, then declining socioeconomic conditions during and after the Great Recession may largely explain the “Lost Decade of Educational Progress.”
  • That while socioeconomic trends might be the major drivers of achievement trends at the national level (with the accent on “might”), there has been significant variance at the state level. And—spoiler alert—the most reform-minded states are among those that have beaten the socioeconomic curve.

There’s much more to cover. Stay tuned!

view

Public attitudes toward gifted education: Supportive, complacent, incomplete

Chester E. Finn, Jr.
7.10.2019
Flypaper

The Institute for Educational Advancement recently completed an elaborate survey of public views toward many aspects of the education of gifted children and the results are enlightening, sobering—and complicated. Authored by Institute president Betsy Jones and Institute fellow Shelagh Gallagher, the report is aimed partly at advocates within the field of gifted-and-talented education, as a substantial portion of it is devoted to “market testing” various terms and phrases to determine which resonate best with which audiences and constituencies as well as the type of “messaging” that seems most effective in building public support for programs of this sort. (The rather surprising winner: “Money for prisons, not for gifted.”)

Broadly speaking, Americans are supportive of gifted education, would like to see it better resourced, would like to see teachers better prepared to do it well, and understand the importance of democratizing it by ensuring that more poor and minority youngsters get identified as gifted and given additional education services. That doesn’t mean sweeping everyone in, however, as three-quarters of respondents believe that giftedness is “rare”—but two-thirds believe that gifted students need special programs, not that they’ll do fine anyway because they’re smart.

Note, however, that Americans tend to think that just about every discernible group or category deserves special programs and services—and that just about every aspect of education needs more resources, greater equity, better teachers, etc. What’s most sobering in the new survey is the revelation that most people think gifted education is already in pretty good shape: 56 percent of respondents give public schools an honors grade for addressing the needs of gifted students—and just 15 percent give D’s or F’s. This is in sharp contrast with American’s view of public education generally, which—as we learn from this survey as well as endless Kappan and Education Next surveys—is quite bleak.

Which is to say that, notwithstanding the impulse to direct additional resources into gifted education and to encompass a wider range of kids within it, there’s widespread complacency about the enterprise in its present form.

Which may have something to do with its formlessness. Gifted education in the U.S. has two abiding problems. One is how to define and identify “gifted” students—every state with a definition or mandate has a different one, ranging from exceptionally high scores on some test to a version of “everyone is gifted in some way.” The other quandary is what, exactly, to do for those who get identified, i.e., how to “serve” them, with the dizzying array of current offerings ringing from a bit of after-school supplementation to entirely separate schools. In short, there’s no agreement on who’s gifted, what exactly “gifted education” is, or how it should be done.

The IEA survey tested three specific examples and found general support for two: acceleration of gifted students, “whether by grade skipping, ability grouping or through other means…rather than remaining in a lock-stepped, age-based grade progression,” and “creating a quality online school for gifted” students, whatever exactly that might mean. What did not get majority support is “creating a quality separate school for gifted” pupils, i.e., “exam schools” and suchlike. That one drew more strong supporters than strong opponents (16 percent versus 11) but narrowly missed overall majority support.

Acceleration, yes. Tracking, okay. Online learning, fine. Resources, teachers, and equitable identification, sure. But completely separate schools, not so much.

Unstated in this report, and apparently unasked in the survey, is the problem of leadership in the realm of gifted education. Just about every other element, faction and interest group within American K–12 education musters large, strongly-led, and well-funded advocacy organizations—often membership-based, often supported by philanthropy—that agitate, advocate, hire lobbyists, contribute to election campaigns, and generally make noise on behalf of their cause and in opposition to laws, regulations, policies, and practices that they believe would harm it. Most also have champions and defenders occupying elective offices, usually at both state and national levels.

Gifted education, by comparison, is limp, struggling, and low visibility. (In my experience, its weakness in advocacy is matched only by education research!) It has few influential champions, save for a handful of superintendents and local board members. Its lobbying efforts are rarely more than a single part-time spokesperson trying to buttonhole people in the statehouse. It is all but ignored by philanthropy (with a couple of honorable exceptions such as the Jack Kent Cooke and Lynde & Harry Bradley Foundations). And its membership organizations are small, low-budget, thinly-staffed outfits that do little more than newsletters and annual meetings for their own members. The biggest of them, the National Association for Gifted Children, has suffered from leadership turnover.

Formless. Leaderless. Those aren’t problems that any survey can solve or really even do much to illuminate. But they’re clear and present problems for gifted education. Still and all, there’s much of value in this survey, and IEA deserves kudos for conducting it and sharing its revelations.

view

In Chicago, a new early-warning indicator for elementary schools

Dale Chu
7.10.2019
Flypaper

At its first meeting last month after a changing of the guard, the Chicago Board of Education approved changes to the School Quality Ratings Policy (SQRP), the district’s accountability system. In place since 2014, the SQRP rates district and charter schools on a five-point scale (“1+” is the highest and “3” is the lowest) using a weighted system that considers a range of academic and non-academic factors. Notable among the changes is the addition of a “3–8 On-Track” measure for elementary schools—which are K–8 in Chicago—based on grade point average (GPA) and attendance.

Early-warning-indicator and intervention systems date back almost thirty years, and have primarily focused on high schools. The impetus behind these systems was dropout prevention. Two seminal reports, On Track for Success and High School Graduation and College Readiness Indicator Systems, have informed the current efforts to develop and refine early-warning systems, with Chicago at the forefront. While the specific measures used may vary, what they often have in common is collectively known as the “ABCs”—attendance, behavior, and course performance—or “BAG” (behavior, attendance, and grades).

There are many reasons for schools and districts to employ early-warning systems as part of their accountability frameworks. For starters, research suggests that high school GPA is more predictive of college success than demographics or test scores. As the Urban Institute’s Matthew Chingos notes, “This makes sense given that earning good grades requires consistent behaviors over time—showing up to class and participating, turning in assignments, taking quizzes, etc.—whereas students could in theory do well on a test even if they do not have the motivation and perseverance needed to achieve good grades.”

If you listen to education practitioners, they’ll often tell you how a high school’s graduation rate is foreseeable as early as kindergarten. To wit, a student who isn’t proficient in reading by third grade is four times less likely to graduate high school. Add the effects of poverty into the mix, and a poor struggling reader is thirteen times less likely. It’s no wonder that districts like Chicago are mining such predictive risk factors in the hopes of preempting the ailments of high school when intervention is often too little too late.

Chicago’s 3–8 On-Track measure smartly aims to apply the lessons learned from the freshman on-track indicator to the elementary level, but it wouldn’t be the first foray into the early grades. Six years ago, Montgomery County Public Schools—located outside of Washington, D.C.—published an illuminating study on their exploration of early-warning indicators. Among the many interesting findings was that a first grader below grade level in reading or math was twice as likely to drop out of high school. A student suspended in first grade was five times more likely. However, it’s worth noting that results like these are often contextually dependent, and that Chicago’s new elementary indicator doesn’t include student behavior.

Prior research in Philadelphia found that behavior infractions in middle school were related to later high school dropout, but this has not been the case in Chicago. This could be due to differences or a lack of consistency in discipline practices between the two cities. More research is needed on the use of behavior data as an early-warning indicator. While the evidence around attendance and grades is strong, the predictive strength of behavior data is less certain at present.

But regardless of whether behavior is factored in, Chicago has been using 3–8 On-Track informally for some time, so their decision to formally include it as part of the SQRP is a promising development that should be worth watching. In addition, with Illinois’s decision to drop out of PARCC, locally developed accountability systems like the SQRP could gain additional prominence as a more consistent measure over time.

This fall, the new elementary indicator will be worth 10 percent of a school’s rating. This feels like a reasonable place to start, though the district would be wise to keep their eyes peeled for the possibility of grade inflation. Simply raising grades won’t help a student’s preparation for high school, so more standardized measures might be considered as a useful check. For example, the state’s efforts to better align their current slate of assessments could be leveraged in the near future.

As Chicago moves forward with the latest iteration of SQRP, it will be interesting to examine the impact of the 3–8 On-Track indicator on high school success, and whether any effects persist or fade over time. With more states easing off on accountability, the best hope for innovation (i.e., broadening the scope beyond standardized tests without diluting a system’s rigor) may very well rest on the shoulders of district leaders. Bravo then, Chicago, for leading the way in the hopes of forestalling failure early enough that interventions can actually make a difference.

view

How to help students think critically

Robert Pondiscio
7.10.2019
Flypaper

Consensus is rare in education, but if there’s broad agreement on anything pertaining to schooling, it’s on the need for students to develop critical thinking ability. But that’s where the consensus ends. Some perceive critical thinking as a content-neutral, generic skill that can be taught, practiced, and mastered in the abstract. Others insist that critical thinking can’t be taught at all, and that it’s a function of content mastery: The architect can think critically and solve problems in architecture; the master gardener can think critically about horticulture. Neither has a well-developed critical thinking muscle that is of any use in solving the other’s problems. Wading into the debate is Dan Willingham, the peerless University of Virginia cognitive scientist, with a brisk and readable new paper commissioned by the New South Wales (Australia) Department of Education. It should go right to the top of every educator’s summer reading list.

Willingham offers what he calls a “commonsensical view” of critical thinking. “You are thinking critically if (1) your thinking is novel—that is, you aren’t simply drawing a conclusion from a memory of a previous situation and (2) your thinking is self-directed—that is, you are not merely executing instructions given by someone else and (3) your thinking is effective—that is, you respect certain conventions that make thinking more likely to yield useful conclusions.” Those conventions might include things like considering both sides of an issue and not allowing emotion to cloud reason.

There is evidence that critical thinking can be taught, and Willingham cites several examples in fields as disparate as psychology and naval warfare. But when you teach students to evaluate an argument in a newspaper editorial, he notes, the hope is that they will learn to evaluate arguments generally. “This aspect of critical thinking is called transfer,” Willingham says, and here things get murky and the evidence mixed. “For educators, one fact ought to be salient. We are not even sure the general skills exist, but we are quite sure there is no proven way to teach them directly,” he writes. “In contrast, we have a pretty good idea of how to teach students the more specific critical thinking skills. I suggest we do so.”

He offers practical steps—not simple or facile ones—that start with identifying specifically what is meant by critical thinking in each subject area or domain. “It is not useful to set a goal that students ‘think like historians,’” he notes, deftly dispensing with the oft-repeated education homily. “If students are to read as historians do, they need to learn specific skills like interpreting documents in light of their sources, corroborating them, and putting them in historical context.” Crucially, those are not the same suite of skills that allow someone to “think like a scientist.” Domain knowledge is a driver of thinking skills so it’s essential to identify the specific content that students must know. Of course, that’s a minefield that most of us prefer to avoid (and surely one of the reasons we prefer to elevate “thinking skills” over specific content in the first place). “But not choosing is still making a choice,” Willingham sagely points out. “It is choosing not to plan, and to let random forces determine what students learn.” Likewise, we need to establish the sequence in which skills are taught and knowledge introduced. “We interpret new information in light of what we already know. The right preparation makes new learning easier,” Willingham observes. Finally, time must be allocated to revisit key skills across a number of years. This revisiting “should be assured and planned.”

So it’s not true that critical thinking can’t be taught, but neither is it the case that we can dispense with hard decisions about what to teach, or to dismiss the need for deep domain knowledge. “Experimental evidence shows that an expert does not think as well outside her area of expertise, even in a closely related domain.” Willingham explains. “She is still better than a novice, but her skills do not transfer completely.”

In sum, Willingham dispenses with the idea that critical thinking can’t be taught, but this brisk yet comprehensive paper offers no comfort to those searching for shortcuts and workarounds, a critical thinking Northwest Passage to get us quickly to the destination. “The way the mind works, shallow is what you get first. Deep, critical thinking is hard-won,” Willingham concludes. “Patience will be a key ingredient in any program that succeeds.”

SOURCE: Daniel T. Willingham, “How to Teach Critical Thinking,” New South Wales Department of Education (2019).

view

Little rhyme or reason in special needs designations for students

Jeff Murray
7.10.2019
Flypaper

A designation of special needs for a K–12 student can generate a sigh of relief from some parents and a howl of outrage from others. Such a designation can also be the basis of a successful outcome for some students and the beginning of a long struggle for others to attain proper supports. A recent study published in the journal Society and Mental Health attempts to locate the source of variability in special needs designations as a basis for untangling these divergent scenarios.

Authors Dara Shifrer of Portland State University and Rachel Fish of New York University use the term “designation” rather than “diagnosis” deliberately. While most students’ special needs designations are given by a medical professional (school nurse, psychologist, neurologist, family doctor, etc.), research suggests there is also a non-medical component due to the “inextricable involvement” of teachers, parents, principals, and counselors in detection and referral. While medical diagnoses are precise and scientific (learning disabilities, ADHD, physical handicap, autism, and intellectual disabilities), school districts’ special needs categorizations are far less precise and can fall into subjective areas such as behavioral problems and lack of self-regulation. Shifrer and Fish are interested in teasing out ways in which school-based factors—non-medical subjectivity—can lead to inconsistencies in special needs designation between otherwise similar students. 

The study examines yearly data collected by the school district and state education agency on 378,919 children in grades pre-kindergarten through twelve in an unnamed “large urban district in the southwestern United States” between 2006–07 and 2011–12. Students in the study were those with only one category of special needs diagnosis; those with multiple designation were excluded, as were students who moved in and out of the district so much as to disrupt data collection. The final N-size was 346,957 students, of whom approximately 80 percent were economically disadvantaged. Sixty percent of students were Hispanic, 25 percent were black, and 30 percent English language learners (ELLs). The teaching population was similarly diverse, about 25 percent of teachers were white, 40 percent black, and 25 percent Hispanic.

The topline finding is probably not surprising. Shifrer and Fish found a huge amount of variability in special needs designation among otherwise similar students. By controlling for a number of school level variables, they were able to dig down and differentiate children’s likelihood of designation based on some specific factors. For example, the likelihood of designation was higher in schools with more resources—such as smaller class sizes and a student population of relatively higher socioeconomic status—and in schools of choice. Additionally, findings suggested that children’s likelihood of designation may also be higher if they are distinctive relative to other students in their school along certain dimensions such as race or ELL status. In other words, two similar ELL students in different schools face a differing likelihood of special needs designation based on how many other ELLs are in their respective buildings. And those differences were not always predictable. While low achievers, black students, and ELLs were all more likely to be designated as special needs students in schools where they were distinctive in these traits from their peers, the opposite was true of Hispanic students.

Shifrer and Fish conclude that teachers and counselors may be interpreting similar “symptoms” differently depending on the context, and they may be responding to those symptoms differently as well. Singling out the “different” kids in a school or classroom for special needs designation is just as troubling as ignoring the real needs of students so as to avoid singling them out.

Recent news reports that too many students are being designated in some states and too few in others, along with ongoing stories of inadequate provision of services press home just how important it is that all the adults involved in special education get this right. Shifrer and Fish’s research indicates that the basis for designation—and thus for provision of services—is likely built on shaky ground.

SOURCE: Dara Shifrer and Rachel Fish. “Contextual Reliability in the Designation of Cognitive Health Conditions among U.S. Children,” Society and Mental Health (May 2019).

view

The Education Gadfly Show: While the Democratic candidates debate the past, the future of education policy is in the hands of the states

7.10.2019
Podcast
 

On this week’s podcast, Marc Porter Magee, CEO and founder of 50CAN, joins Mike Petrilli to discuss last month’s presidential debates, and the busy legislative sessions recently concluded in many states. On the Research Minute, Adam Tyner examines how socioeconomic status affects students’ growth mindsets.

Amber’s Research Minute

Mesmin Destin et al., “Do Student Mindsets Differ by Socioeconomic Status and Explain Disparities in Academic Achievement in the United States?” AERA Open (July 2019).

Fordham Logo

© 2026 The Thomas B. Fordham Institute
Privacy Policy
Usage Agreement

National

P.O. Box 110
Burke, VA 22009

202.223.5452

[email protected]

Ohio

P.O. Box 82291
Columbus, OH 43202

614.223.1580

[email protected]

Sponsorship

130 West Second Street, Suite 410
Dayton, Ohio 45402

937.227.3368

[email protected]