- Fifty years of data on gifted youth finds that, contrary to some assumptions, achieving success later in life doesn’t cause unhappiness. —Wall Street Journal
- A study arguing that video games make kids smarter is flawed in its methods and conclusions, and it reveals the limitations of data in answering certain questions. —Emily Oster
- Children of immigrants are more likely to move to areas with strong job growth, which helps them climb the economic ladder. —New York Times
- Across the globe, Covid learning loss is a disaster, especially for literacy in developing countries. —The Economist
- A new EdReports review is examining whether interim tests provide the high-quality, reliable information they claim to provide. —EdWeek Market Brief
- I’m not sure whether the voucher haters suing the state of Ohio over the EdChoice Scholarship Program had been waiting on a critical mass of cranky-yet-gullible school districts to
pay up forjoin their pathetic band, but hot on the heels of the elected board of Toledo City Schools ponying up, we appear to have some very tiny little movement in the case this week. You will no doubt have noted in this clip that the leader of the voucher haters spouted off against charter schools as well. Charters are not part of the lawsuit but that scattershot rhetoric is yet another example of school choice hatred so white hot that all logic and coherence goes out the window when a willing ear is available to them. (Statehouse News Bureau, 7/11/22) This piece on how Dayton-area parents can go about choosing a school for their children from all the many options available to them includes a subtler version of that same rhetoric from anti-choice voices. Luckily, our own Aaron Churchill is on hand to offer some positive (and important) advice on the topic for readers. (Dayton Daily News, 7/13/22) - Meanwhile, I fear the spirit of Ned Ludd might be haunting the chamber were the state board of education met this week to discuss a computer science curriculum for Buckeye students. (Gongwer Ohio, 7/11/22)
- Setting aside the fact that this story reminds me of Beverly Goldberg’s stint as Quaker Warden on a TV sitcom, and setting aside some of the red flags raised (for me) regarding adult perceptions of high school students, Pickerington City Schools’ expanding “Parents on Positivity Patrol” program also appears to have at least two words in its name that are active misnomers. (ThisWeek News, 7/8/22)
- And finally today, staying on the twin topics of parents (sorta) and of misleading journalism (deffo), here’s a story pitched as “two Medina County moms” recommending summer math work to help keep kids’ skills sharp. Digging in, we see that these women are veteran classroom teachers who are selling a workbook product they created for profit as a side gig and are donating 15 percent of those profits to schools. At base, there’s nothing wrong with a local news channel running a story about this—it is, to my mind no different than covering a neighborhood lemonade stand—but it should be much clearer from headline and lede what it’s really about. Additionally, there a ton of red flags (again, dude?) in here for me. Among them: The first-hand observation of a lack of math basics in their students (and indeed in their own kids), with no cause attributed; the exclusion of reading skills from their definition of “summer slide”, because these guys aren’t English teachers; the quote, “No one really knows you know how to work on math with their child. No one knows what steps they should be taking or where they should be at different grade levels,” applied to parents writ large; the “no more than five minutes a day” nature of their workbooks, which is too little and leans toward math phobia; and the unwritten but obvious (to me) question of shouldn’t schools—meaning you two teachers—actually be doing most of this stuff when you’re on the clock, rather than leaving it to parents? (News 5, Cleveland, 7/13/22)
Did you know you can have every edition of Gadfly Bites sent directly to your Inbox? Subscribe by clicking here.
Politicians are notorious for handing out subsidies for certain projects and sectors of the economy. These goodies help them stay in power and appease special interests. But as Chris Edwards of the Cato Institute argues, they also create an uneven playing field in which legislators pick winners and losers at taxpayer expense. Unfortunately, Ohio’s new funding system isn’t immune to this pork-barrel practice. This piece looks at two special subsidies—one favoring small districts and the other larger, urban ones—that are baked into the new funding model. Legislators should reevaluate the need for both as they review the new formula in the coming months.
Small district subsidy via staffing guarantees
In last year’s overhaul of the formula, Ohio lawmakers created a new set of calculations that attempt to “cost out” what it takes to educate a typical student. To do this, the model relies on staff-to-pupil ratios, average employee salaries and benefits, and spending on other educational “inputs.” The computations produce a base cost for each district, which is then used in conjunction with a measure of property and income wealth to determine the bulk of state aid that districts receive. The basic equation is as follows:

That’s a lot to digest. But the key things to know for the purposes of this analysis are: (1) the base-cost per pupil is a critical factor in determining a district’s state funding and (2) the new formula yields variable bases that differ across Ohio’s 600-plus school districts. The latter is a significant turn from the previous formula which set a fixed base that applied to all districts, most recently $6,020 per pupil.
Table 1 shows a breakdown of base cost per pupil across Ohio districts. Most districts—roughly two in three—have bases within a narrow range of $7,000 to $7,500 per pupil. But a number of districts have higher amounts. Thirteen have bases above a whopping $10,000 per pupil—and all of them are teeny-tiny districts with enrollments ranging between 149 and 411 students. The next highest tier of base costs—$9,000 to $10,000—also consists of small districts with only slightly higher enrollments (average of 473). Only when we pass about 1,000 students in a district do the base costs settle into the more “normal” range.
Table 1: Ohio school districts’ base costs, FY 2022

* The statewide average base cost is $7,349 per pupil. While not included in this table, charter schools’ base-cost model is somewhat different and yields an average base of $7,337, with a range of $6,824 to $8,586 per pupil. Due to the phase-in of the HB 110 funding model, districts and charters are not actually being funded at these base amounts in FYs 2022–23 (these would be the amounts under a fully-funded formula). Source: Ohio Department of Education, Foundation Funding Report (FY 22 May #2 payment file).
What is causing this escalation in base costs? It’s actually due to a mechanical quirk in the base-cost model. As mentioned above, this model relies on student-to-staff ratios to determine the number of employees assumed to be needed—and thus “costed out”—in a district. Things get interesting, however, due to a policy that guarantees a minimum number of employees in certain staff positions. Table 2 shows how the minimum plays out for the “special teachers” (e.g., arts, music, and PE) portion of the base-cost model. Districts with more than 900 students are prescribed special teachers strictly by ratio (150:1). But those with enrollments under this threshold receive more teachers (six) than what the formula otherwise prescribes.
The upshot: The staffing minimums increase the per-pupil base costs for Ohio’s smallest districts—they are, for formula purposes, “overstaffed”—which in turn, inflate their state funding.[1] By my ballpark estimation, the minimums would cost the state roughly $150 million to $200 million per year under a fully implemented formula, or about 2 percent of the state’s annual funding for K–12 education.
Table 2: How the special-teacher staffing minimum works
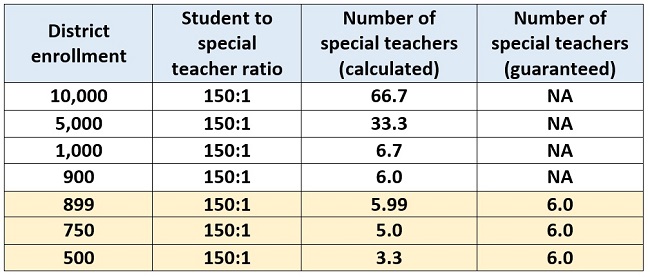
The staffing minimums give Ohio’s smallest districts—though interestingly, not charter schools, which serve comparable numbers of students—special treatment through the base-cost model. Some may argue that small districts face higher costs due to lack of scale. But there are ways that districts can operate cost-effectively. One possibility, strongly encouraged back in 2012 by the Kasich Administration, is to share services and personnel. Small districts, for example, could team up to share art and music teachers or administrative and maintenance staff. Some districts, in fact, already do this: Cloverleaf and Medina, for instance, share a treasurer. Districts could also leverage regional educational service centers, joint-vocational districts, or institutions of higher education to provide special programming, college and workforce counseling, or back-office support.
In the end, no district has to go it alone. Opportunities abound to build scale without sacrificing—and perhaps even enhancing—educational quality. Districts also don’t have to do this through consolidation; this can all be done organically and voluntarily without losing local autonomy. Unfortunately, the formula’s small-district subsidy—buried deep within the base-cost model—discourages cost-effective problem solving that can benefit both taxpayers and students. Moving forward, legislators should remove this special subsidy by eliminating the staffing minimums from the base-cost formula. All districts’ base costs—and charters’ too—should be calculated in the same manner. In a formula touted as the “fair school funding plan,” that’s only fair.
Urban district subsidy via “supplemental targeted assistance”
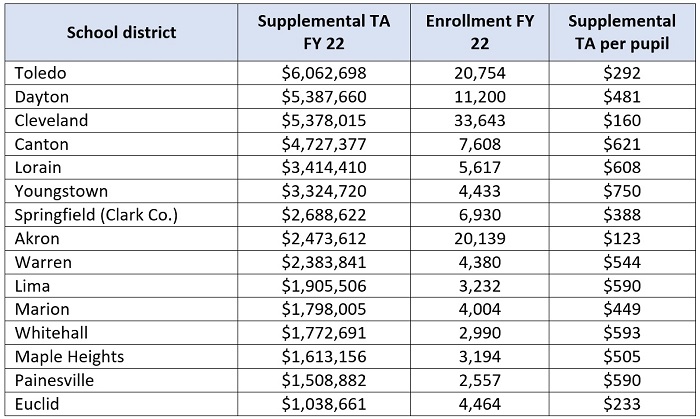
Ohio’s smallest districts aren’t the only beneficiaries of an extra subsidy that deviates from formula calculations. Also hidden in the funding system is a new $54 million per year outlay called supplemental targeted assistance. If a district had a sizeable proportion of students in choice programs and was relatively poor in FY 2019, it receives these funds. Based on these parameters, just thirty-six districts got the extra funding. Table 3 displays the districts that received more than $1 million in supplemental targeted assistance in FY 2022. Taken together, these fifteen districts—largely big-city and inner-ring urbans—collected 84 percent of the total subsidy ($45.5 million). Note that much like the staffing guarantees, charters are not eligible for these dollars.
Table 3: Districts receiving the most supplemental targeted assistance (TA) in FY 2022
Source: Ohio Department of Education, Foundation Funding Report (FY 22 May #2 payment file).
Though not an enormous amount, the dollars funneled through this component are another unnecessary subsidy, this time propping up urban districts that have historically “lost” significant numbers of students to choice programs. It’s clearly not formula-driven funding; it’s not at all tied to a district’s current enrollments and wealth. Instead, it looks back on old data to provide excess dollars to an extremely narrow group of districts (just 6 percent of them). Maybe legislators intended it to be a “payoff” to districts that have long bemoaned the transfer of state funds to students’ schools of choice. If that’s the aim, it sure isn’t working. Toledo Public Schools—the largest beneficiary of the subsidy in absolute dollars—recently joined the lawsuit against EdChoice (perhaps using these funds!).
Now, sending extra funds to select districts—ones getting strong results for kids—would make perfect sense in a performance-based funding component. But that’s hardly the case here. In fact, one could view it as a bizarre reward for districts that have fared poorly in meeting the needs of resident families. And while many of these districts are high-poverty, that is addressed through the other mechanisms in the formula, including—as noted above—the “state share percentage,” which ensures that more state aid is steered to poorer districts, along with a large funding bucket based on economically disadvantaged student counts. In sum, this funding stream sends extra dollars—more than what the formula prescribes—to a small number of districts for reasons that simply don’t make good sense.
***
The proponents of the HB 110 model regularly argued last year that a school funding formula should treat all districts fairly—without favoring certain ones over others. And they’re right. But the current formula doesn’t quite achieve the promised goal due to the special carveouts discussed here. As legislators consider whether to fully fund this system as is or make changes to it, they should work to ensure that all schools receive dollars under an evenhanded formula.
[1] In addition to the special-teachers minimum, districts are guaranteed at least five student-wellness-and-success staff, two district administrators, two fiscal-support staff, one high school counselor, one superintendent, one treasurer, one EMIS staff, one administrative assistant, and one school-level clerical staff.
- Five voter-determined seats on the state board of education are up for election in November. However, the final boundaries of state board districts appear to be bound up in the ongoing kerfuffle over legislative district maps ahead of the August candidate filing deadline. Regardless of how it all shakes out, the claim of “legal limbo”, as noted in the headline, is likely in the eye of the beholder. (Columbus Dispatch, 7/10/22)
- After last week’s Dayton-area discussion, here’s a look at the picture of summer programming for students in the Cincinnati area. There are interesting comparisons to be made here regarding pre-pandemic summer offerings (nothing at all in Reading Community City Schools, classic “you don’t want to go to icky summer school, do you?” summer programming in North College Hill City Schools), pandemic learning-loss (big deal in Cincinnati City Schools, non-existent in Loveland City Schools), ESSER-funded programming the last few years (monster effort in Cincinnati, new school year “jumpstart” program in Reading), and what all this means for the future of summer programs once the federal money runs out (“We just won't be able to keep doing the same thing for free,” says a Loveland official; “We'll find a way to keep it this way,” says a North College Hill official.) Fascinating. (Cincinnati Enquirer, 7/10/22)
Did you know you can have every edition of Gadfly Bites sent directly to your Inbox? Subscribe by clicking here.
There’s a growing body of research confirming the positive impact of extracurricular and enrichment activities for kids. Field trips help students improve critical thinking and boost factual knowledge. Consistent participation in extracurricular activities between eighth and twelfth grade predicts academic achievement and prosocial behaviors. The academic eligibility requirements high school athletes must meet have decreased dropout rates among at-risk students, and increased participation in high school sports has been especially good for girls.
Unfortunately, participation in extracurricular and enrichment activities is less common among students from lower-income families, largely due to the cost of participating and a dearth of opportunities. A 2014 analysis of four national longitudinal surveys of American high schoolers found growing income-based differences in extracurricular participation, which could be attributed to rising income inequality. The pandemic has made things worse: Providers have closed, low-income families have less to spend, and the enrichment gap is widening.
To its credit, Ohio has taken a direct approach in attempting to diminish this gap. During the last budget cycle, state lawmakers used federal Covid relief funds to create the Afterschool Child Enrichment (ACE) educational savings account. ACE provides families whose income is at or below 300 percent of the federal poverty line with $500 per student that can be used to pay for a variety of enrichment activities for children between the ages of six and eighteen. Activities include (but are not limited to) before- or after-school educational programs, day camps, field trips, language or music classes, and tutoring. ACE accounts can be opened for any student who attends a public or private school, as well as for those who are homeschooled.
ACE has the potential to help a lot of families. Considering the benefits outlined above—not to mention the equity implications of ensuring that all Ohio children have access to extracurricular and enrichment opportunities—getting ACE up and running in an effective and efficient way is extremely important. Unfortunately, three implementation challenges have so far limited the initiative’s impact.
1. The program’s launch was delayed
According to the Ohio Revised Code, the program was supposed to be up and running by the end of January so that families could create their accounts and have plenty of time before summer—prime time for enrichment and extracurricular activities—to choose a provider and services for their child. But that deadline wasn’t met. According to the user manual for applicants, the Ohio Department of Education (ODE) didn’t start accepting requests from families to determine their ACE eligibility until April 11. That’s more than two months after the deadline set by lawmakers. This delay left families who wanted these funds to access summer programs just a few weeks to fill out all the necessary paperwork, get approved, and identify a provider. The recently passed House Bill 583 took some of the timing pressures off families by allowing unspent ACE funds to remain in accounts until students graduate from high school. But that adjustment doesn’t change the fact that families who wanted to use ACE funds this summer were severely limited in their ability to do so.
2. The application process is burdensome
Once the program was finally up and running, families had to deal with a lengthy and confusing application process. Although the instructions for parents and guardians posted on ODE’s website seem simple enough, the user manual for applicants outlines several steps. First, families must create an OH|ID account, a system that allows Ohioans to securely access several state agencies. Next, they must create an Ohio Department of Education profile within the OH|ID system. After that, they need to round up their income verification documents—the previous year’s W2 or federal tax return, four current pay stubs, and official documentation showing unemployment are among the acceptable documents—and then electronically submit them. Once all these steps have been completed, families can apply for an ACE account. ODE notes that it can take up to two weeks for income verification to be complete, and that even once families are approved for an ACE account, they must also sign up with Merit International, the vendor chosen by ODE to manage ACE. It’s also worth noting that this entire process is online—bad news for families that don’t have reliable internet access or internet-enabled devices—and that all ODE offers as ongoing support for families is an email address where they can send their questions.
3. Many families seem unaware that the program exists
One of the defining features of the enrichment gap is that low-income students don’t have the same access to extracurricular opportunities as their more affluent peers. That’s why it’s so unfortunate that even though lawmakers created a program to address the access gap, the state hasn’t done a good job of notifying families of the opportunity. Recent coverage in Gongwer notes that although $50 million was allocated to support the program during its first year, only $106,749 in claims have been approved so far for just over 6,000 families. Sue Cosmo, the director of ODE’s Office of Nonpublic Educational Options, acknowledged that the program is “well below capacity” both in terms of participating families and providers, and that the department is “working on developing a package of marketing materials and social media content” to increase awareness and participation. Hopefully those efforts come to fruition sooner rather than later.
***
It’s worth noting that the issues outlined above aren’t the only problems currently plaguing the ACE program. Anecdotal reports also indicate that the reimbursement process is slow and cumbersome for both families and providers, and that there are several geographic regions that lack services, making it difficult for some approved families to actually use their ACE dollars. It’s understandable that some challenges would surface in a first-year program. But given the potential of ACE accounts and how important these opportunities are for kids, fixing these issues is critical. As the program enters its second school year, the state needs to streamline the application and reimbursement processes as much as possible, offer better support to families who have questions and need help, and do a much better job of spreading the word that the program exists. Getting these details ironed out will ensure that more Ohio families can take advantage of this worthwhile program.
CSP rules finalized
The U.S. Department of Education this week released finalized rules for applicants to the Charter Schools Program (CSP), following receipt of over 25,000 public comments on the draft version published earlier this year. The final rules give a little leeway on some of the issues most concerning to charter advocates, such as determining community need for new or expanded schools, but the editorial board of the Wall Street Journal called out several continued sticking points which remain.
The “dash for cash”
With CSP rules finalized, the very brief application window has now opened. We should soon see how the rules play out as the deadline for CSP applications is August 5, less than a month away.
Summer programming delayed
A sad story out of Toledo about Autism Model School, whose building was broken into and vandalized four times in the month of June. Summer programming for students has been delayed while things are being cleaned up and repaired.
Changing the conversation
Former district school board member Vickey Melcher was recently appointed as a commissioner for the Washington State Charter School Commission and she says she wants to “change the conversation about charter schools” in the Evergreen State. She told the Columbia Basin Herald this week that charter schools are simply another option for Washington students and while traditional district schools work for many students, they don’t work for every kid. And all children deserve an equal opportunity to receive an education that benefits them and their needs. Nice!
*****
Did you know you can have every edition of the Ohio Charter News Weekly sent directly to your Inbox? Subscribe by clicking here.
- “Great”. “Astounding”. “Life-changing”. These are a few of the adjectives used by the editorial board of the Toledo Blade in lauding Ohio’s College Credit Plus program, which is getting ready to expand in area high schools. With these, and with the eds’ assertion that CCP has “saved” students $883 million in university tuition over the years, I feel like some circumspection is called for on the part of readers. (Toledo Blade, 7/6/22)
- Speaking of circumspection, here is a story about summer experiences for Dayton area students couched in data and discussion of how badly students fell behind during pandemic-disrupted school years. The message is that all stops are being pulled right now to help kids “catch back up” from the Covid slide. However, if you dig a bit, you will see there is less substance here than the hype would suggest. We get reiteration that Dayton City Schools has already beaten the slide, so they say, and are already back to 2019’s levels of…ahem…student achievement. One of the other districts featured here says the same. But they are soldiering on with summer learning experiences to really hammer home the gains for their kids. Another (bougie suburban) district is so confident in their work last school year that they are offering nothing at all but rest and relaxation for students and staff. It also interesting to note here—as we did last week—that most of the summer offerings discussed are already completed with nearly two months to go until the new school year. If you’re still looking for a camp for your kid, your school district might not be the place to find it. (Dayton Daily News, 7/8/22)
Did you know you can have every edition of Gadfly Bites sent directly to your Inbox? Subscribe by clicking here.
The Supreme Court’s 6-3 decision in Carson v. Makin, telling Maine it must not deny tuition assistance to families solely because the private schools they choose are religious, may not make a huge difference on the ground in the Pine Tree State, since liberal legislators had already inserted a “poison bill” into the law authorizing such aid. They now deny “town tuitioning” payments to any private school, secular or sectarian, that discriminates on the basis of gender identity and sexual orientation.
That constraint hasn’t fazed the several dozen secular private schools—mostly small and in small towns—that already participate. It likely won’t cause indigestion for some of Maine’s religious schools. But it’s apt to prove unacceptable to the two conservative Christian schools whose religiousness is what kicked off the lawsuit. They’ve signaled that they won’t take the money if it means changing their curricula or admission standards.
Welcome to the complicated universe of private elementary-secondary schooling in America circa 2022 and the innumerable twists and turns of efforts to use public funds to help families access schools that suit them.
It’s a big universe, too: more than 30,000 schools (in 2019)—roughly one-fourth the total—enrolling some 4.7 million pupils (9 percent) and employing half a million teachers. Charter schools and homeschooling are coming on strong, but private schools still offer the most options.
This sector is far older than public education and infinitely more varied, such that bean counters have difficulty even sorting its schools into coherent categories.
The latest big federal survey (2015) reported that “Sixty-seven percent of private schools, enrolling 78 percent of private school students...had a religious orientation or purpose.”
The one-third that are secular contains most of America’s big-name prep schools and upscale “independent” schools. But it also contains thousands of “special education” schools for youngsters with disabilities, with attendance often paid by their school districts, as well as thousands of “special emphasis” schools that range from Montessori to science, from agriculture to giftedness.
On the far larger sectarian side, subcategories proliferate, as do vast differences in scale. The 2015 survey reported twenty-eight different groupings plus 304 schools described as religious but fitting into none of the groups.
Much the largest, as has been true for more than a century, are Roman Catholic schools, of which there were 7,000, enrolling almost two-fifths of all private school pupils. But Catholic schools have been closing for decades and their enrollment share has slowly eroded. In 1993 for example, statisticians counted 2,300 more schools than in 2015. As for pupils, the number in Catholic schools in 2019 (1.7 million) was down 15 percent from ten years earlier.
The second biggest religious-school cluster in 2015 was the messy category dubbed “Christian” schools. Perhaps surprisingly, it does not include such traditional denominations as Episcopal (354 schools), Methodist (289), Presbyterian (323), Adventist (795), Baptist (1863), or Lutheran (several flavors, totaling about 1,500). It certainly doesn’t include Jewish schools (1,120) or Islamic (293). And it’s unclear where to place Amish schools—a whopping 2,105, say the enumerators, but with cautions about data reliability.
The “Christian” category numbers about 6,000 schools and has been expanding, by some gauges expanding as fast as the Catholic sector has shrunk. It incorporates vast, multi-campus school empires, as well as tiny institutions with just a couple of teachers. What they have in common, above all, is that, along with religious instruction and religious formation, they strive to buttress the beliefs, principles, and morals of parents who seek them out. Overwhelmingly, that means conservative.
Parents who opt for any form of private education for their daughters and sons ordinarily seek something different from—and often better than—what’s on offer in local public schools. Safety is frequently a consideration, as, sometimes, is having classmates who look like their kids.
Those who opt for sectarian schools typically also seek to instill a belief system and religious observance in their children. (Not always. For inner-city families, the local parochial school may be the only—or only affordable—alternative to dire neighborhood schools. Hence many thousands of non-Catholic Black children attend Catholic schools.)
But when choosing Christian schools in particular, along with the usual motives, parents often search for escape and protection from the “wokeness,” political correctness, amorality, and Godlessness that they observe in other schools, both public and private. It’s no surprise, then, that schools with a mission to serve such families may run afoul of government rules, prohibitions, and watchdogs.
Such issues can arise even when little or no money is on the table, as states conventionally license private schools even to operate and be recognized as places that satisfy compulsory-attendance laws for children. This gets really gnarly in the homeschool sector but presents challenges for some schools, too. Ohio, for example, (confusingly) “charters” private schools, a designation that brings many benefits, including potential access to the Buckeye State’s several voucher programs. But state chartering is optional in cases of “truly held religious beliefs,” and Ohio’s list of “non-chartered, non-tax supported” schools numbers 500-plus. These are schools (or sometimes home-schoolers calling their kitchen tables schools) willing to forego all public recognition and aid in order to avoid all forms of government entanglement.
Some of these schools are miniscule, others substantial. The Agape Christian Academy, for example, enrolls some 250 pupils from kindergarten through high school on two campuses. Its stated mission is “To work together with the home and church to provide each student with a Christ centered, quality education.”
Such schools are admonished by the state to abide by core norms, such as obeying fire laws and promoting only students “who have met the school’s educational requirements.” But it’s all self-reported. Rarely do state officials check. And there’s little they can do about miscreants.
Ohio’s list of “chartered” private schools has 729 entries, ranging from Cleveland’s posh Western Reserve Academy to the eight-one-pupil St. Mary of the Assumption elementary school in little Van Wert on the Indiana border. A whopping 588 of those schools took part this past year in at least one voucher program—but 141 did not.
Reasons vary. Some schools don’t need the money or don’t have room for more pupils. Some have exotic specialties or idiosyncratic admissions requirements. But others simply prefer to avoid the additional entanglements that come with the king’s shilling, even though Ohio rules with a fairly light hand and is relaxed about religious schools.
It’s one of thirty-one states, predominantly red and purple, that, according to the American Federation for Children, now have at least one “private school choice program”—a number that omits Maine and Vermont with their century-old “tuitioning” options for towns too small to operate their own public schools. Not all such programs are “publicly funded” in the usual sense, as the “tax credit” versions simply reduce monies that would otherwise enter government coffers. But almost none is unrestricted. Some voucher programs, such as Florida’s pioneering “Mackay Scholarships,” are entirely for youngsters with disabilities. And many programs are means-tested, such that families qualify only if their income falls below a prescribed threshold.
For school-choice supporters, recent decades have seen huge progress. But the strings are tighter in some jurisdictions than others, and thousands of private schools, including many with precarious finances, insist on minimizing government entanglements, particularly any that bear on curriculum, admissions, and employment. For them, those end-of-year state tests of reading and math are anathema. So are non-discrimination rules that they fear may oblige them (for instance) to teach children about transgenderism or the race-tinged “1619 project.” It can be important to a sectarian school to hire only co-religionists. And more.
Yes, it’s a diverse and confusing universe. But the virtue of private schools is that they’re different. And that means very different from each other, too.
I read Mike Petrilli’s very interesting article “How to narrow the excellence gap in early elementary school” in Fordham’s June 2 Education Gadfly Weekly. He observes that “...many more Black and low-income students are achieving at high levels in kindergarten, especially in reading, than in later years. This indicates that something is causing the excellence gap to widen in the early years of elementary school. (Other achievement gaps tend to grow during these early years, as well.)”
I have been studying the achievement gap for many years using various data sources, beginning with the Coleman Report data in the mid-sixties and more recently with a number of statewide databases. In my experience, and from the data I have examined, the Black-White achievement gap remains fairly constant from third grade through the end of middle school (eighth grade). The gap issue is less clear for the high school grades, since most statewide achievement testing programs do not test all of the high school years.
The charts below show achievement scores for two states, one in the Border South for the year 2012 and one in the South for the years 1999 to 2005. For the Border South state in figures 1–3, achievement scores are designed to reflect academic growth between grades three and eight. This state also has achievement scores for first grade and eleventh grade, but they are not calibrated to show growth (relative to grade three to eight scores). For the South state in Figure 4, tests are normed to equal the same mean and standard deviation for each grade three to eight.
Figure 1 shows mean reading scores for grades one, three to eight, and eleven. The scores have been standardized to have a mean of 100 and standard deviation of 10. The Black-White reading gap is about 0.6 SD’s in grade one, and it is very close to 0.6 in grades three through grade eight. The gap widens somewhat to 0.8 in eleventh grade.
Figure 1. Statewide reading scores for Black and White students, 2012

The Petrilli article was focused on “excellence,” and his examples refer to the highest scoring category on NAEP, which is “Advanced.” Although state achievement testing can use different terminology, in this state they use the same four levels as NAEP—Advanced, Proficient, Basic, and Below Basic—for all tested grades except first grade. Figure 2 shows the percent scoring “Advanced” in reading proficiency on the state reading exam for grades three to eight and grade eleven. The gap starts out at 24 percentage points in grade three, widens slightly to 27 points in grades four to six, then narrows slightly to 25 points in grades seven and eight. In grade eleven, the excellence gap narrows significantly to 19, which is a positive result.
Figure 2. Statewide percentage of Advanced proficiency for Black and White students, 2012

Figure 3 shows the gap for average math achievement for grade one and grades three to eight in the Border South state. Again, we see a relatively constant gap of 0.7 SD’s for grade one and approximately 0.6 for grades three to eight, although it does widen to nearly 0.8 for grade six. A single math achievement score is not available for high school grades because math courses diverge into separate subject matters, such as algebra, geometry, and trigonometry.
Figure 3. Statewide math scores for Black and White students, 2012

Finally, Figure 4 shows the statewide math achievement gap for Black and White students in a large southern state. Here the gap is a little larger, averaging about 0.8 standard deviations for all grades, but it varies only slightly from one grade to the next. The smaller variation may be due to the fact that these data follow the same cohort as the cohort ages from grade three to grade eight.
Figure 4. Statewide math scores for Black and White students, 1999 grade thee to 2005 grade eight
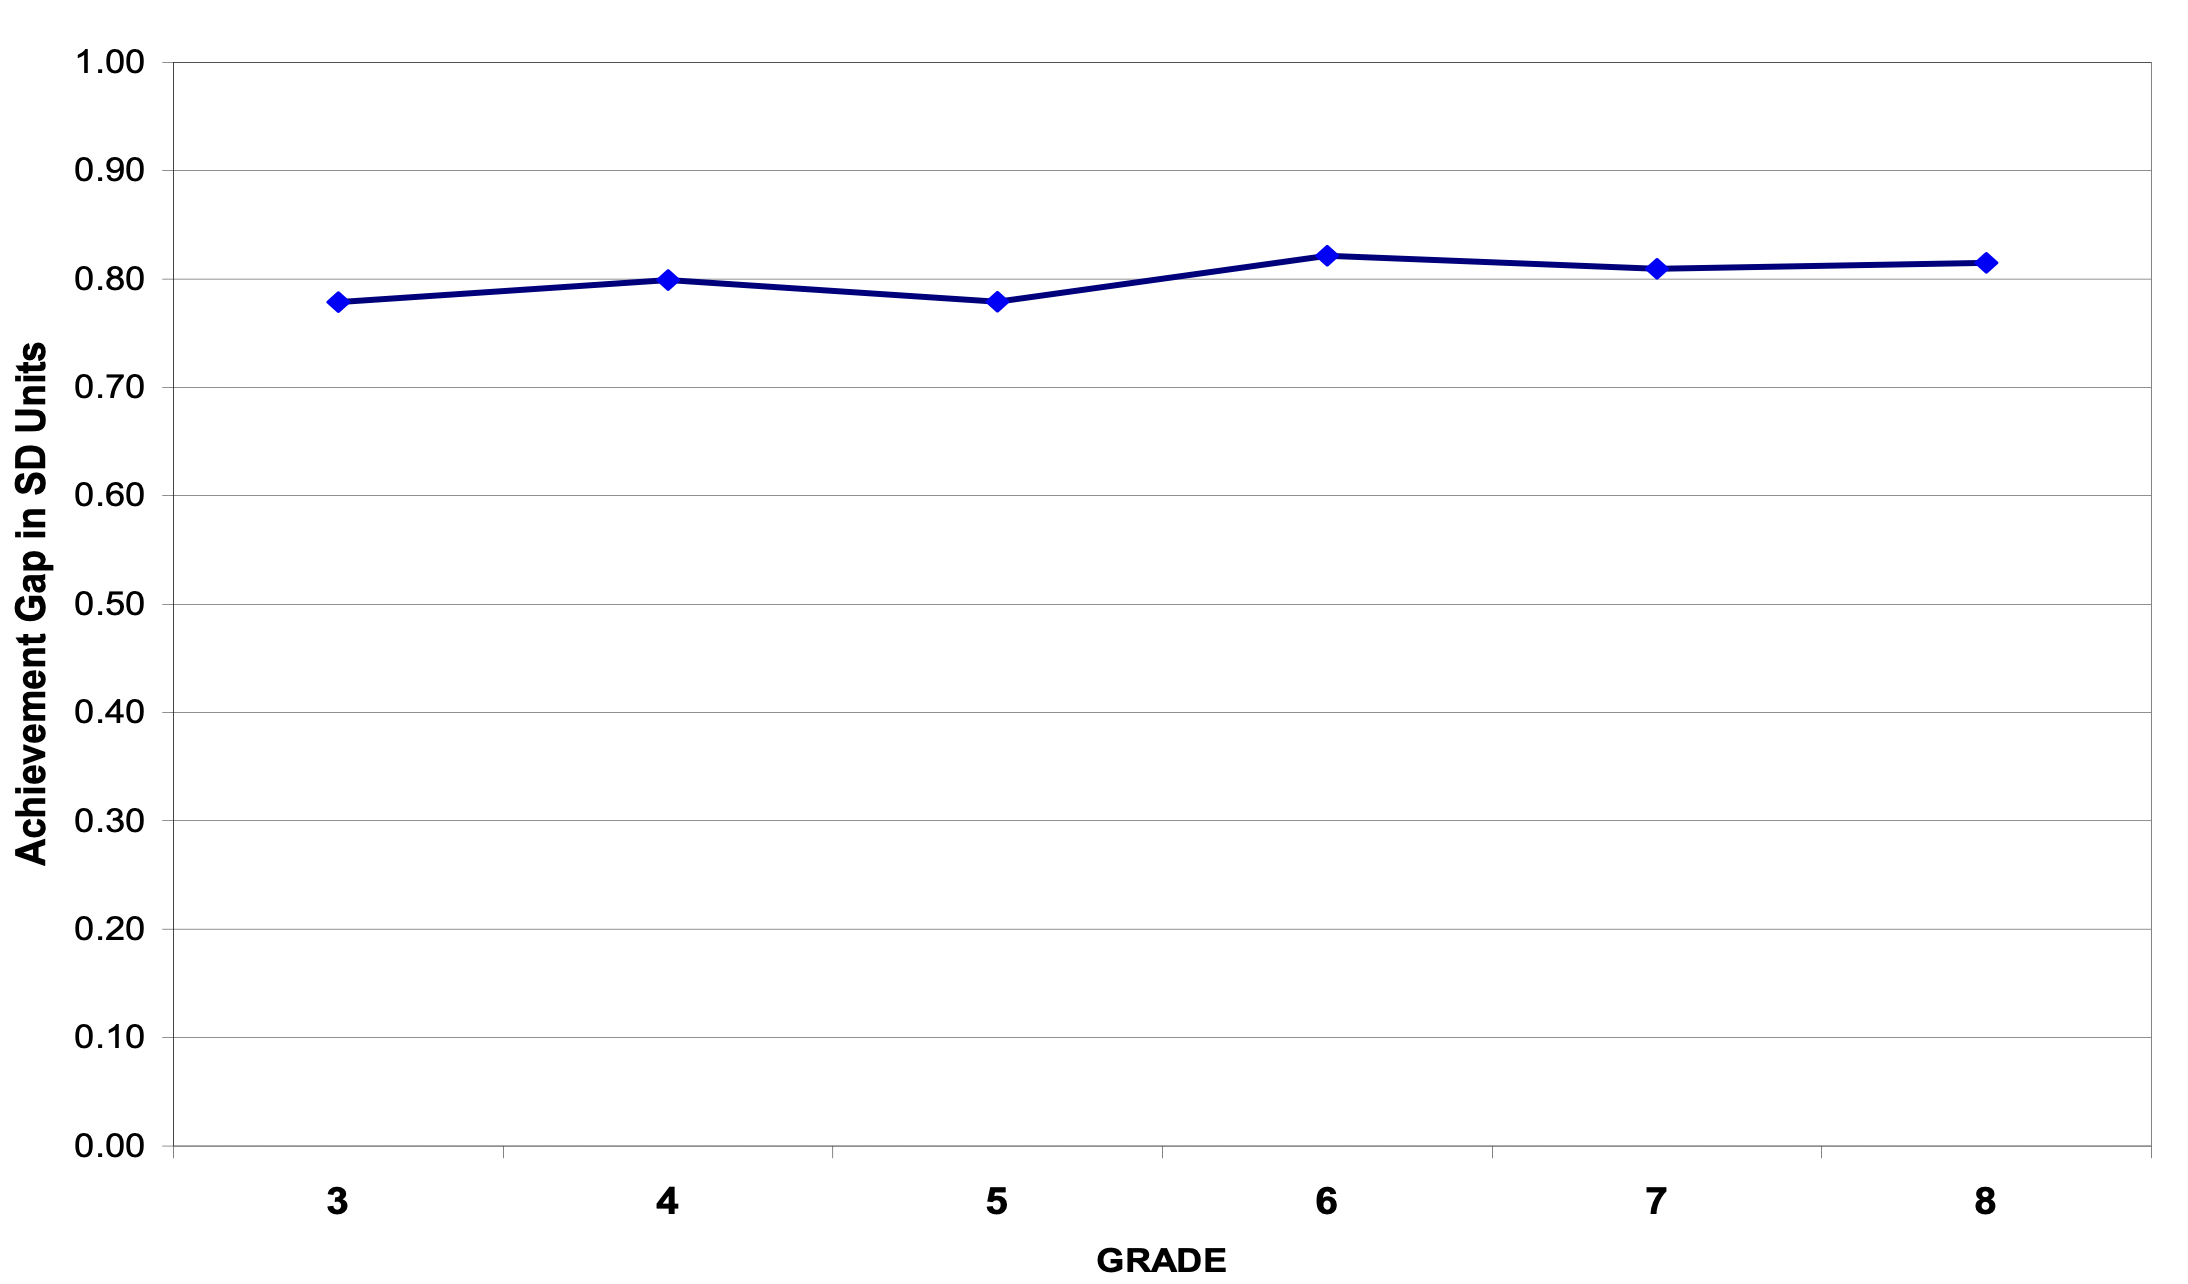
At least in these two states, achievement gaps do not change appreciably over the school years. On the one hand, this is good news for those concerned about schools making the achievement gap worse. On the other hand, it does not appear to shrink, either, which should motivate policy leaders to find methods that can help close the gap. Since many different school reforms have not had much impact on achievement gaps, successful policies may well have to take place before schooling starts, since the gap exists before children start school.
The relationship between teacher and student has profound effects on learning. A new study explores whether schools can strengthen this relationship over time by keeping students with teachers for more than one year.
Teacher effectiveness is traditionally viewed as a fixed characteristic: Some teachers produce greater student achievement, others not so much. The goal of school leadership is to hire and retain the former and separate from the latter. However, recent scholarship suggests that teacher effectiveness is instead “dynamic and context-specific, evolving over time.” Certain teachers are more effective at teaching certain students. And as this relationship grows and deepens, better results are produced.
The study uses student and teacher information from the Tennessee Education Research Alliance, which compiles data from the Tennessee Department of Education. The Volunteer State—long a champion of education reform—gathers sophisticated data about its students, so much so that all students can be linked to specific teachers in tested grades and subjects. This makes it possible to analyze almost all public school students in grades three through eight from spring 2007 to 2015, and most of their high school counterparts from 2007 to 2017, a dataset of almost 3.7 million students.
The study defines a repeat student-teacher match as a student having the same teacher for more than one school year. This broad definition encompasses various permutations. One form of repeat matching is looping, when a teacher moves to the next grade level with the same class of students. While practiced in some elementary schools, less than 2 percent of all teachers are loopers. “Unintentional looping” is far more common in the elementary grades. A teacher may be reassigned to a different grade in between school terms and turn out coincidentally have some students she/he has taught before, although the match isn’t always intentional.
Even more common are repeat matches in middle and high school. In these situations, many teachers are responsible for multiple classes in a given subject. A high school math teacher might teach algebra to freshmen, geometry to sophomores, and precalculus to juniors. Along the way, the same students may enroll in two of the classes or even all three. (The study omits students who repeat a grade with the same teacher.)
The researchers find that 44 percent of the sampled students had at least one repeat teacher over the course of their education, most commonly in the upper grades. Though just 2 percent of fourth grade students had a repeat teacher in a given school year, 11 percent of eighth grade students had one.
By using the Tennessee data to create statistical models, the researchers estimated students who had repeat matches would see a variety of benefits. Overall, having a repeat teacher was associated with an increase in test scores of 1.9 percentage points. Broken down by subject, the increase was 3.2 percentage points in math and 1.5 percentage points in English language arts. The effect of repeat relationships was stronger in math for high school students (+4.1 percentage points) than for students in grades three to eight (+2.4 percentage points). The reverse was true for ELA, where the effect was stronger for students in grades three to eight (+1.3 percentage points) than high school students (+0.7 percentage points). Positive effects were also seen in estimated behavioral outcomes. Having a repeat experience with a teacher reduced student absences by 0.5 percentage points and suspensions by 1 percentage point. All of these findings were statistically significant.
Differences became apparent when the estimates were broken down by student demographics. Students who were high performers the previous school year and White female students saw the biggest bump in academic achievement when repeating with a teacher. Lower performing students and Black and Hispanic males saw the largest reductions in absences, truancy, and suspensions. Having a repeat teacher reduced absences 3 percent for Black and Hispanic males.
The study has implications for school staffing. If there is evidence that extending relationships between students and teachers improves learning and behavioral outcomes, school leaders should make it standard practice. Intentional looping—mentioned above as accounting for less than 2 percent of teaching assignments—might become the norm in more elementary schools. Likewise, enrollment in middle and high school classes should prioritize keeping students and teachers together. Entire classes would not need to be preserved, as the study also demonstrated that classes of 50 percent repeaters had spillover effects for the students in the class who had not repeated.
The study suggests that rather than being a fixed quality, effectiveness is dynamic and dependent on the relationship between teachers and students. Multiple studies have shown the beneficial of having a teacher of color for students of similar backgrounds. Further research may suggest even more specific teaching relationships in which students may thrive. However, simply repeating a grade with a teacher may not be a panacea for low student achievement. More information is needed about the effects of repeating a grade with a minimally effective or ineffective teacher. And if a teacher needs multiple school years with a student to produce results, were they that effective to begin with? It’s a research area that demands more study.
SOURCE: Leigh Wedenoja, John Papay, and Matthew A. Kraft, “Second Time’s a Charm? How Sustained Relationships from Repeat Student-Teacher Matches Build Academic and Behavioral Skill,” EdWorkingPaper: 22-590, retrieved from Annenberg Institute at Brown University (June 2022).

